Sample Category Title
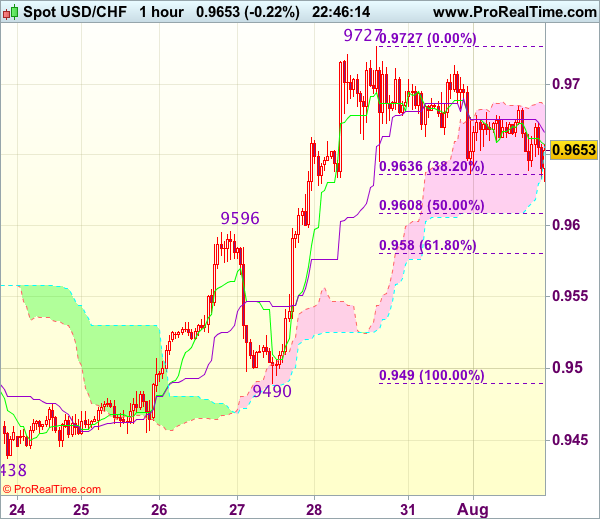
Trade Idea Wrap-up: USD/CHF – Buy at 0.9600
USD/CHF - 0.9655
Most recent candlesticks pattern : N/A
Trend : Near term up
Tenkan-Sen level : 0.9657
Kijun-Sen level : 0.9665
Ichimoku cloud top : 0.9689
Ichimoku cloud bottom : 0.9658
Original strategy :
Buy at 0.9600, Target: 0.9700, Stop: 0.9565
Position : -
Target : -
Stop : -
New strategy :
Buy at 0.9600, Target: 0.9700, Stop: 0.9565
Position : -
Target : -
Stop : -
Dollar’s retreat after faltering below resistance at 0.9727 (last week’s high) has retained our view that further consolidation below this level, hence risk of another retreat to remains, however, previous resistance at 0.9596 should turn into support and contain downside, bring another rise later, above said resistance at 0.9727 would extend recent rise to 0.9750-60, then 0.9780 but reckon 0.9800 would hold from here.
In view of this, would not chase this rise here and would be prudent to buy dollar on subsequent pullback as previous resistance at 0.9596 should turn into support and contain dollar’s downside. Below 0.9580 (61.8% Fibonacci retracement of 0.9490-0.9727) would defer and suggest a temporary top is formed instead, bring correction to 0.9540-50 but price should stay well above support at 0.9490, bring another rise later.
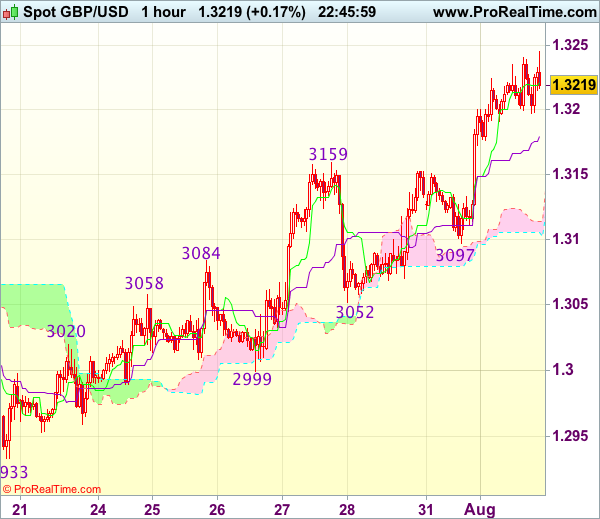
Trade Idea Wrap-up: GBP/USD – Buy at 1.3130
GBP/USD - 1.3216
Most recent candlesticks pattern : N/A
Trend : Near term up
Tenkan-Sen level : 1.3221
Kijun-Sen level : 1.3180
Ichimoku cloud top : 1.3114
Ichimoku cloud bottom : 1.3106
Original strategy :
Buy at 1.3130, Target: 1.3230, Stop: 1.3095
Position : -
Target : -
Stop : -
New strategy :
Buy at 1.3130, Target: 1.3230, Stop: 1.3095
Position : -
Target : -
Stop : -
Yesterday’s rally above previous resistance at 1.3159 confirms recent upmove has resumed and upside bias is seen for further gain to 1.3250, however, near term overbought condition should prevent sharp move beyond 1.3275-80 and reckon 1.3300-10 would hold from here, risk from there has increased for a retreat to take place later.
In view of this, would not chase this rise here and would be prudent to buy cable on pullback as the upper Kumo (now at 1.3114) should contain downside, bring another upmove later. Only below indicated support at 1.3097 would abort and signal a temporary top is possibly formed, bring further fall towards previous support at 1.3052.
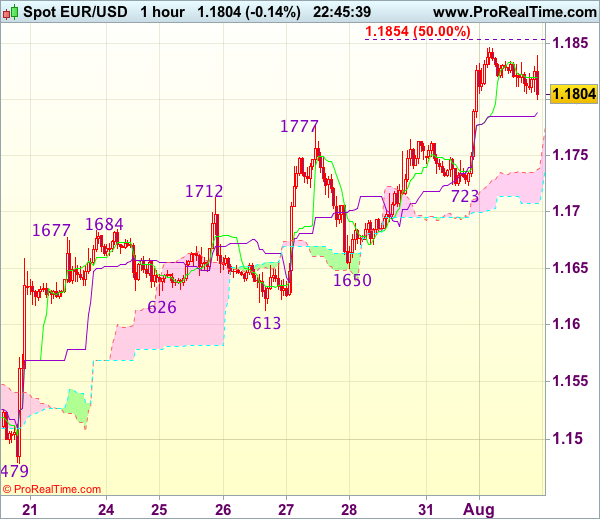
Trade Idea Wrap-up: EUR/USD – Buy at 1.1725
EUR/USD - 1.1793
Most recent candlesticks pattern : N/A
Trend : Near term up
Tenkan-Sen level : 1.1812
Kijun-Sen level : 1.1789
Ichimoku cloud top : 1.1738
Ichimoku cloud bottom : 1.1707
Original strategy :
Buy at 1.1750, Target: 1.1850, Stop: 1.1715
Position : -
Target : -
Stop : -
New strategy :
Buy at 1.1725, Target: 1.1840, Stop: 1.1690
Position : -
Target : -
Stop : -
As the single currency has maintained a firm undertone after yesterday’s rally above last week’s high at 1.1777, adding credence to our bullish view that recent upmove from 1.0340 low is still in progress and upside bias remains for further gain to 1.1850-55 (50% projection of 1.1370-1.1777 measuring from 1.1650) but loss of near term upward momentum should prevent sharp move beyond 1.1875-80 and price should falter below 1.1900-05 (61.8% projection), risk from there has increased for a retreat later.
In view of this, would not chase this rise here and would be prudent to buy euro on pullback as support at 1.1723 should limit downside. Below the lower Kumo (now at 1.0707) would defer and suggest top is possibly formed, bring retracement of recent rise to 1.1680-85 first but indicated support at 1.1650 should hold.
US Personal Income Growth Stalls in June; Dollar Falls after ISM Data
Personal income in the United States was flat in June as a drop in incomes from personal dividends and interest following a big jump in May contributed to the weakest reading in seven months. Expectations were for incomes to rise by 0.4% month-on-month, following a downwardly revised 0.3% gain in May. Disposable income, when accounting for inflation, fell by 0.1% m/m after increasing by 0.5% in the previous month.
Personal spending grew in line with analysts' estimates, rising by 0.1% m/m in June, and there was an upward revision from 0.1% to 0.2% in the prior month's figure. This was the third consecutive month of a slowdown in consumption, and could potentially be a sign of softer consumer spending going into the third quarter.
Growth in the US economy rebounded from an annualized rate of 1.2% to 2.6% in the second quarter of the year on the back of stronger consumer spending and exports. Consumption accounts for around 70% of the US economy and any evidence of weaker spending could add to already declining expectations of a third rate hike by the Fed this year.
It wasn't all gloom however in today's data release. Wages and salaries picked up to 0.4% m/m in June after rising by just 0.1% in May. This could potentially indicate that personal incomes will bounce back in the coming months, supporting further increases in consumption.
In addition, the Fed's preferred measures of inflation - the personal consumption expenditure (PCE) price index and the core PCE price index - were both revised higher in May. The PCE price index was revised from 1.4% to 1.5% in May, though it eased to 1.4% in June. The core measure, which excludes food and energy components, was also revised up from 1.4% to 1.5% and was unchanged in June, suggesting the decline in the index since February wasn't as marked as initially estimated.
The US dollar held on to its modest rebound from a 6½-week low of 109.98 yen touched in Asian trading to around 110.50 yen in the European session after the PCE data came out. However, the greenback came under pressure to once again test the key 110 level after the release of the ISM manufacturing PMI.
The closely-watched index fell to 56.3 in July from 57.8 in the prior month, missing estimates of 56.5. Traders appeared to focus more on the ISM's headline figure and less so on the ISM manufacturing prices sub-index which rose sharply to 62.0 from 55.0, as well as the ISM manufacturing employment index, which fell to 55.2 but this was above expectations of 55.1.
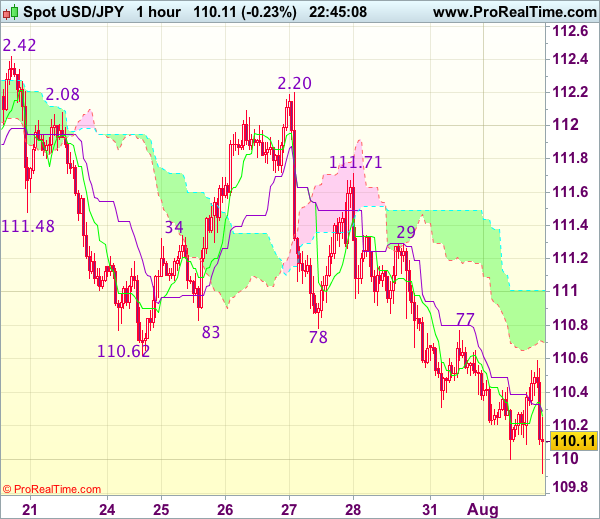
Trade Idea Wrap-up: USD/JPY – Sell at 110.90
USD/JPY - 110.13
Most recent candlesticks pattern : N/A
Trend : Near term down
Tenkan-Sen level : 110.26
Kijun-Sen level : 110.29
Ichimoku cloud top : 111.01
Ichimoku cloud bottom : 110.70
Original strategy :
Sell at 110.90, Target: 109.90, Stop: 111.25
Position : -
Target : -
Stop : -
New strategy :
Sell at 110.90, Target: 109.90, Stop: 111.25
Position : -
Target : -
Stop : -
As the greenback has remained under pressure, suggesting recent selloff from 114.50 top is still in progress and bearishness remains for this move to extend weakness to 109.75-80 but loss of downward momentum should limit downside to 109.50 and reckon 109.20-25 would hold.
In view of this, would not chase this fall here and would be prudent to sell dollar again on subsequent recovery as resistance at 110.77 should limit upside. Above the upper Kumo (now at 111.01) would defer and risk test of 111.29 resistance but only break there would signal a temporary low is formed instead, bring rebound to 111.50-55 first.
Weak End of the Quarter for Income and Spending
Personal income was basically unchanged in June, down $3.5 billion, while personal consumption expenditures were up slightly, by 0.1 percent. However, in real terms, these measures were even weaker.
Personal Income Receipts on Assets Plunge in June
Personal income was almost flat in June, declining $3.5 billion after an increase of $53.2 billion in May. However, the details were not as weak, especially in terms of wages and salaries. Wages and salaries increased $30.8 billion during the month with both goods-producing industries as well as services-producing industries recovering somewhat compared to the previous month. Wages and salaries in the goods sector were up $4.2 billion while they were up $22.9 billion in the services sector. However, all this effort by the producing side of the economy was more than reversed by personal receipts on assets. That is, personal interest income came down another $13.9 billion in June, the third consecutive $13.9 billion decline, while personal dividend income declined $29.9 billion after increasing $45.6 billion in May. This meant that personal income receipts on assets were down $43.9 billion during the month.
Meanwhile, disposable personal income was flat in June while real disposable personal income was even weaker, down 0.1 percent. After a strong showing during the first five months of the year disposable personal income was, perhaps, one of the biggest changes for the June personal income and spending release.
Personal Spending Was Also Weak
At the same time, both nominal and real personal spending were revised up in May but were almost flat in June. Nominal personal spending was up 0.1 percent after an upwardly revised 0.2 percent increase in May, while real personal spending was flat in June after an upwardly revised 0.2 percent in May.
Overall spending was up $8.1 billion after increasing $20.1 billion in May. Goods consumption was down $16.3 billion with the largest decline in nondurable goods consumption, down $11.0 billion versus a decline of $5.3 billion for durable goods. Meanwhile, spending on services was up $24.4 billion during the month, down from $31.1 billion in May, all seasonally adjusted at annual rates.
Second Quarter Ends on a Low Note
Although the quarterly numbers were released last week and both GDP as well as PCE recovered compared to the first quarter of the year, this release shows that both income as well as consumption ended the quarter relatively weak. Furthermore, we saw in last week's release that the revisions to the national account numbers showed a much lower personal saving rate than what the BEA had been reporting. That is, there has been a marked lowering of the personal saving rate compared to what we had previously. May's saving rate was originally reported at 5.5 percent. Now, it is only 3.9 percent while June's rate was 3.8 percent.
BOE Might Turn Less Divided after Weak Growth and Easing Inflation
We expect BOE to leave the Bank rate unchanged at 0.25% and the asset purchase program at 435B pound at the upcoming meeting. The vote split might probably come in at 6-2 from 5-3 in June, as Silvana Tenreyro, successor of Kristin Forbes appears less hawkish and noted that the monetary policy decision would be data-dependent. Members favoring a rate hike were mainly hinged on the fact that inflation has been overshooting the central bank's target. However, there was a sign of slowdown on the consumer price level in June, offering room for policymakers to stand on the sideline amidst lackluster economic growth and wage, as well as uncertainty in Brexit negotiations.
UK GDP expanded +0.3%q/q in 2Q17, up from +0.2% in the first quarter, as driven by services, which grew +0.5% following a +0.1% growth in 1Q17. The largest contributors to growth in services were retail trade, which improved after a fall in the first quarter, and film production and distribution. Construction and manufacturing were the largest downward pulls on quarterly GDP growth, following 2 consecutive quarters of growth. Growth in the first half of the year markedly weakened from the same period last year. The Office for National Statistics called a "notable slowdown in the first half. It added, however, that "the economy is now 9% above its pre-downturn peak".
The job market continued to improve with total employment increasing +175K in the three months to May. The unemployment rate fell to 4.5%, the lowest since June 1975 during the period. However, wage growth disappointed with the three-month average real total pay dropping -0.7%, the fastest decline since August 2014, in May. The three-month average growth rate for regular pay, excluding bonuses, climbed modestly higher to +2% from +1.8% in April.
Overshooting the +2% inflation target has been a headache for the MPC and the key reasons for the hawks to propose a rate hike. However, signs of slowing price level were seen in June. Inflation rate fell to +2.6% y/y in June, from +2.9% in the prior month. The reading came in weaker than expectations, mainly due to falling petrol price.
Kristin Forbes, one of the three hawks, stepped down in June and is replaced by Silvana Tenreyro, who appears less hawkish than Forbes and has repeatedly warned about the negative effects of Brexit on growth. We expect her to vote for keeping the policy unchanged in August.
GBPUSD: Bullish, Follows Through Higher
GBPUSD: The pair continuing to retain its upside threats on correction, more strength is envisaged. Support lies at the 1.3150 level where a break will turn attention to the 1.3100 level. Further down, support lies at the 1.3050 level. Below here will set the stage for more weakness towards the 1.3000 level. Conversely, resistance stands at the 1.3250 levels with a turn above here allowing more strength to build up towards the 1.3300 level. Further out, resistance resides at the 1.3350 level followed by the 1.3400 level. Its daily RSI is bullish and pointing higher suggesting further upside pressure. On the whole, GBPUSD continues to face upside risk though with caution.
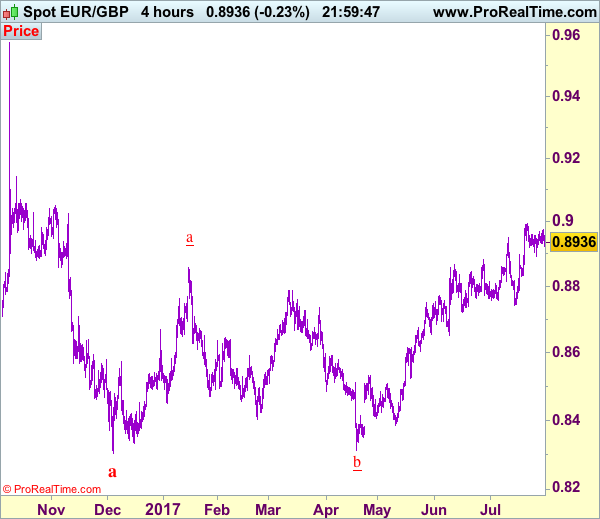
Trade Idea: EUR/GBP – Hold long entered at 0.8925
EUR/GBP - 0.8943
Recent wave: Major double three (A)-(B)-(C)-(X)-(A)-(B)-(C) is unfolding and 2nd (A) has possibly ended at 0.6936.
Trend: Near term up
Original strategy :
Bought at 0.8925, Target: 0.9025, Stop: 0.8885
Position : - Long at 0.8925
Target : - 0.9025
Stop : - 0.8885
New strategy :
Hold long entered at 0.8925, Target: 0.9025, Stop: 0.8885
Position : - Long at 0.8925
Target : - 0.9025
Stop : - 0.8885
Although the single currency has retreated after rising to 0.8976 and further consolidation would be seen, as long as indicated support at 0.8891 holds, mild upside bias remains for another rebound, above said resistance at 0.8976 would signal the pullback from 0.8995 has ended, bring retest of this level, however, break there is needed to confirm upmove has resumed for test of psychological resistance at 0.9000, then 0.9020 but reckon upside would be limited to 0.9050 due to overbought condition, risk from there has increased for a retreat later.
In view of this, we are holding on to our long position entered at 0.8925. A break of said support at 0.8891 would defer and suggest a temporary top is formed instead, bring correction to 0.8860-65 but only break of support at 0.8829 would provide confirmation, bring correction to 0.8800 first.
Our preferred count is that, after forming a major top at 0.9805 (wave V), (A)-(B)-(C) correction is unfolding with (A) leg ended at 0.8400 (A: 0.8637, B: 0.9491 and 5-waver C ended at 0.8400. Wave (B) has ended at 0.9413 and impulsive wave (C) has either ended at 0.8067 or may extend one more fall to 0.8000 before prospect of another rally. Current breach of indicated resistance at 0.9043 confirms our view that the (C) leg has ended and bring stronger rebound towards 0.9150/54, then towards 0.9240/50.
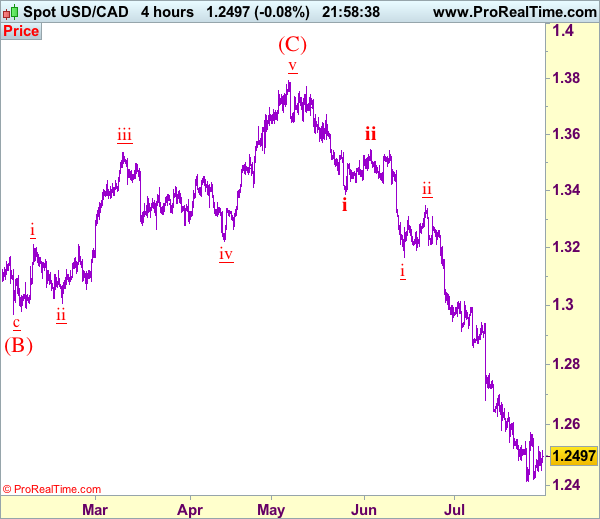
Trade Idea: USD/CAD – Sell at 1.2690
USD/CAD - 1.2498
Recent wave: Only wave v of c has ended at 0.9407 and wave C of major A-B-C correction is underway with wave iii ended at 1.4690, wave v of C may bring one more marginal rise probably in 2018
Trend: Down
Original strategy :
Sell at 1.2690, Target: 1.2490, Stop: 1.2750
Position: -
Target: -
Stop: -
New strategy :
Sell at 1.2690, Target: 1.2400, Stop: 1.2750
Position: -
Target: -
Stop:-
As the greenback held above last week’s low at 1.2414 and recovered, retaining our view that further consolidation would take place and another corrective bounce too 1.2575-80 is likely, above there would bring retracement of recent decline to 1.2640-50 but reckon 1.2700-05 would limit upside and bring another decline later, below said support at 1.2414 would signal downtrend has resumed and extend weakness to 1.2400, then towards 1.2350-60, however, oversold condition should prevent sharp fall below 1.2330 and reckon 1.2300 would hold, risk from there is seen for a rebound later. We are keeping our count that wave v as well as wave (C) ended at 1.3794 and impulsive wave (i ii, i ii) is now unfolding with minor wave iii still in progress, hence bearishness remains for this fall to extend weakness to aforesaid downside targets.
In view of this, would not chase this fall here and would be prudent to sell the pair again on recovery as 1.2690-95 should limit upside. Above 1.2745-50 would defer and risk a stronger rebound to 1.2800-10 but only break of latter level would signal a temporary low is formed instead, bring retracement of recent decline to 1.2850, then 1.2900, however, price should falter below 1.3000 and the greenback shall head south again from there.
To recap, wave B from 1.3066 is unfolding as an a-b-c and is sub-divided as a: 1.2192, b: 1.2716 and wave c is a 5-waver with i: 1.1983, ii: 1.2506, extended wave iii with minor iii at 1.0206, wave iv ended at 1.0781 and wave v as well as wave iii has ended at 0.9931, hence the subsequent choppy trading is the wave iv which is unfolding as (a)-(b)-(c) with (a) leg of iv ended at 1.0854, followed by (b) leg at 1.0108 and (c) leg as well as the wave iv ended at 1.0674. The wave v is sub-divided by minor wave (i): 0.9980, (ii): 1.0374, (iii): 0.9446, (iv): 0.9913 and (v) as well as v has possibly ended at 0.9407, therefore, consolidation with upside bias is seen for major correction, indicated target at 1.3700 and 1.4000 had been met and further gain to 1.4700 would be seen later.