

Sample Category Title
Technical Outlook: AUDUSD – Short-Lived Probe Above 0.8000 After RBA Suggests Further Consolidation
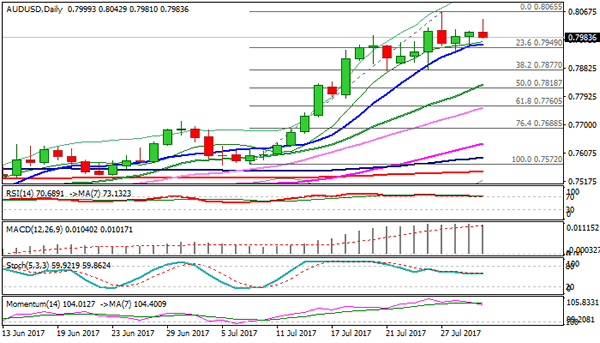
The pair eases from fresh session high at 0.8042, posted on rally after RBA, confirming 0.8000 zone (reinforced by falling weekly 200SMA) as very strong resistance, after several attempts above it failed.
RBA is not seen as strong market driver, with focus remaining on the US dollar performance which boosted the Aussie in recent weakness.
This suggests that the pair may spend more time in consolidation and even dip lower, on negative signal from daily RSI reversal from overbought territory.
Initial supports lay at 0.7970/61 (daily Tenkan-sen which turned sideways and 10SMA), break of which would expose key near-term support at 0.7877 (higher base / Fibo 38.2% of 0.7572/0.8065 upleg).
Sustained break here is needed to signal reversal.
Likely scenario is for extended sideways mode ahead of Friday's key releases, RBA Monetary Policy Statement and US NFP data which are eyed for stronger direction signals.
Firm break above 0.8000 barrier would spark fresh extension of current wave C of five-wave cycle from 0.7535 towards its FE300% at 0.8114.
Res: 0.8000, 0.8042, 0.8065, 0.8114
Sup: 0.7961, 0.7936, 0.7900, 0.7877
Technical Outlook: USDJPY – Scope For Final Break Below 110.00 Support After Light Bounce
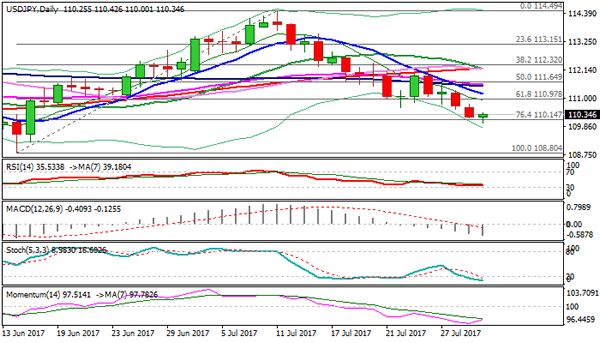
The pair cracked psychological 110.00 support on extension of broader weakness on Tuesday, but without clear break lower so far.
Hesitation at strong 110.00 support zone may trigger a bounce as daily studies are oversold. Supporting the notion is daily cloud twist later this week which may attract for extended upticks.
The price is still below initial barrier at 110.51 (Fibo 23.6% of 112.19/110.00 downleg) with extended upticks to likely stall towards 110.83/111.10 zone (Fibo 38.2% / 50% retracement), before bears retake control.
Close below 110.14 (Fibo 76.4% of 108.80/114.49 rally) is needed for bearish signal with firm break below 110.00 handle to spark fresh downside and expose targets at 109.26 (15 June low) and 109.11 (07 June low) which guard key support at 108.80 (14 June low).
Alternative scenario requires firm break above 111.35 (Fibo 61.8%) to shift near-term focus higher.
Res: 110.51, 110.83, 111.10, 111.35
Sup: 110.14, 110.00, 109.26, 109.1
Can US Earnings Sustain Indices At Record Highs
- Strong earnings continue to fill Trump void;
- Inflation, income and spending data could weigh on rate hike expectations;
- Another large inventory draw could drive oil prices higher once again.
US futures are pointing to a higher open on Tuesday as traders await another batch of earnings reports and some important economic releases from the world's largest economy.
It's been a very good earnings season so far which is helping to sustain US stocks at record highs and offset any disappointment with Donald Trump's inability to make progress on his growth policies. After a slow start to the week, the number of companies reporting will pick up again from today, with Apple unsurprisingly the one that stands out, reporting after the closing bell. While earnings season will continue to be a key driver of sentiment in the markets, there's a lot of economic data being released today, much of which will be of keen interest to the Federal Reserve and therefore traders. The most notable of these will be the core PCE price index – the Fed's preferred measure of inflation – which is expected to weaken for a fourth consecutive month and cast further doubt on whether the Fed should still be considering another rate hike this year.
Alongside this we'll get personal income and spending figures, which are important metrics from both an economic health perspective and inflation. While earnings appear to have been growing gradually, spending has been slowing this year which isn't entirely conducive with higher price pressures. This has long been a concern of the Fed's and should it not improve in the coming months, it could help pursued them to slow the pace of tightening. We'll also get two manufacturing PMIs after the open on Tuesday to complete what is likely to be a very busy session.
Oil is currently trading flat on the day having rallied over the last week, breaking through $50 in the process, as we await more inventory data from API. Last week's numbers pointed to a sharp reduction in inventories, which came as Saudi Arabia cut exports to the US in an apparent attempt to draw on the very numbers that are having such a significant impact on prices. Another large drawdown today could boost prices further, with $55 offering the next test in Brent and $52 in WTI.
Precious Metals Get Their Thrill, From Capitol Hill
Gold leads precious metals higher as viewers can't stop watching The House Of Trump on Capitol Hill, and selling dollars.
I can't help but feel a little sorry for Netflix. I was an avid follower of the House of Cards series, but this year I just sort of lost interest. Indeed, the planners at Netflix themselves must be scratching their heads wondering how they got it so wrong. As a member of the FANG club of tech stocks they must be worried about becoming defanged as real life in Washington D.C. seems to become more surreal than the TV series. Perhaps that's why I have drifted away as well.
There is no doubt though that the market has started letting their feet do the talking with a mass exodus towards the U.S. dollar exit door. To be fair to President Trump, this is not entirely of his making, and perhaps a Marine Corps General is the man to bring order to the chaos. Capitol Hill must take a fair share of the blame as well. With Republican control of all both houses, they seemed to have achieved an inability to share the toys in any matter at all.
The net result has been a mass unwind of the Trumpflation premium from post election halcyon days. To give further balance, the Federal Reserve has played a part as well. They appear to be in the process of “blinking” rather poorly on the rate hike front which is also undermining the dollar as an increasing procession of central bankers globally start playing the hawkish tune.
More interestingly, in a world with some seriously intensifying geopolitical tensions, the safe haven of all safe havens, the U.S. dollar, appears to have missed the boat. As a spotty youth some 30 years ago, one of the first lessons my grizzled chief dealer drummed into me was “always buy dollars on a war, or even a hint of one.” This experience seems to have been consigned to the history bin, and today it appears the Cryptocurrencies and precious metals have taken up the mantle with both product sets racing higher in the last couple of months.
Cryptocurrencies I will leave alone, maybe I'm showing my age, but I do like the feeling of holding a gold bar in my hand in an emergency as a store of value. I would always be worried some pasty hacker sitting in a room in Eastern Europe surrounded by pizza boxes could steal my former.
This all brings us to precious metals and how precious they have been. All four forming bullish technical pictures to some degree.
Gold
Gold consolidated in a six dollar range overnight but remains at near two-month highs along with Silver and Platinum. The unvirtuous circle of turmoil and disappointment with Washington D.C. feeding into a weaker U.S. dollar continues to help precious metals to shine. To this, we can add U.S./Russia relations, North Korea, Venezuela and the revolving door at the White House to the mix, all of which will also be supportive of gold as a safe haven.
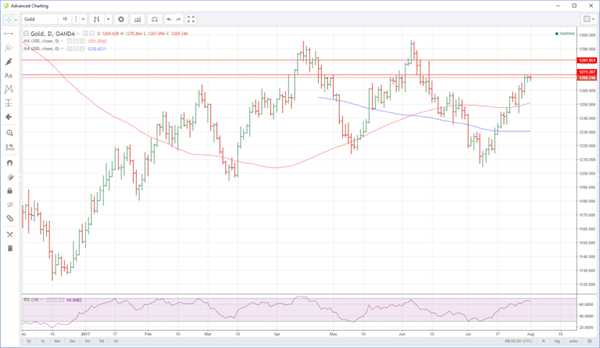
In the short-term gold has formed a double top on the daily charts at 1271.00, the Friday and Monday high. It seems to be posing a technical barrier to gold having topped there again in the Asian session. A daily close above this level though could open the path for a march upon the May highs at 1281.50.
Initial support resides at 1265.50, but the key support for gold remains the 100-day moving average, today lying at 1251.00. From a technical perspective, only a daily close below here would call into doubt the bullish chart picture.
Silver
Silver has consistently moved higher with gold but perhaps not with quite the same venom. I suspect that liquidity has played its part here with traders preferring the much more liquid gold markets. Traders will know that the entry and exit doors are much smaller on Silver especially when the herd stampedes towards them.
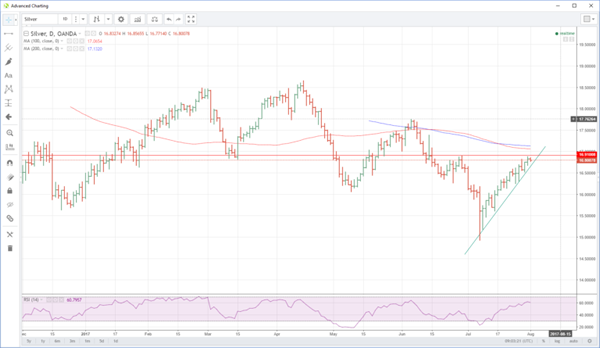
Nevertheless, as the chart below shows, Silver has consistently moved higher and held its medium term support line on any and all pullbacks through July. This level sits at 16.6550 today with 16.5000 the next support behind.
Silver has some interim resistance at 16.9100, some 10 cents away from its present 16.81000 level. It is, however, within shouting distance of a rather formidable technical resistance zone between 17.0650 and 17.1300 where the 100 and 200-day moving averages reside. A daily close above this zone would could suggest a test of the June highs at 17.5650 could be on the cards.
Platinum
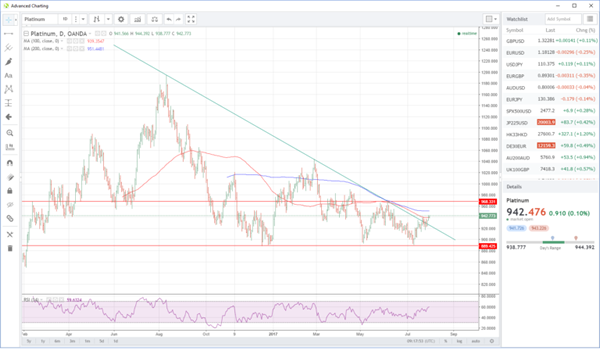
Platinum's price action is less stellar, and I am at a loss, in all honesty, to explain why. It could be that traders have had their fingers burnt here previously following Platinum's aggressive fall from grace in H2 2016. Dropping from 1195 to 889.50. It has however held long term support at 889.40 on its corrective drop in early July and has muddled its way higher since.
In the process, it has broken the longer term triangle to the upside although it has made heavy work of it. The descending trend line is now at 927.00 and forms the first major support for Platinum.
It has also broken through its 100-day moving average at 939.35 in a positive technical sign. The next major resistance is the 200-day moving average at 951.45 followed by the 968.00 regions.
Time will tell if this move signals a longer term trend or after the dust settles we are still in a longer term 889.00 to 1040.00 range.
Summary
Precious metals, in general, have rallied well as the market has deserted the U.S. dollar in droves. None of them is overbought on their daily RSI's either, suggesting the up moves may not have run out of steam yet. The bullishness of the price action is variable, however, with gold the clear winner with silver a distant second and platinum being lapped. The trend is your friend as they say, and it may well be that traders prefer to follow it in the much more liquid gold market.
Dollar Impacted Again As Trump’s Self-Inflicted Wounds Continue
Market Overview
The dollar remains under pressure amid increased political risk as Donald Trump's administration goes from bad to worse. Like The Simpson's Sideshow Bob wandering around a room of upturned garden rakes, there seems to be one self-inflicted wound after another as communications director Anthony Scaramucci has been fired after just ten days in the job. At some stage there will be a tipping point for the markets, at which the nadir in Trump's chaotic Presidency will be reached. But it does not seem as though that point has been reached quite yet. However whilst there is still some dollar weakness ahead potentially, the Dollar Index is now into a key band of support between 92/93. Will this prove to be an area of viable support? There is arguably open upside on EUR/USD towards $1.2000, whilst Dollar/Yen still has some way to go until its June lows at 108.80. Gold has upside within its range towards $1296, so perhaps there is still some further weakness on the dollar. There needs to be some turnaround in the US data to help counter the political risk. Today we have the ISM Manufacturing and the Fed's preferred inflation, the core PCE. Recent data releases have only gone to weaken the dollar further. With the drop in the Employment Cost Index and inflationary trends remaining weak, don't expect any positive surprises today.
Wall Street closed mixed again, with the Dow once more into all-time high ground, whilst the S&P 500 fell -0.1% to 2470. Asian markets were mildly positive overnight with the Nikkei +0.3% whilst European markets are also looking reasonably positive at the open. FTSE 100 outperformed yesterday on HSBC and could again be a leader today with BP beating estimates. In forex, there is a mixed outlook on the dollar, pulling the euro back slightly, whilst the yen continues to perform well. The Reserve Bank of Australia held rates steady at +1.5%, with a warning of the strength of the Aussie holding back inflation and growth. The Aussie is all but flat today. In commodities, gold is mixed, whilst oil continues to push higher, showing mild gains..
The big focus for today will be the Manufacturing PMIs throughout the day but there is also key US inflation to keep an eye on too. The Manufacturing PMIs for Eurozone countries are during the early European session culminating with the Eurozone Manufacturing PMI at 0900BST which is expected to stay at the flash reading of 56.8 (last month 57.4). UK Manufacturing PMI is at 0930BST and is expected to pick up very slightly to 54.4 (from 54.3) after last month's disappointing decline. Eurozone Q2 GDP is also released at 1000BST and is expected to be +0.6% which is the same as Q1's upwardly revised +0.6%, and would confirm the Eurozone running at double to growth of the UK. The Federal Reserve's preferred inflation measure, the core Personal Consumption Expenditure is at 1330BST which is expected to be +0.1% for the month which would be the same as last month's +1.4% for the YoY data. US ISM Manufacturing PMI is at 1500BST and is expected to drop back to 56.5 from last month's strong 57.8.
Chart of the Day – USD/CAD
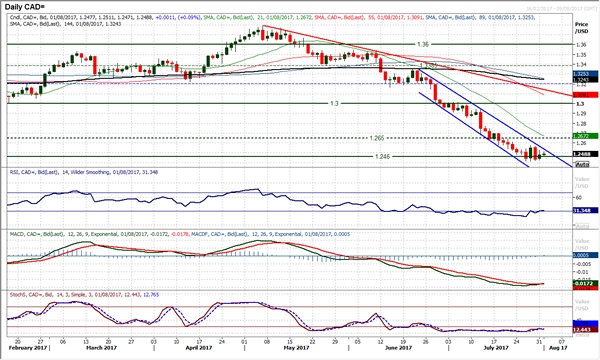
Is a change in trend starting to develop? The market has been in a sharp downtrend channel over the past six weeks in a move that has taken the market from over 1.3200 to consistently pressurising the massive May 2016 low at 1.2458. However, it is interesting to see that in the past few sessions, the volatility has increased with the magnitude of the candles also greater. The old key support around 1.2460 may have been breached but the market is looking to build a low at 1.2412, with each of the past four sessions holding this as a support. The momentum indicators are beginning to tick higher, with the RSI back above 30 (arguably a basic buy signal) and the MACD lines threatening to turn higher. “The trend is your friend until it ends” and calling an early end to a trend can be painful. However the downtrend channel comes in today at 1.2540 and a move above 1.2575 would complete a small base pattern (to imply 160 pips higher). The hourly chart reflects the market turning into a consolidation play and this could begin to impact on the downtrend channel. It will be interesting to see if the downtrend is put under pressure by this consolidation. This could be one to watch in the coming days.
EUR/USD
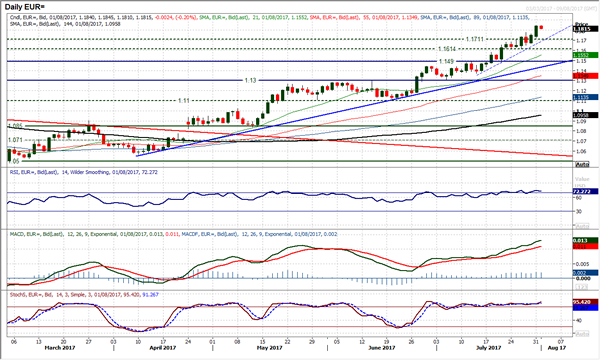
Another day of weakness on the dollar has sent EUR/USD ever sharply higher. Once more old resistance is seen as being supportive within the uptrend and the latest key breakout at $1.1711 has been used as the springboard for yesterday's bull candle. The momentum indicators are strongly bullish and there is little to suggest that this run higher will be stopping. There is a tighter uptrend that has now formed in the past three weeks that comes in today at $1.1690, however even intraday corrections are seen as a chance to buy. At some stage it is perfectly possible that a profit-taking correction will take hold, but for now stick with the bull run. There is little real resistance until over $1.2000. The hourly chart shows positive configuration and any dips this morning are a chance to buy. Initial support $1.1725/$1.1775, with $1.1611 now key.
GBP/USD
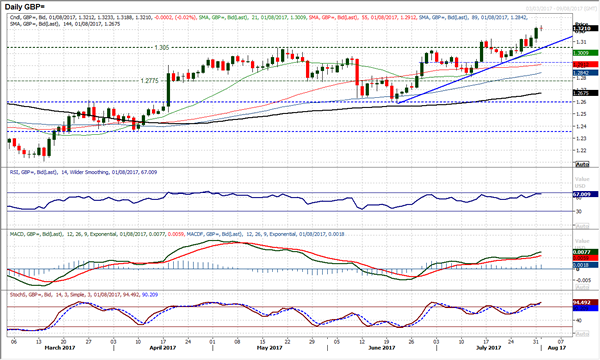
With a second consecutive strong bull candle the market has now pulled away and deep into the next phase of a trading band broadly between $1.2800/$1.3500 that came from June/September 2016. The market also continues to bolster the six week uptrend which is now supportive at $1.3045. Momentum indicators remain strongly configured with the RSI rising in the high 60s, MACD lines accelerating higher in positive territory and the Stochastics strong. Corrections remain a chance to buy with the band of support now up to $1.3050/$1.3125. The hourly chart shows the market looking strongly configured and any intraday weakness towards $1.3160/$1.3175 is a chance to buy. The daily chart shows little real resistance of any significance until the $1.3445/$1.3480 highs of Q3 2016 but there is a minor resistance at $1.3345.
USD/JPY
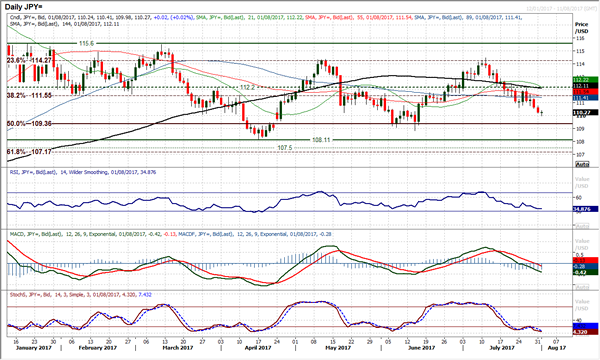
Another solidly negative candlestick has confirmed the breach of the previous support at 110.60, with the market now well on the way towards a test of the 50% Fib leel at 109.35 and the June low at 108.80. Momentum indicators are increasingly negative with the RSI now down to the mid-30s (but with further downside potential) and the MACD lines falling below neutral. A feature of this run lower over the last few weeks has been that strong candles have often been followed by long legged dojis (or at least very small bodies) as intraday rallies have consistently been sold into. After two solid negative sessions, the potential is for another rebound, but that would again be a chance to sell. The intraday chart shows a downtrend of the past four sessions an if this is broken to the upside then a rally could set in. There is overhead resistance piling up between 110.60/110.80 initially and then all the way to 111.30 and 111.70. Do not expect a rally to get far before the sellers return.
Gold
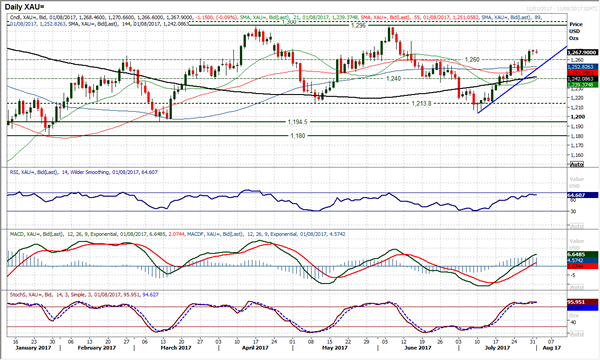
Despite the dollar weakness that flooded through forex markets yesterday, there was a degree of consolidation on gold yesterday. The bulls just seem to have taken a brief pause for breath and look ready to once more resume the rally higher. The breakout above $1260 has re-opened the highs once more at $1296. With the strength of the momentum indicators there is consistent buying into weakness now. The old pivot at $1260 now becomes supportive for near term corrections, whilst the uptrend comes in today at $1250. This means that any support between $1250/$1260 looks like a good chance to buy now. There is minor resistance at $1279.40. The hourly chart shows that yet another breakout old resistance is becoming supportive, with $1265 building in the past day.
WTI Oil
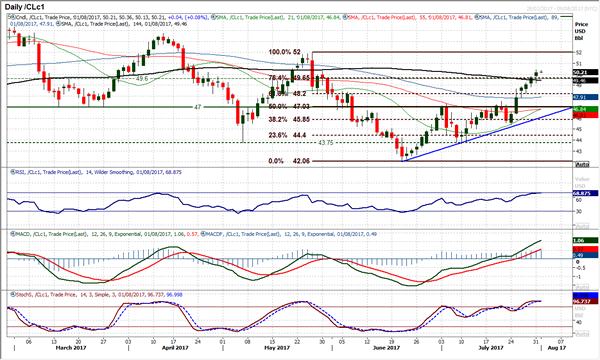
The bulls are not giving up quite yet. Although it had looked early in the session that the steam was coming out of the rally, there is still an appetite to buy into weakness, even on an intraday level. Momentum indicators remain strong and as yet there is still no real profit-taking signal, with corrections remaining a chance to buy. The sequence of higher daily lows means that there is now $49.20 to add to previous session lows at $48.85 and $48.25. Momentum indicators remains strongly configured with the RSI pushing towards 70 and MACD lines accelerating higher. The $50 psychological barrier has been broken and there is little real resistance until the $52 May high. The hourly chart shows that any unwinding of bull momentum is consistently being bought into.
Dow Jones Industrial Average
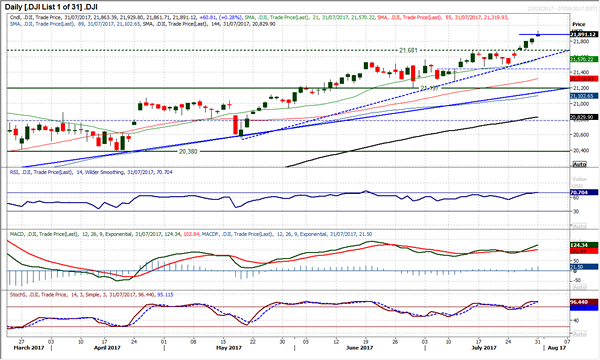
It has taken less than a handful of sessions for the Dow to hit the implied 210 tick breakout target (it was after all just about a percent higher). The bulls still remain in control as the market pushes ever higher. The momentum indicators remain strong but there is a sense that the market having hit the near term breakout target and the RSI now over 70, there could become to be a limit to the immediate further upside. The last time the RSI started to turn lower from above 70, the market corrected back by over 300 ticks from 21,529 to 21,197 in mid-June. Therefore, watch for the RSI beginning to roll over back below 70. There is a gap at 21,841 that needs to be at least filled and if this gap is closed, this could also be an initial profit taking signal. The hourly chart looks strong with key initial support at the latest breakout of 21,681.
GBP/USD Elliott Wave Analysis
GBP/USD – 1.3235
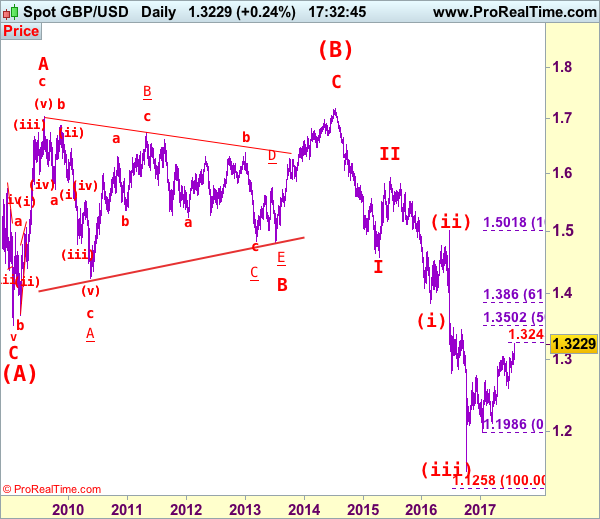
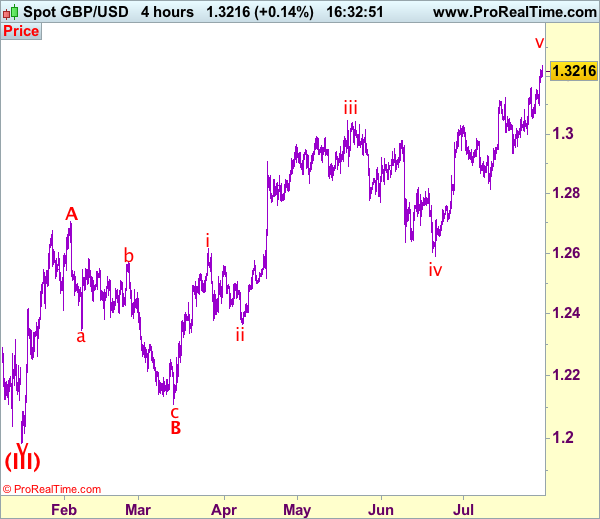
GBP/USD – Wave 4 is unfolding as an (A)-(B)-(C) and could have ended at 1.7192
Cable has surged in part due to dollar’s broad-based weakness and the breach of 1.3126 resistance signals recent erratic upmove from 1.1986 low is still in progress and may extend further gain to 1.3300-10 and possibly 1.3140-50 (38.2% Fibonacci retracement of 1.5018-1.1986), however, near term overbought condition should limit upside to 1.3200-10 and price should falter below 1.3300-10, risk from there is seen for a retreat later.
Our preferred count on the daily chart is that cable's rebound from 1.3500 (wave (A) trough) is unfolding as a wave (B) with A ended at 1.7043, followed by triangle wave B and wave C as well as wave (B) has possibly ended at 1.7192, below support at 1.4232 would add credence to this count, then further fall to 1.4000 level would follow but reckon downside would be limited to 1.3655 support and price should stay above previous support at 1.3500.
On the downside, whilst initial pullback to 1.3170 and possibly 1.3120-30 cannot be ruled out, reckon 1.3095-00 would limit downside and bring another rise later. Only below 1.3050-55 would abort and signal top is possibly formed, bring test of 1.2999 support, break of this level would add credence to this view, bring retracement of recent rise to 1.2950-55 and possibly test of key support at 1.2933.
Recommendation: Stand aside for this week.
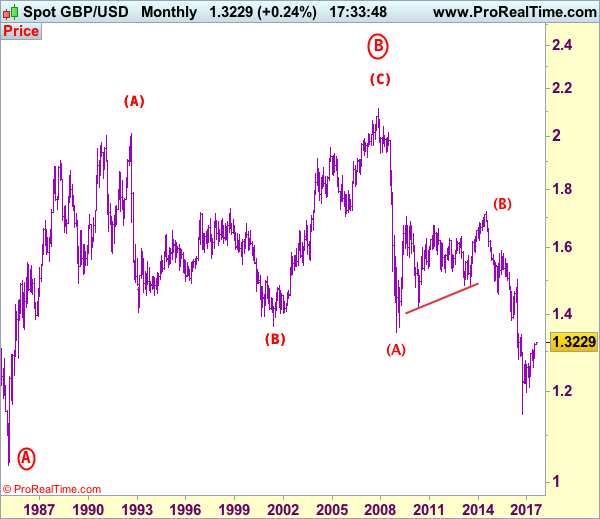
Longer term - Cable's rise from 1.0520 (Feb 1985) to 2.0100 (September 1992) is seen as [A], the decline to 1.3682 is labeled as (B) and (C) wave rally has ended at 2.1162 (9 Nov, 2007) which is also the top of larger degree wave B with circle. The selloff from there is a 5-waver with wave (A) ended at 1.3500 (23 Jan 2009), wave (B) itself is labeled as A: 1.6733, triangle wave B: 1.4813 and wave C as well as top of wave (B) ended at 1.7192 (2014), hence the selloff from there is an impulsive wave (C) with wave I : 1.4566, wave II 1.5930, an extended wave III is unfolding and already exceeded our downside target at 1.3500 and 1.3000, hence weakness to 1.2500 and possibly 1.2000 cannot be ruled out, however, price should stay well above psychological level at 1.0000.
Technical Outlook: GBPUSD Heads Higher, Boosted By Upbeat UK Mfg PMI
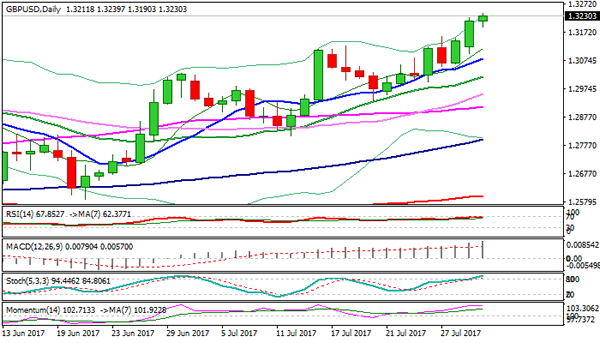
Cable is holding firm above broken 1.3200 barrier which now acts as initial support and marks European session low.
Bullish acceleration in past two days confirms strong bullish stance for extension of larger bull-phase from 1.2000 zone and bull-leg from 1.2588 trough towards its Fibo 161.8% projection at 1.3330 and key barrier at 1.3473 weekly cloud top) in extension).
Near-term price action probes above session high at 1.3235 after better than expected UK Manufacturing PMI data inflated the pair, signaling further advance.
Initial support lies at 1.3200/ 1.3190 zone, below which next supports levels are 1.3158 (27 July former high) and 1.3100 (Monday’s low).
Res: 1.3200' 1.3250' 1.3300' 1.3330
Sup: 1.3200' 1.3858' 1.3125' 1.3100
GBP/JPY Elliott Wave Analysis
GBP/JPY – 146.05
GBP/JPY – Wave 5 as well as wave (III) has possibly ended at 116.85
As stealing met resistance at 146.55 and has retreated, retaining our bearishness (we recommended to sell sterling at 146.50 and a short position was entered) and as long as said resistance holds, mild downside bias remains for another retreat to 144.85, then towards support at 144.05, however, break of latter level is needed to add credence to our view that top has been formed at 147.75 last month, bring further fall to 143.25-30, break there would signal the rebound from 138.70 has ended and bring at least a retracement of this rise to 142.50 (previous resistance), then 142.00 but price should stay well above 140.00, bring rebound later.
Our preferred count is that larger degree wave V with circle is unfolding from 251.12 with wave (I) 219.34, (II): 241.38 and wave (III) is subdivided into 1: 192.60, 2: 215.89 (23 Jul 2008) and wave 3 ended at 118.87 earlier in 2009. The correction from there to 162.60 is wave 4 which itself is a double three and is labeled as first a-b-c ended at 151.53, followed by wave x at 139.03, 2nd a ended at 162.60, 2nd b at 146.75 and 2nd c leg of wave 4 ended at 163.00. Therefore, the decline from 163.00 to 116.85 is now treated as wave 5 which also marked the end of larger degree wave (III), hence wave (IV) major correction has commenced for retracement of the wave (III) from 241.38 and upside target at 183.95-00 (50% Fibonacci retracement of the wave (II) from 241.38) had been met, a drop below 160.00 would suggest wave (IV) has ended at 195.85, bring decline in wave (V) for initial weakness to 130 (already met) and 120.
On the upside, above said resistance at 146.55 would abort and suggest the retreat from 147.75 has ended instead, bring a stronger rebound to 147.00. Only break of said resistance at 147.75 would revive bullishness and bring test of previous chart resistance at 148.10, break there would signal early rise from 135.60 (this year’s low) has resumed for gain to 148.45 (another previous resistance) and later 149.00-10 but price should falter below psychological level at 150.00, bring retreat late.
Recommendation: Hold short entered at 146.50 for 144.50 with stop above 146.60.

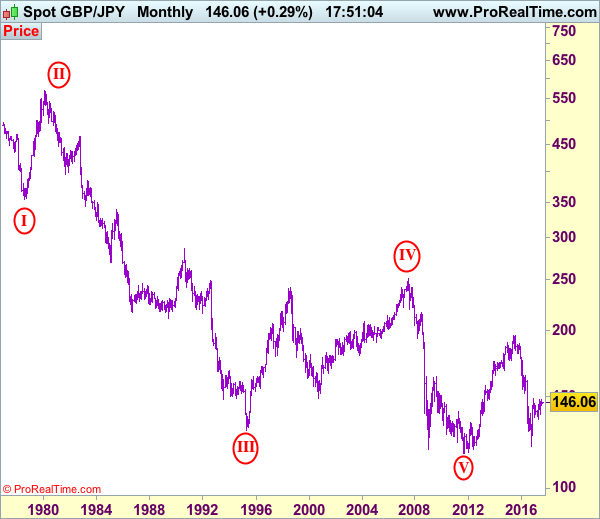
The long-term downtrend from 570.99 (29 Feb 1980) is labeled as an impulsive wave with III with circle ended at 129.77 (20 Apr 1995) and the corrective rebound to 251.12 (20 Jul 2007) is treated as wave IV with circle and the wave V with circle selloff from 251.12 has possibly ended at 116.80 (almost reached our indicated target at 116.00) and major correction has commenced from there and indicated upside target at 183.90-00 (50% Fibonacci retracement of 251.10-116.85) had been met, reckon upside would be limited to 199.80-90 (61.8% Fibonacci retracement) and bring wave (V) decline in later part of 2017.
Trade Idea: GBP/USD – Buy at 1.3070
GBP/USD – 1.3230
Recent wave: Wave V of larger degree wave (III) has ended at 1.1986 and major correction has commenced from there for gain to 1.3000 and 1.3140-50
Trend: Near term up
Original strategy :
Buy at 1.3070, Target: 1.3250, Stop: 1.3010
Position: -
Target: -
Stop: -
New strategy :
Buy at 1.3130, Target: 1.3330, Stop: 1.3070
Position: -
Target: -
Stop:-
As sterling has surged again after finding renewed buying interest at 1.3097 yesterday and broke above previous resistance at 1.3126, adding credence to our bullishness for recent upmove to extend further gain to 1.3250, then towards 1.3300, having said that, as this move is still viewed as the final wave v of larger degree wave C, reckon upside would be limited to 1.3340-50 and price should falter below 1.3390-00, then sterling shall retreat sharply from there.
Our preferred count on the daily chart is that cable's rebound from 1.3500 (wave (A) trough) is unfolding as a wave (B) with A ended at 1.7043, followed by triangle wave B and wave C as well as wave (B) has ended at 1.7192, the subsequent selloff is the larger degree wave (C) which is still unfolding with minor wave (III) of larger degree wave 3 ended at 1.1986, hence wave (IV) correction is in progress which could either be a triangle wave (IV) of a complex formation but upside should be limited to 1.3500 and price should falter well below 1.4000, bring another decline in wave (V) of 3 for weakness to 1.1500, then 1.1200.
On the downside, whilst pullback to 1.3170-80 cannot be ruled out, reckon 1.3120-30 would hold and bring another rise. Only below said support at 1.3097 would abort and signal top is formed instead, bring retracement of recent rise to 1.3052 support but break there is needed to add credence to this view, bring correction to 1.3000, then 1.2980.
Phillip Lowe Fails To Pull Back The Aussie
As widely anticipated, the Reserve Bank of Australia kept its cash rate unchanged at 1.5%. Traders who wereanticipating a dovish statement were disappointed, despite the central bank saying that a rise in the Aussie would slow the economy. It is no surprise that RBA Governor, Philip Lowe is not excited about the appreciating exchange rate. He stated that the recent currency strength is weighing on the outlook for economic growth and employment, which will result in slower momentum in economic activity and inflation.
The AUDUSD has appreciated by more than 4% in July alone. However, this was mainly due to the weaker U.S. dollar and a spike in commodity prices. The economy which relies on commodity exports, has seen iron ore prices jumping to 4-month highs, after activity in China’s construction sector surged to a new high in more than three years. Similarly, copper prices gained more than 6% to trade at a new 2-year high.
The AUD above 0.8 looks expensive, but without action from the central bank, yield differentials will continue to be the primary driver for the currency pair. The spread between the U.S. and Australian 10-year bond yields has historically served as a key indicator for the Aussie dollar;if the spread continues to widen, I still see further appreciation in AUDUSD.
The Euro also made headlines yesterday, after the single currency traded above 1.18 against the USD, reaching its highest levels in 2.5 years. The EURUSD is up by more than 12% from April lows, and we haven’t seen any meaningful correction since then, thanks topositive European economic data, a hawkish ECB, and the ongoing drama at the Oval Office. As we get closer to the 1.20 benchmark, short positions are likely to come in. The sharp appreciation of the Euro is not only causing problems for European exporters, but soon this will be reflected in prices, thus delaying ECB’s plan to normalize monetary policy. I believe that EURUSD is due to a correction, but this requires strong data from the U.S. to convince traders that the Fed will hike rates again in December -this iswhy Friday’s U.S. labor report will be crucial for traders.
It is a busy economic calendar in the Eurozone - manufacturing PMI’s are due today and most European countries are expected to show continued expansion in activity, but no big surprises. The preliminary Eurozone Q2 GDP is expected to show 0.6% growth on a quarterly basis and 2.1% annualized. It would take a significant event to send the Euro higher from current levels