Sample Category Title
Personal Income Gains Held Back by a Decline in Capital Income
Personal income was essentially flat in June, as decreases in personal dividend and interest income partially offset a 0.4% monthly gain in wages and salaries. Removing taxes and price changes, real disposable personal income fell 0.1% on the month.
There were fewer surprises on the spending side, with personal spending rising 0.1%. In real terms, personal spending was flat, after a sizeable 0.7% monthly gain in May.
Consumer prices were essentially flat in June, bringing the year-on-year inflation rate to just 1.4% (from 1.5% in May). Core prices (excluding food & energy) rose 0.1% month-on-month – leaving year-on-year core PCE inflation at 1.5%, unchanged from May.
No growth in income combined with spending gains, led the savings rate to tick down to 3.8% from 3.9% in May. If that sounds lower than you may remember it, it is. Today's data reflects annual updates to the national accounts, which resulted in the savings rate in Q1 being revised down from 5.2% to 3.9%. That reflected downward revisions to personal income in the recent history, while personal spending was revised up. On net, it means that the savings rate declined more rapidly through 2016 than previously reported, as consumers increasingly spent their windfall gains from lower energy prices. And, that the recent trend level of the savings rate is now at levels not seen since prior to the recession.
Key Implications
The softness in June consumer spending was not unexpected, with Q2 data already released with last week's GDP report. June's softness does provide a bit of a weak start to consumer spending in the third quarter. However, the lack of income growth would be more concerning were it not for the fact that growth in wages and salaries remained healthy.
With the recent softness in inflation front and center, more important are the nuances of June prices and what they say about inflation trends. The core PCE deflator – the Fed's preferred inflation gauge – did gain a bit of momentum in June as expected.
The Federal Reserve has signaled that it is monitoring inflation developments closely. As discussed in our latest Dollars and Sense, the relationship between growth and inflation has become more muted in recent years. Inflation is taking longer to respond to an acceleration in growth this time around. For now, we and the Fed maintain faith in our models that tell us inflation should pick up in the months ahead, and that the Fed can take interest rates higher. But, the pace of hikes the Fed currently has penciled in in its outlook are likely too aggressive given the soft starting point for inflation.
SPX500 Bullish Elliott Wave Sequence
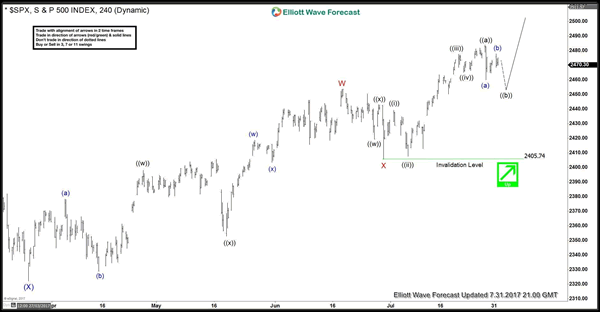
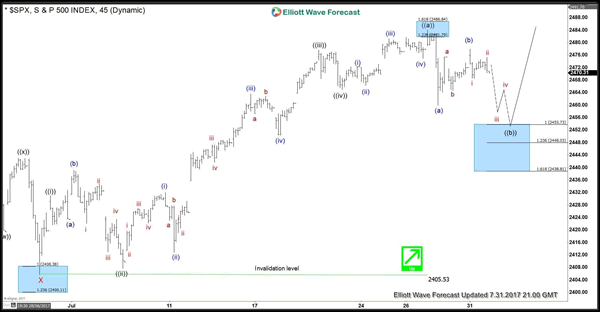
SPX500 move up from 3/27 (2322) low is proposed to be unfolding as a double three Elliott wave structure when rally to 6/19 (2453) completed wave W and dip to 6/29 (2405.74) completed wave X. Up from there, Index rallied in 5 waves to 7/27 (2484) which completed wave ((a)) of Y and now the Index is showing 5 swings up from 3/27 low. 5 swings is an incomplete sequence and calls for more upside to complete 7 swings sequence. Index is currently in wave ((b)) correcting the cycle from 2405.74 low. This pull back is expected to unfold as a zig-zag Elliott wave pattern and while below 7/31 (2477), SPX500 has scope to trade lower towards 2453.73 – 2438.81 area to complete wave ((b)). From this area, SPX500 should turn higher to resume the rally in wave ((c)) of Y towards 2537 – 2568 area or bounce in three waves at least. In case the bounce from the above mentioned area fails to make a new high, then Index could turn lower and do a 7 swings pull back in wave ((b)) before starting wave ((c)) higher. We don't like selling the Index and favor buying the dip towards 2453.73 – 2438.81 area looking for a target of 2537 area or a 3 waves bounce at least to get into a risk free position.
SPX500 4 Hour Elliott Wave Chart
SPX500 Potential buying area
NASDAQ Composite Index Should Pullback Soon
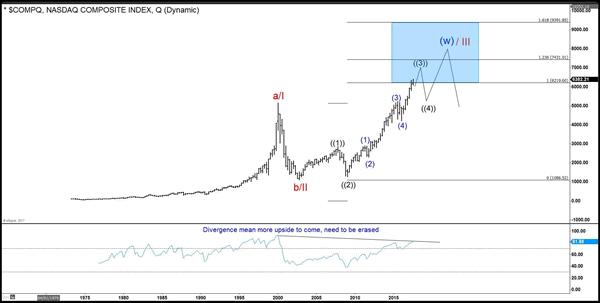
The following video/chart shows NASDAQ composite index. The index has a tremendous rally since the lows around 1975 which is pretty close to the zero level. The index has reached the bottom of the blue box at 6219 area. The question then is whether the index will extend higher or start correcting lower as the minimal target has been reached. As we often say, Elliott wave theory by itself is not enough. In this case, we can see that from the zero line, we can count the index as a completed ABC. However, we can also count it as an incomplete ABC with a black((4)) still to happen. In the Elliott wave theory, any five waves structure always at one moment is a three wave move. It is therefore too early at this stage to determine if the rally will develop into a five waves move.
In Elliottwave-forecast.com, we have implemented new ideas and tools to make the theory a more reliable tool. We use cycles, sequences, distributions and momentum indicators to increase the accuracy of Elliott wave theory. As we explain in this video, the RSI (Relative Strength Index) indicator is still showing a divergence compared to the peak in 1999. One of the rules that we introduced in the new Eliott wave theory is that a three waves move can not have divergence in any single time frame. Looking at Nasdaq quarterly chart, we can observe the divergence between momentum and price action. Thus, the index still has scope to extend into the areas of 7431 minimal or even reach the 9391 area before the 2009 rally is complete.
The five waves move in blue degree is now about to end. But we feel very comfortable to say that the pullback will be another buying opportunity. It is very easy to trade following our forecast. We always prioritize the trend and we use a distribution system and a series of pivots and cycles to prioritize the trend. In conclusion, even though the index has reached the minimal target, a multi market correlation and simple indicator like the RSI are calling for a pullback soon into a wave four but more upside to follow afterwards.
If you enjoy this video, we invite you to take the 14 days free trial where you can learn all these new techniques and receive an honest Elliott wave forecast. We listen to the market and don't force five waves. We analyze the market structures, sequences, and provide the best possible and more aggressive forecast with the trend.
Long Term Nasdaq Elliott Wave Path
WTI Oil Eases Below $50 Handle
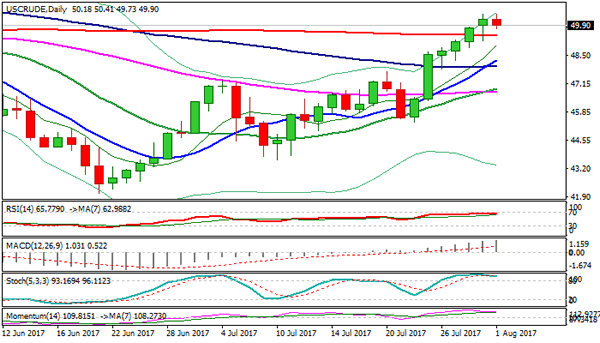
WTI Oil eases below $50 handle after hitting fresh highs of over two months at $50.39/41 on Monday /today, failing to emerge above weekly cloud top on repeated attempt.
Oil price's recent advance was supported by rising global demand and continuous drawdown in oil stocks, but rise in OPEC production in July, despite a deal among oil producers to cut output, marks strong headwind for oil prices.
Corrective easing was signaled by reversal of slow stochastic deeply in the overbought territory and turning near-term focus towards initial supports at $49.41/17 (broken 200SMA / Monday's low), with deeper pullback on break of the latter supports not ruled out.
Extended dips would target next pivot at $48.48 (Fibo 38.2% of $45.39/$50.39) and $47.90 (daily Tenkan-sen) which is expected to contain.
Release of US API and EIA crude inventories reports is in focus as both inventory reports are expected to show further draw in oil stocks which would further boost oil prices.
Res: 50.42; 50.90; 51.98; 52.14
Sup: 49.73; 49.41; 49.17; 48.48
Trade Idea Update: USD/CHF – Buy at 0.9600
USD/CHF - 0.9648
Original strategy :
Buy at 0.9600, Target: 0.9700, Stop: 0.9565
Position : -
Target : -
Stop : -
New strategy :
Buy at 0.9600, Target: 0.9700, Stop: 0.9565
Position : -
Target : -
Stop : -
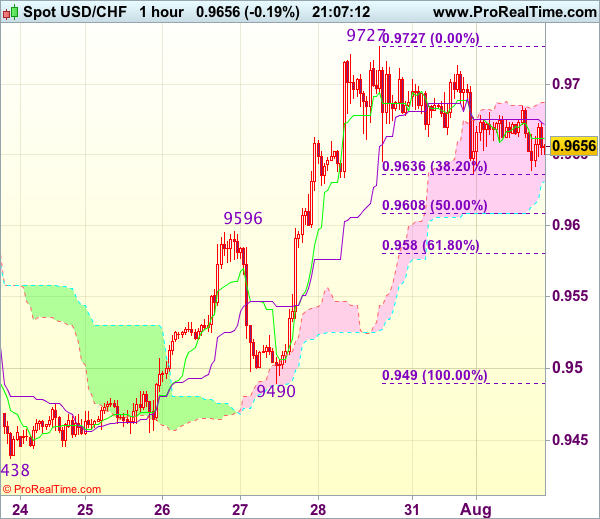
Although the greenback has recovered after finding support at 0.9637 yesterday, reckon resistance at 0.9727 would limit upside and bring further consolidation below this level, hence risk of another retreat to 0.9635 (38.2% Fibonacci retracement of 0.9490-0.9727) remains, however, previous resistance at 0.9596 should turn into support and contain downside, bring another rise later, above said resistance at 0.9727 would extend recent rise to 0.9750-60, then 0.9780 but reckon 0.9800 would hold from here.
In view of this, would not chase this rise here and would be prudent to buy dollar on subsequent pullback as previous resistance at 0.9596 should turn into support and contain dollar’s downside. Below 0.9580 (61.8% Fibonacci retracement of 0.9490-0.9727) would defer and suggest a temporary top is formed instead, bring correction to 0.9540-50 but price should stay well above support at 0.9490, bring another rise later.
Trade Idea Update: GBP/USD – Buy at 1.3130
GBP/USD - 1.3224
Original strategy :
Buy at 1.3130, Target: 1.3230, Stop: 1.3095
Position : -
Target : -
Stop : -
New strategy :
Buy at 1.3130, Target: 1.3230, Stop: 1.3095
Position : -
Target : -
Stop : -
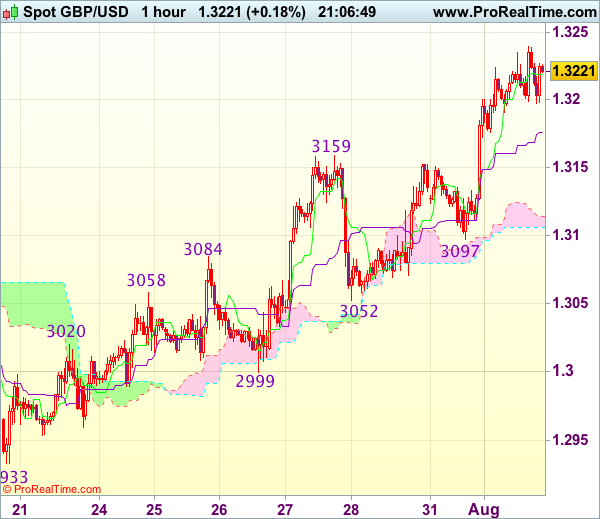
Yesterday’s rally above previous resistance at 1.3159 confirms recent upmove has resumed and upside bias is seen for further gain to 1.3240-50, however, near term overbought condition should prevent sharp move beyond 1.3275-80 and reckon 1.3300-10 would hold from here, risk from there has increased for a retreat to take place later.
In view of this, would not chase this rise here and would be prudent to buy cable on pullback as the upper Kumo (now at 1.3123) should limit downside, bring another upmove later. Below 1.3105-10 would defer and risk test of support at 1.3097 but only break there would signal a temporary top is possibly formed, bring further fall towards previous support at 1.3052.
Trade Idea Update: EUR/USD – Buy at 1.1750
EUR/USD - 1.1810
Original strategy :
Buy at 1.1750, Target: 1.1850, Stop: 1.1715
Position : -
Target : -
Stop : -
New strategy :
Buy at 1.1750, Target: 1.1850, Stop: 1.1715
Position : -
Target : -
Stop : -
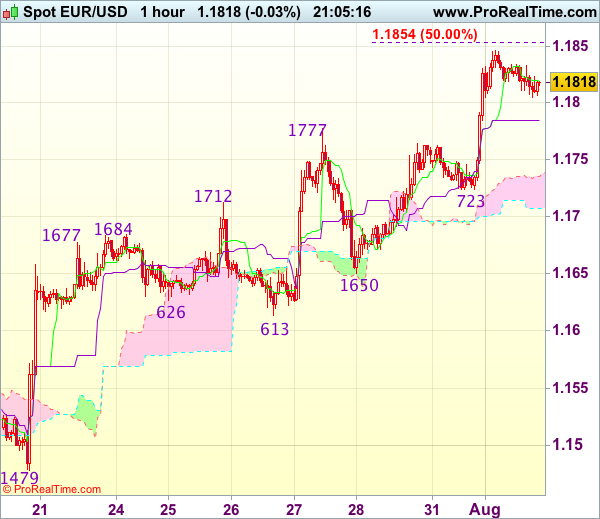
As the single currency has maintained a firm undertone after yesterday’s rally above last week’s high at 1.1777, adding credence to our bullish view that recent upmove from 1.0340 low is still in progress and upside bias remains for further gain to 1.1850-55 (50% projection of 1.1370-1.1777 measuring from 1.1650) but loss of near term upward momentum should prevent sharp move beyond 1.1875-80 and price should falter below 1.1900-05 (61.8% projection), risk from there has increased for a retreat later.
In view of this, would not chase this rise here and would be prudent to buy euro on pullback as 1.1750 should limit downside. Below said support at 1.1723 would defer and suggest top is possibly formed, bring retracement of recent rise to 1.1690-95 first but indicated support at 1.1650 should hold.
Aussie Dollar Poised To Extend Gains Vs US Dollar
Key Highlights
- The Aussie Dollar is in an uptrend and positioned nicely above the 0.7950 support against the US Dollar.
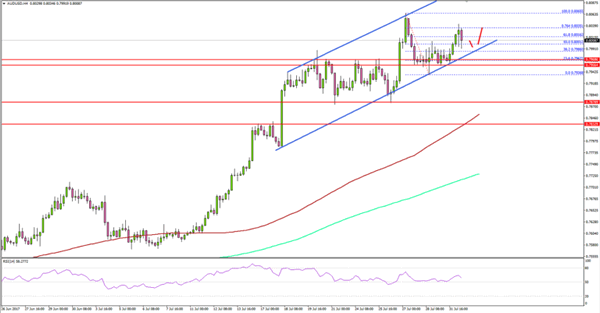
- There is a crucial ascending channel pattern forming with support at 0.7980 on the 4-hours chart of AUD/USD.
- Today, the RBA Interest Rate Decision Number 2017-15 was announced, and the central bank decided to keep rates at 1.5%.
- The AiG performance of the Mfg Index for June 2017 posted an increase from 55 to 56.
AUDUSD Technical Analysis
The past few days were good for the Aussie Dollar, as it moved above 0.8000 against the US Dollar. The AUD/USD pair is currently placed well and looks set to extend gains above 0.8060.
After trading as high as 0.8065, the pair started a correction and moved towards 0.7950. The 0.7960-50 held declines and protected a downside break. Looking at the 4-hours chart, there a crucial ascending channel pattern forming with support at 0.7980.
The pair recently failed near the 76.4% Fib retracement level of the last decline from the 0.8065 high to 0.7936 low. However, it remains supported near 0.8000 and 0.7980. As long as the channel support and 0.7950 is intact, the pair may aim a new monthly high.
RBA Interest Rate Decision
Today, the Interest Rate Decision Number 2017-15 was announced by the Reserve Bank of Australia. The market forecast was no change from 1.5%, and the result was the same.
The central bank statement highlighted the recent rise in AUD/USD. The report mentioned:
The Australian dollar has appreciated recently, partly reflecting a lower US dollar. The higher exchange rate is expected to contribute to subdued price pressures in the economy. It is also weighing on the outlook for output and employment. An appreciating exchange rate would be expected to result in a slower pick-up in economic activity and inflation than currently forecast.
However, the AUD/USD pair not impacted, but there was a minor dip towards 0.8010 after the release.
AiG performance of the Mfg Index
Today, the AiG performance of the Mfg Index for June 2017 was published by the Australian Industry Group. The market forecast was no change in the index from 55.
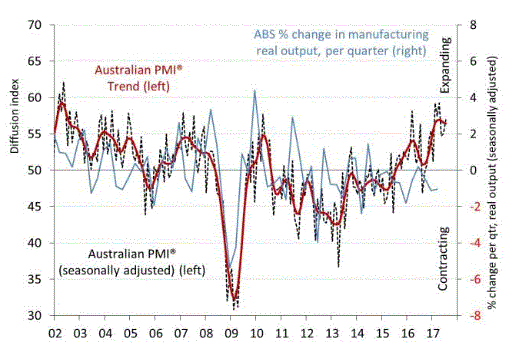
The actual result was better, as there was an increase from the last reading of 55 to 56. Both New orders and sales were up to 55.8 points and 55.8 points respectively.
The report added that:
In July manufacturers cited increased demand from construction, mining (possibly reflecting commodity price increases) and agriculture for locally manufactured construction materials, machinery and equipment.
Overall, the AUD/USD pair remains in an uptrend and it may soon attempt a break above the last high of 0.8065 in the near term.
Trade Idea Update: USD/JPY – Sell at 110.90
USD/JPY - 110.54
Original strategy :
Sell at 110.75, Target: 109.75, Stop: 111.10
Position : -
Target : -
Stop : -
New strategy :
Sell at 110.90, Target: 109.90, Stop: 111.25
Position : -
Target : -
Stop : -
As the greenback has rebounded after falling to 110.00, suggesting consolidation above this level would be seen and corrective bounce to 110.77 (yesterday’s high) cannot be ruled out, however, reckon the upper Kumo (now at 111.01) would limit upside and bring another decline, below said support at 110.00 would extend recent decline from 114.50 to 109.75-80 but loss of downward momentum should limit downside to 109.50 and reckon 109.20-25 would hold.
In view of this, would not chase this fall here and would be prudent to sell dollar again on subsequent recovery as said resistance at 110.77 should limit upside. Above 111.10 (50% Fibonacci retracement of 112.20-110.00) would defer and risk test of 111.29 resistance but only break there would signal a temporary low is formed instead, bring rebound to 111.50-55 first.

USD/JPY Mid-Day Outlook
Daily Pivots: (S1) 110.36; (P) 110.84; (R1) 111.14; More...
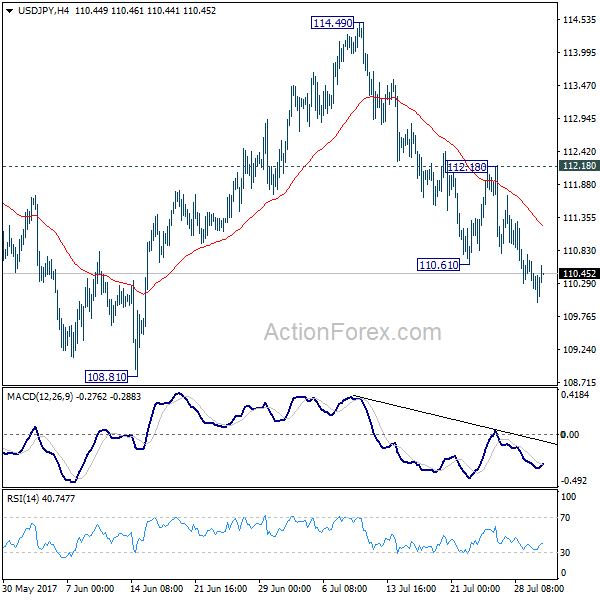
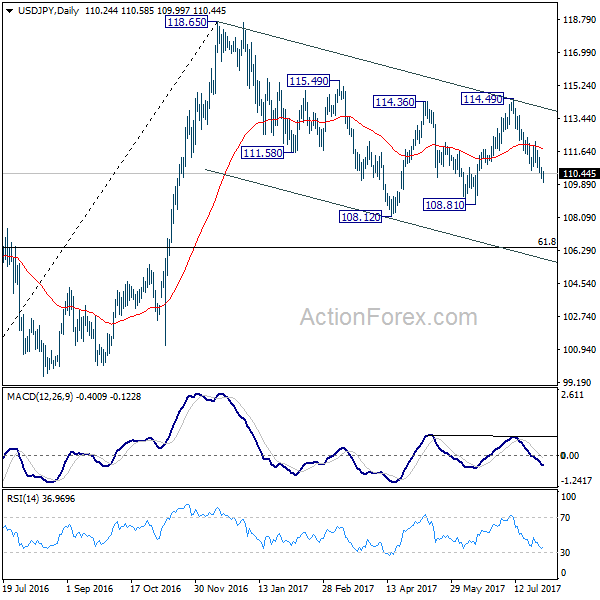
Intraday bias in USD/JPY remains on the downside for further decline to 108.81 support. Break there will resume whole correction from 118.65 and target 61.8% retracement of 98.97 to 118.65 at 106.48. Nonetheless, break of 112.18 resistance will dampen this bearish view and turn focus back to 114.49 resistance instead.
In the bigger picture, the corrective structure of the fall from 118.65 suggests that rise from 98.97 is not completed yet. Break of 118.65 will target a test on 125.85 high. At this point, it's uncertain whether rise from 98.97 is resuming the long term up trend from 75.56, or it's a leg in the consolidation from 125.85. Hence, we'll be cautious on topping as it approaches 125.85. If fall from 118.65 extends lower, down side should be contained by 61.8% retracement of 98.97 to 118.65 at 106.48 and bring rebound.