Sample Category Title
USD/JPY Mid-Day Outlook
Daily Pivots: (S1) 110.36; (P) 110.84; (R1) 111.14; More...
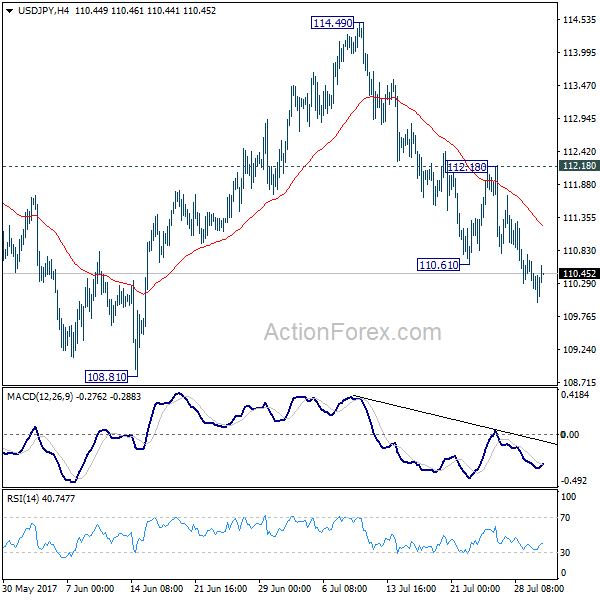
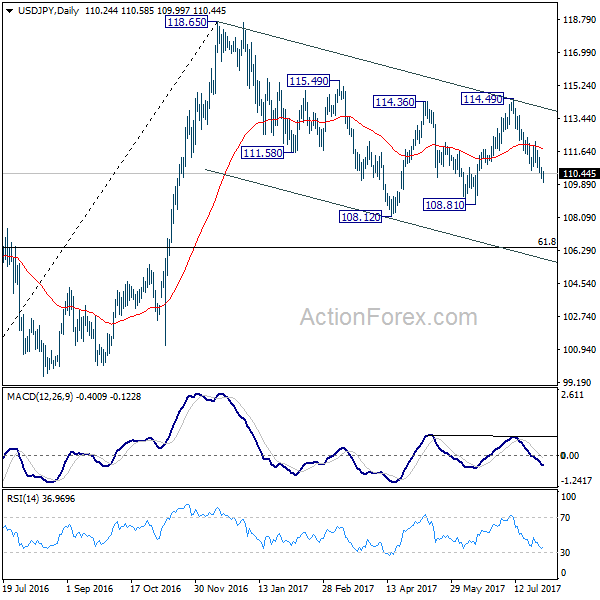
Intraday bias in USD/JPY remains on the downside for further decline to 108.81 support. Break there will resume whole correction from 118.65 and target 61.8% retracement of 98.97 to 118.65 at 106.48. Nonetheless, break of 112.18 resistance will dampen this bearish view and turn focus back to 114.49 resistance instead.
In the bigger picture, the corrective structure of the fall from 118.65 suggests that rise from 98.97 is not completed yet. Break of 118.65 will target a test on 125.85 high. At this point, it's uncertain whether rise from 98.97 is resuming the long term up trend from 75.56, or it's a leg in the consolidation from 125.85. Hence, we'll be cautious on topping as it approaches 125.85. If fall from 118.65 extends lower, down side should be contained by 61.8% retracement of 98.97 to 118.65 at 106.48 and bring rebound.
USD/CHF Mid-Day Outlook
Daily Pivots: (S1) 0.9632; (P) 0.9672; (R1) 0.9708; More...
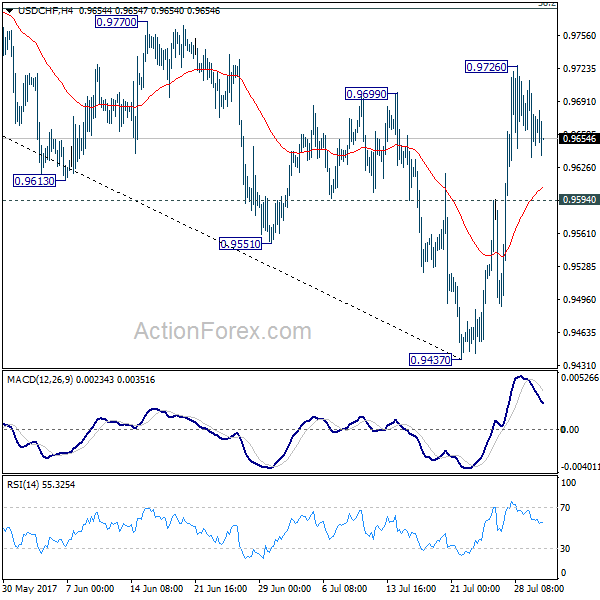
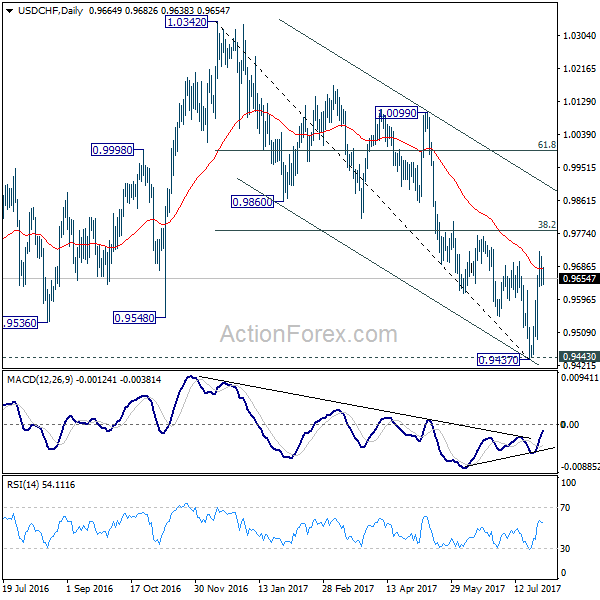
Intraday bias in USD/CHF remains neutral for the moment. Another rise is expected as long as 0.9594 support holds. Prior break of 0.9699 resistance suggests near term reversal after defending 0.9443 key support. Above 0.9726 will target 38.2% retracement of 1.0342 to 0.9437 at 0.9783 first. Break will target channel resistance (now at 0.9899). However, firm break of 0.9594 will dampen this bullish view and turn bias back to the downside for 0.9437.
In the bigger picture, current development argues that USD/CHF has successfully defended 0.9443 key support level. And long term range trading in 0.9443/1.0342 is extending with another rise. At this point, there is no sign of an up trend yet. Hence, while further rise is expected in USD/CHF, we'll start to be cautious on loss of momentum above 61.8% retracement of 1.0342 to 0.9437 at 0.9996.
GBP/USD Mid-Day Outlook
Daily Pivots: (S1) 1.3129; (P) 1.3176; (R1) 1.3255; More...
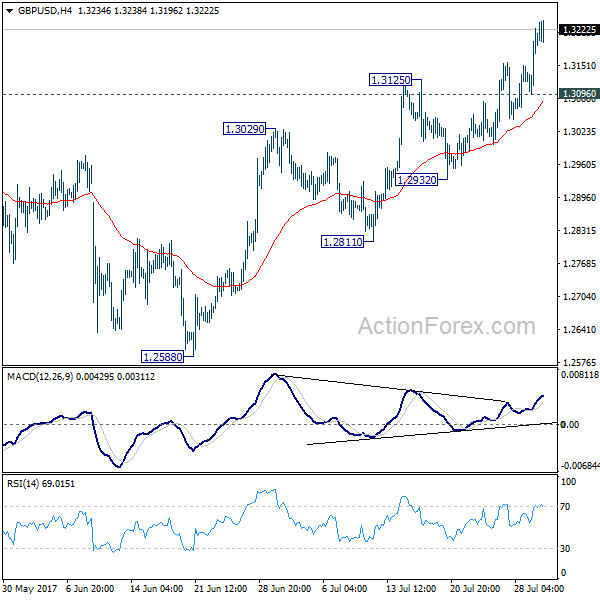
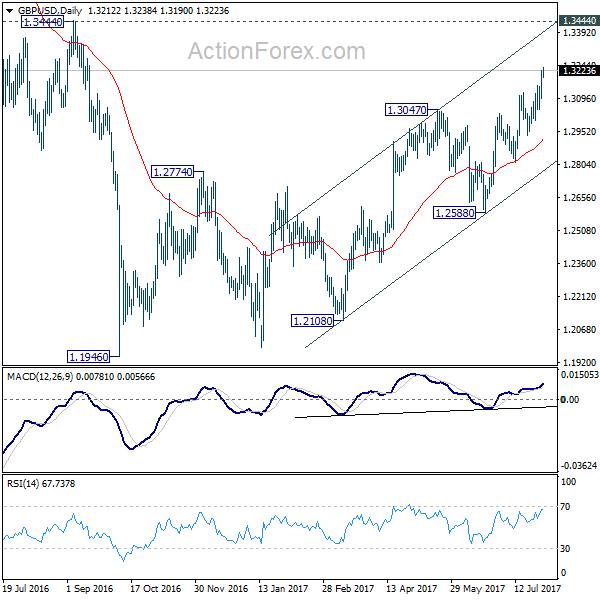
Intraday bias in GBP/USD remains on the upside for the moment. Current rally could target 1.3444 key resistance. But still, price actions from 1.1946 are viewed as a corrective pattern. Hence, we'll look for topping signal again around 1.3444. On the downside, below 1.3096 minor support will turn bias neutral first. Further break of 1.2932 support will indicate reversal and will turn bias to the downside to target 1.2588 key support next.
In the bigger picture, overall, price actions from 1.1946 medium term low are seen as a corrective pattern that is still in progress. While further upside is expected, larger outlook remains bearish as long as 1.3444 key resistance holds. Down trend from 1.7190 (2014 high) is expected to resume later after the correction completes. And break of 1.2588 will indicate that such down trend is resuming.
EUR/USD Mid-Day Outlook
Daily Pivots: (S1) 1.1760; (P) 1.1802 (R1) 1.1883; More...
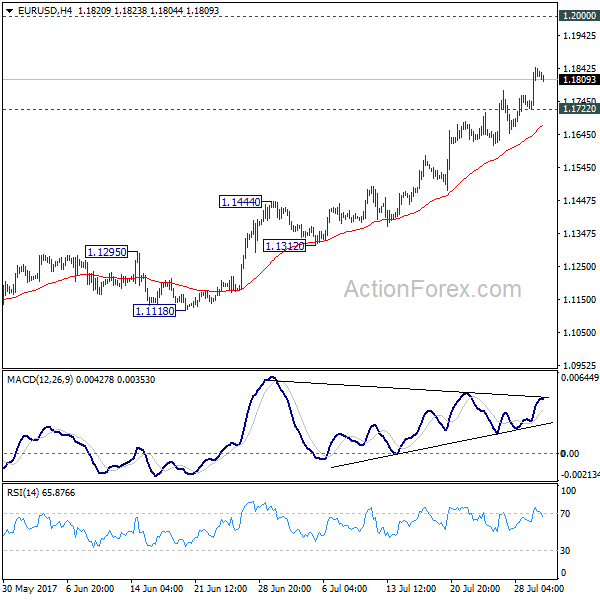
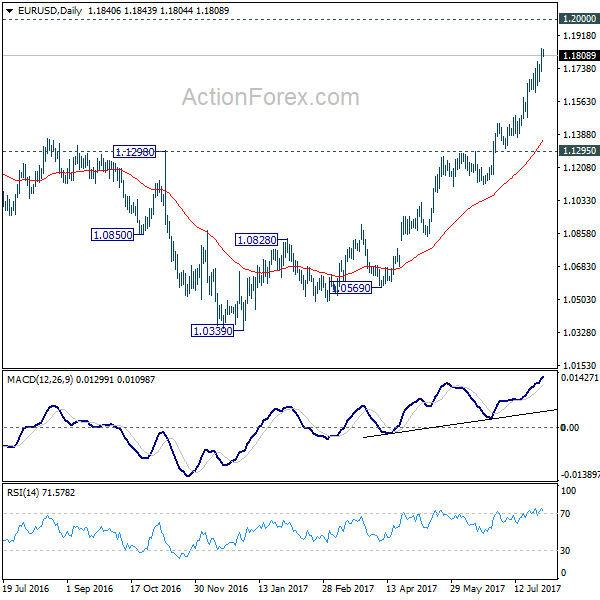
Intraday bias in EUR/USD remains on the upside for the moment. Current rise 1.0339 should target 1.2 handle next. Firm break there will pave the way to next key fibonacci level at 1.2516. On the downside, below 1.1722 minor support will turn intraday bias neutral and bring consolidation before staying another rally.
In the bigger picture, an important bottom was formed at 1.0339 on bullish convergence condition in weekly MACD. Sustained break of 55 month EMA (now at 1.1760) will pave the way to key fibonacci level at 38.2% retracement of 1.6039 (2008 high) to 1.0339 (2017 low) at 1.2516. While rise from 1.0339 is strong, there is no confirmation that it's developing into a long term up trend yet. Hence, we'll be cautious on strong resistance from 1.2516 to limit upside. But for now, medium term outlook will remain bullish as long as 1.1295 support holds, in case of pull back.
European Majors Firm, Supported by Eurozone GDP and UK PMI Manufacturing
European majors are generally the strong ones this week so far. While Euro and Sterling lost some intraday momentum after yesterday's rally, they're both remain firm as supported by solid economic data. ON the other hand, While data from US are not too back, the greenback is being pressured by the political drama in the White House. Aussie is leading commodity currencies down as RBA warned of its recent appreciates in the rate decision statement. In other markets, US futures point to high open as DOW would likely extend the record run. Gold continues to ride on Dollar Weakness and stays firm above 1270. WT crude oil is hovering around 50 for the moment and is trying to find follow through buying above this level. Release from US, person income rose 0.0% in June, below expectation of 0.4%. Personal spending rose 0.1%, in line with consensus. Headline PCE slowed to 1.4% yoy but beat expectation of 1.3% yoy. Core PCE was unchanged at 1.5% yoy, above expectation of 1.4% yoy.
Quick update: ISM Manufacturing missed expectation by 0.1 by dropping to 56.3 in July. But price paid gauge surprised on the upside by rising to 62.0.
UK PMI manufacturing shows growth acceleration
UK PMI manufacturing rose to 55.1 in July, up from 54.2, above expectation of 54.5. Markit noted that "UK manufacturing started the third quarter on a solid footing". The PMI indicated a "a growth acceleration for the first time in three months during July, as new order intakes were boosted by a near survey-record increase in new export business." Besides the help from lower Sterling exchange rate, "manufacturers also benefited from stronger economic growth in key markets in the euro area, North America and Asia-Pacific regions." Also, Markit added that "continued expansion is also still filtering through to the labour market, with the latest round of manufacturing job creation among the best seen over the past three years."
Eurozone GDP rose 17 quarters in a row, accelerated in Q2
The economic outlook of Eurozone seems even brighter as GDP growth accelerated to 0.6% qoq in Q2, in line with consensus. That's the 17 quarters of growth in a row, which started back in early 2013. Also from Eurozone, Germany unemployment dropped -9k in July, larger than expectation of -5k fall. Unemployment rate was unchanged at 5.7%. Eurozone PMI manufacturing was revised down by 0.2 to 56.6 in July. Italy PMI manufacturing dropped 0.1 to 55.1 in July.
RBA Maintained Status Quo, Warned that Strong Aussie is Curbing Growth
As widely anticipated, the RBA left the cash rate unchanged at 1.5%. Policymakers acknowledged that June inflation drifted back below the +2% target but remained confident it would improve gradually alongside the pickup of the economy. Policymakers, however, warned of Australian dollar's appreciation, suggesting that it would limit economic growth. A reference of the negative impact of strong currency on economic developments reappeared as AUDUSD has risen +5.7% from July's low of 0.7567. More in RBA Maintained Status Quo, Warned that Strong Aussie is Curbing Growth
Elsewhere
China Caixin PMI manufacturing rose to 51.1 in July, up from 50.4, and beat expectation of 50.4. It's noted in the statement that "panelists widely commented on an improvement in market conditions and strong foreign demand. Notably, new export sales increased at the second-fastest rate since September 2014." New export orders jumped sharply from 50.9 to 53.5, hitting the highest level since February.
EUR/USD Mid-Day Outlook
Daily Pivots: (S1) 1.1760; (P) 1.1802 (R1) 1.1883; More...
Intraday bias in EUR/USD remains on the upside for the moment. Current rise 1.0339 should target 1.2 handle next. Firm break there will pave the way to next key fibonacci level at 1.2516. On the downside, below 1.1722 minor support will turn intraday bias neutral and bring consolidation before staying another rally.
In the bigger picture, an important bottom was formed at 1.0339 on bullish convergence condition in weekly MACD. Sustained break of 55 month EMA (now at 1.1760) will pave the way to key fibonacci level at 38.2% retracement of 1.6039 (2008 high) to 1.0339 (2017 low) at 1.2516. While rise from 1.0339 is strong, there is no confirmation that it's developing into a long term up trend yet. Hence, we'll be cautious on strong resistance from 1.2516 to limit upside. But for now, medium term outlook will remain bullish as long as 1.1295 support holds, in case of pull back.
Economic Indicators Update
| GMT | Ccy | Events | Actual | Forecast | Previous | Revised |
|---|---|---|---|---|---|---|
| 00:30 | JPY | PMI Manufacturing Jul F | 52.1 | 52.2 | 52.2 | |
| 01:45 | CNY | Caixin PMI Manufacturing Jul | 51.1 | 50.4 | 50.4 | |
| 04:30 | AUD | RBA Rate Decision | 1.50% | 1.50% | 1.50% | |
| 06:00 | GBP | Nationwide House Prices M/M Jul | 0.30% | -0.10% | 1.10% | |
| 07:45 | EUR | Italy Manufacturing PMI Jul | 55.1 | 55.1 | 55.2 | |
| 07:50 | EUR | France Manufacturing PMI Jul F | 54.9 | 55.4 | 55.4 | |
| 07:55 | EUR | Germany Manufacturing PMI Jul F | 58.1 | 58.3 | 58.3 | |
| 07:55 | EUR | German Unemployment Change Jul | -9k | -5k | 7k | 6k |
| 07:55 | EUR | German Unemployment Rate Jul | 5.70% | 5.70% | 5.70% | |
| 08:00 | EUR | Eurozone Manufacturing PMI Jul F | 56.6 | 56.8 | 56.8 | |
| 08:30 | GBP | PMI Manufacturing Jul | 55.1 | 54.5 | 54.3 | 54.2 |
| 09:00 | EUR | Eurozone GDP Q/Q Q2 A | 0.60% | 0.60% | 0.60% | 0.50% |
| 12:30 | USD | Personal Income Jun | 0.00% | 0.40% | 0.40% | 0.30% |
| 12:30 | USD | Personal Spending Jun | 0.10% | 0.10% | 0.10% | 0.20% |
| 12:30 | USD | PCE Deflator M/M Jun | 0.00% | 0.00% | -0.10% | |
| 12:30 | USD | PCE Deflator Y/Y Jun | 1.40% | 1.30% | 1.40% | 1.50% |
| 12:30 | USD | PCE Core M/M Jun | 0.10% | 0.10% | 0.10% | |
| 12:30 | USD | PCE Core Y/Y Jun | 1.50% | 1.40% | 1.40% | 1.50% |
| 14:00 | USD | ISM Manufacturing Jul | 56.3 | 56.4 | 57.8 | |
| 14:00 | USD | ISM Prices Paid Jul | 62 | 56.5 | 55 | |
| 14:00 | USD | Construction Spending M/M Jun | -1.30% | 0.50% | 0.00% |
GBPAUD Drifts Higher But Bearish Bias Still In Place
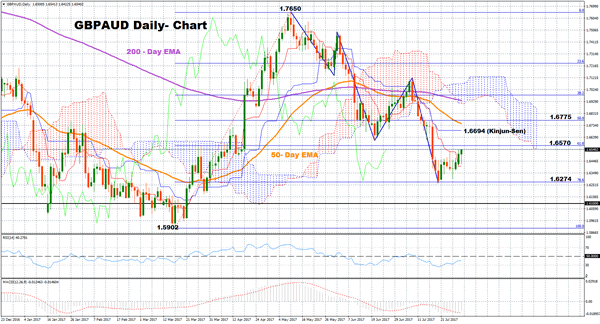
GBPAUD has been in a downtrend since May 10 when it touched a ten-month high of 1.7650. Despite the pair climbing for the fourth consecutive day, the bearish short-term and medium-term picture is still intact according to the technical indicators.
The pair dipped further into bearish territory on July 11 when the pair crossed below the Ichimoku cloud and the 50-day and 200-day exponential moving averages (EMA), cementing the short-term negative momentum. An additional bearish evidence arises from the RSI and the MACD, which are currently trending below 50 and 0 respectively.
Should the pair head up, a resistance would be first found at the 61.8% Fibonacci level of 1.6570 of the upleg from 1.5902 to 1.7650 (March-May). From that point, a barrier to upside movements would be met at the Kinjun-sen point of 1.6694, while further increases would target the 50% Fibonacci of 1.6775, which is also close to the 50-day EMA line.
Alternatively, if the pair moves downwards, an immediate support would be provided by the 78.6% Fibonacci mark of 1.6274 which also acted as a support on July 20. From here, any declines would shift the focus to the psychological level of 1.6100, whereas a break below the swing-low of 1.5902 (March 16) would bring a resumption of the longer-term downtrend.
Looking at the medium-term picture, the outlook is bearish as well, as prices have been making lower highs and lower lows for the past three months. Moreover, the bearish cross between the 50-day and the 200-day EMA on June 19 and the fact that both lines are currently sloping negatively reinforce the bearish medium-term outlook.
Aussie Breaks Above $0.80 But Loses Ground After RBA Keeps Rates On Hold
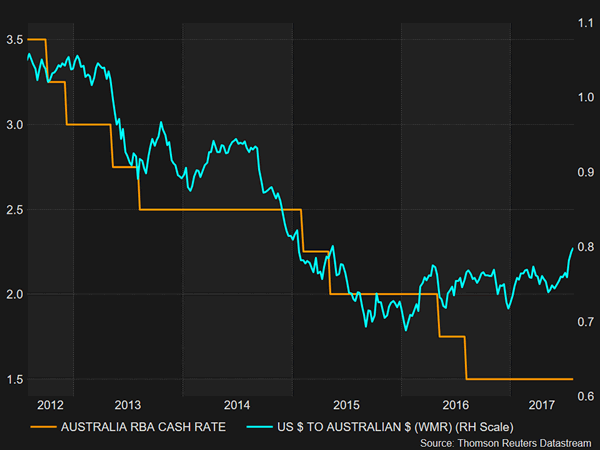
Early on Tuesday, the Australian dollar picked up following the upbeat Chinese PMI data, but a few hours later the RBA's decision to maintain its monetary policy on hold over concerns of a rising exchange rate drove the currency lower.
As expected, RBA policymakers held interest rates steady on Tuesday at a record low of 1.5% at their August meeting, with rates being unchanged for almost a year now. Despite the bank's forecasts about Australian economic growth remaining optimistic, as employment opportunities, consumer confidence, and business conditions are continuously improving, RBA members are worried about the inflation outlook. With employees enjoying only less than half the wage growth from a decade ago and wages rising at a multi-year low rate of 1.9%, employees' disposable income is restricted by heavy debt obligations, and this is creating downwards pressure on prices. Moreover, the RBA governor Philip Lowe expressed his concerns in the statement about the appreciation of the aussie, which also contributes to the weak course of inflation by lowering import prices, saying that 'an appreciating exchange rate would be expected to result in a slower pick-up in economic activity and inflation than currently forecast.'.
Before the RBA's announcement though, Chinese Caixin manufacturing purchasing managers index, which gives a general view of activity in the manufacturing sector, surprised analysts to the upside who had anticipated the index to stick to its previous reading. The Caixin manufacturing PMI climbed to 51.1 in July compared to 50.4 in June, posting the highest mark since April.
Turning to the forex markets, the aussie peaked above $0.80, climbing by 0.50% to $0.8042 in early Asian trading, finding support particularly due to the dollar's weakness and the Chinese data. However, the aussie followed a downtrend after the RBA statement, reversing part of its overnight gains and falling to $0.8010.
Dollar Under A Political Cloud
Tuesday August 1: Five things the markets are talking about
Global equities continue to remain better bid on corporate earnings and promising Asian economic data, while the mighty dollar takes a time-out overnight, trading sideways as the market digests the latest developments in Washington.
In July, the dollar slid for a fifth-consecutive month, its longest losing streak in six-years, as the market grew more cautious on prospects for growth-supportive U.S policies and the path for higher interest rates.
President Trump's agenda has repeatedly hit political roadblocks while U.S. inflation has also softened, a potential obstacle for Ms. Yellen and the rest of the Fed.
Note: Fed funds futures see a less than 50% chance that the Fed sticks to its plans to hike rates again this year.
Now, it's back to the drawing board, today's U.S manufacturing data (10:00 am EDT) and Friday's non-farm payrolls release will provide further clues on the health of the U.S economy.
1. Stocks grind higher
In Japan, brisk corporate earnings continue to boost the Nikkei (+0.3%), but a stronger yen (¥110.37) continues to caps the gains. The broader Topix added +0.6%.
Down-under, Australia's S&P/ASX 200 Index closed +0.9%, while South Korea's Kospi index ended up +0.8%.
In Hong Kong, the Hang Seng Index rallied +0.7%, closing at a 25-month high after completing a seventh-straight month of gains while the Shanghai Composite Index climbed +0.3%.
In China, blue chips reached a 19-month high on an upbeat factory survey (China Caixin PMI 51.1 vs. 50.4) – both output and new orders rose at the fastest pace since February on strong export sales. China's CSI300 index rallied +0.9%, while the Shanghai Composite Index added +0.6%.
In Europe, regional bourses trade modestly higher across the broad, supported by stronger PMI data out of China as well as a weakening U.S dollar. Corporate earnings continue to come in generally positive with the FTSE outperforming following results from the resource and automotive sectors.
U.S stocks are set to open in the black (+0.4%).
Indices: Stoxx600 +0.5% at 379.8, FTSE +0.8% at 7428, DAX +0.5% at 12173, CAC-40 +0.5% at 5120, IBEX-35 +0.8% at 10585, FTSE MIB +0.3% at 21560, SMI +0.4% at 9055, S&P 500 Futures +0.4%
2. Oil hits two-month high, further U.S inventory drop seen, and gold steady
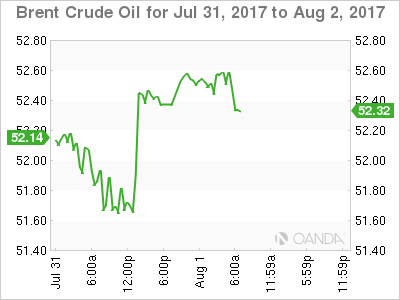
Oil prices continue to climb, trading atop of its two-month highs supported by signs that a persistent supply glut is starting to ease amid strong demand and OPEC-led production curbs.
Note: U.S inventory data today and tomorrow are expected to show crude stocks falling by -2.9m barrels last week, the fifth straight week of declines.
Brent crude is up +12c at +$52.84 a barrel, while U.S light crude (WTI) is up +20c at +$50.37.
Oil company BP remains upbeat on the demand outlook, stating this morning that global demand recovered in Q2 and was expected to grow by +1.4 to +1.5m bpd – that's higher than OPEC's own forecasts.
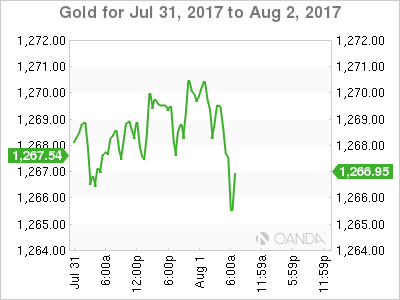
Gold prices are trading atop/near its seven-week high overnight (+0.2% to +$1,269.27 an ounce) as tensions on the Korean peninsula boosted safe-haven demand for the precious metal – It gained +1.1% last week in what was its third consecutive weekly gain.
Silver also rallied +1.2% last week, its third straight weekly gain, while copper climbed +1.2% to +$2.91 a pound, its highest price in more than two-years.
3. Yield curves trade in a tight range
Yesterday's U.S Treasury bill auction demand for six-month product was low, near the bottom of the yearly range, while the three-month bills saw its highest demand since July 3.
Auction results:
+$39B 3-month bills drew +1.070%, with a bid-to-cover of 3.18, while +$33B 6-month bills drew +1.130%, and a bid-to-cover 3.08 – 3-month +84.5% allotted at the high, while 6-month only +12.0% were allotted at the high.
Overnight, the Reserve Bank of Australia (RBA) left its cash target rate unchanged (+1.5%) as expected, and noted that the recent AUD (A$0.8000) strength is more about the ‘big' dollar weakness.
The yield on U.S 10-year Treasuries gained +1 bps to +2.30%, while Germany's 10-year Bund yield decreased less than -1 bps to +0.54%. The U.K's 10-year Gilt yield gained +1 bps to +1.237%, the highest in a week. The Bank of England (BoE) rate announcement is this Thursday and no change is expected.
4. Dollar: Investors are betting against Trumponomics
U.S political uncertainty continues to drive the ‘mighty' buck lower across the board. Another hasty shakeout in the Trump administration yesterday is adding further uncertainty over the greenback as the market begins to price out another Fed rate hike in coming months.
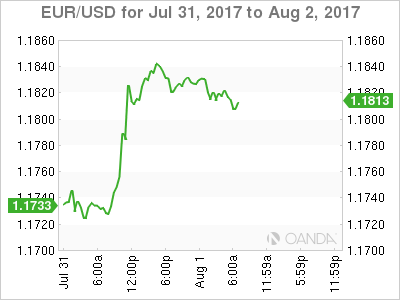
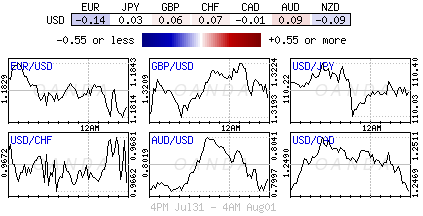
The EUR/USD (€1.1817) remains above some key technical and psychological levels after President Trump ousted recently hired White House communications Chief Scaramucci yesterday afternoon. The market remains very skeptical that Trump will be able to get plans for tax reforms and infrastructure spending through Congress.
Elsewhere, USD/JPY (¥110.33) trades atop of its six -week lows, but maintains a foothold above the psychological ¥110 level. Sterling is little changed, up +0.2% at £1.3223.
5. U.K manufacturing activity accelerates, Eurozone grows
Data this morning showed that U.K manufacturing activity growth accelerated in July, as strong exports boosted orders.
The purchasing managers' index (PMI) for British manufacturing rose to 55.1 m/m, from June's downward-revised reading of 54.2. It beat market expectations of 54.9.
Digging deeper, it was noted that despite the exchange rate remaining a key driver of export growth, manufacturers also benefited from stronger economic growth in key markets in the Eurozone, North America and Asia-Pacific regions.
Other data showed that the Eurozone economy grew by +0.6% in Q2 and +2.1% year-on-year, in line with expectations. That converts into a +2.3% annualized growth rate – a tad slower than the U.S, but faster than the U.K.
Note: The year-on-year figure is the highest in six-years and reason why the ECB is talking tapering monetary easing.
Eurozone GDP Growth Ticks Up To 0.6% In Q2, Euro Steady
Economic growth in the euro area accelerated slightly to 0.6% quarter-on-quarter in the three months ending June, in line with analysts' expectations. In the previous quarter, growth was revised down however, from 0.6% to 0.5%. On 12-month basis, GDP growth edged up from 1.9% to 2.1%, also in line with forecasts and the highest since the final quarter of 2015.
The data reinforces the view that the Eurozone economy continues to gain momentum after more than two years of massive asset purchases by the European Central Bank and almost a year and a half of negative interest rates. Today's figures are based on the flash preliminary estimates from Eurostat, with a more detailed release due on August 16.
The euro was steady just above the $1.18 level in forex markets after the data, having hit a fresh 2½-year high of $1.1845 overnight. The single currency has rallied 14.5% against the US dollar from its January low of $1.0339, which was a 14-year trough.
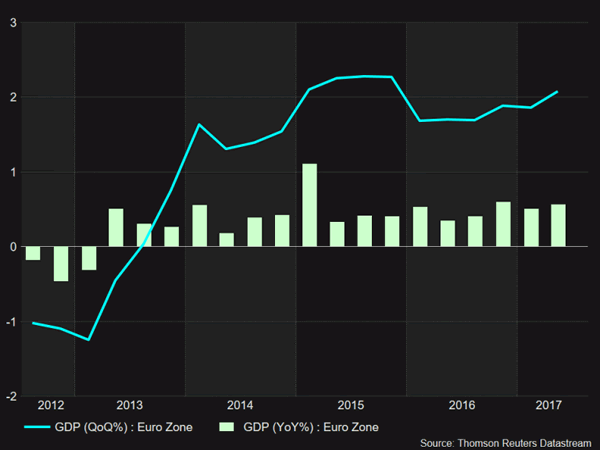
Expectations that the ECB will announce at one of its upcoming meetings in the autumn its decision to scale back its ultra-loose monetary policy have driven the euro to multi-year highs against its major peers. The ECB has so far moved very cautiously in toning down its easing bias, refusing to drop its pledge to increase the size of its asset purchases if needed in its forward guidance at the July policy meeting.
Subdued inflation and wage growth are the main concern for the central bank. Most indicators point to a broadening of the economic recovery across the region, and even the stubbornly high unemployment rate appears to be setting a path of a steepening downtrend. The Eurozone’s jobless rate declined to 9.1% in June – the lowest since 2009.
However, there are signs that underlying price pressures might be picking up. Monday’s flash inflation reading for July showed core CPI rose unexpectedly to 1.3% from 1.2%, beating forecasts that it would ease to 1.1%. If core inflation continues to surprise on the upside, it would add pressure on the ECB to tighten policy more aggressively than the very gradual pace it has so far signalled to the markets.
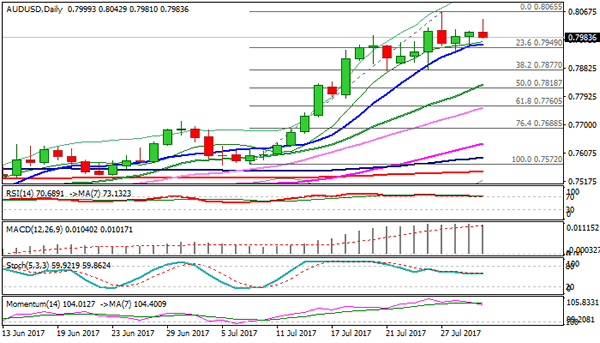
Technical Outlook: AUDUSD – Short-Lived Probe Above 0.8000 After RBA Suggests Further Consolidation
The pair eases from fresh session high at 0.8042, posted on rally after RBA, confirming 0.8000 zone (reinforced by falling weekly 200SMA) as very strong resistance, after several attempts above it failed.
RBA is not seen as strong market driver, with focus remaining on the US dollar performance which boosted the Aussie in recent weakness.
This suggests that the pair may spend more time in consolidation and even dip lower, on negative signal from daily RSI reversal from overbought territory.
Initial supports lay at 0.7970/61 (daily Tenkan-sen which turned sideways and 10SMA), break of which would expose key near-term support at 0.7877 (higher base / Fibo 38.2% of 0.7572/0.8065 upleg).
Sustained break here is needed to signal reversal.
Likely scenario is for extended sideways mode ahead of Friday's key releases, RBA Monetary Policy Statement and US NFP data which are eyed for stronger direction signals.
Firm break above 0.8000 barrier would spark fresh extension of current wave C of five-wave cycle from 0.7535 towards its FE300% at 0.8114.
Res: 0.8000, 0.8042, 0.8065, 0.8114
Sup: 0.7961, 0.7936, 0.7900, 0.7877