Sample Category Title
EURUSD Intraday Analysis
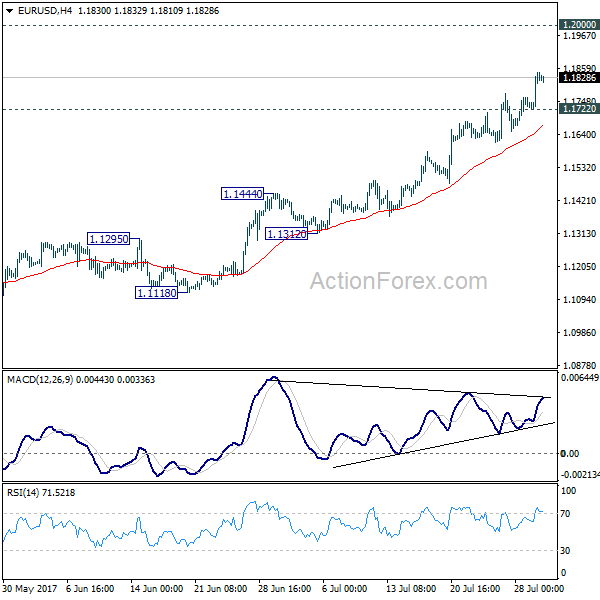
EURUSD (1.1824): The EURUSD rally continued to power ahead with full steam with the common currency breaching past 1.1800 to rise to a fresh two and a half year low. The gains came on renewed optimism that the ECB could tighten monetary policy.
This was after the flash eurozone inflation estimate release and a better than expected unemployment data. The strong surge in the currency pair puts the downside in question. Support is now likely to be established at 1.1748 which marked the previous high befre price action broke past this level with a strong bullish candlestick pattern. Any declines could be expected only on a breakdown below the 1.1748 support, in which case expect to see the next support at 1.1635 coming into question.
Euro Rises Above 1.1800 As Inflation Data Better Than Expected
The US dollar weakened on the last trading day for July. The month end buying saw the greenback post fresh lows which sent its peers such as the EURUSD to a new two and half year highs.
Economic data from the Eurozone yesterday saw the flash inflation estimates for July remaining stable. Headline inflation remained steady at 1.3%, but core inflation rose to 1.2% from 1.1% previously. The unemployment rate fell to 9.1% in June. This was better than 9.2% revised estimates post for the month of May. The overall positive data helped to push the common currency higher.
Looking ahead, economic data today will be busy, starting with the US ISM manufacturing PMI. Economists polled expect to see the manufacturing index slip to 56.4 after the index rose to 57.8 in June. New Zealand will be releasing the quarterly unemployment data as well. Expectations call for the NZ unemployment rate to fall to 4.8% on the quarter.
EUR/GBP Daily Outlook
Daily Pivots: (S1) 0.8938; (P) 0.8957; (R1) 0.8980; More
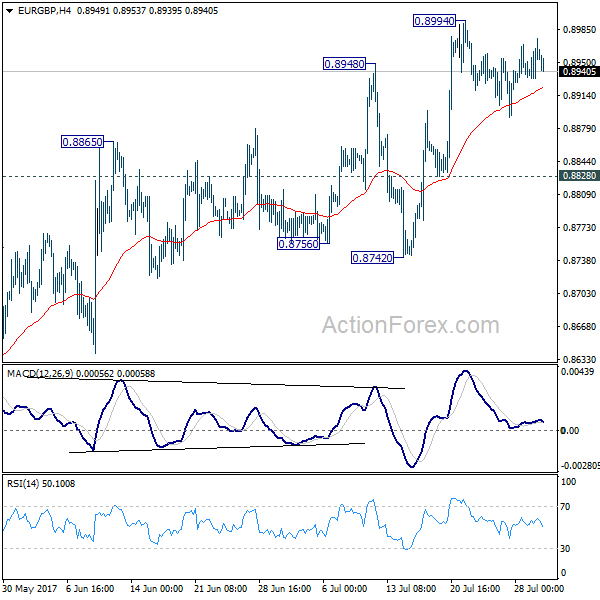
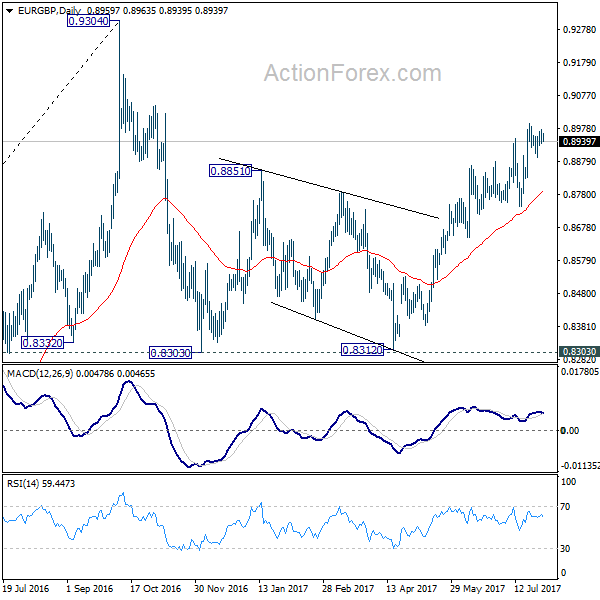
EUR/GBP is still bounded in consolidation from 0.8994 and intraday bias remains neutral. In case of another retreat, downside should be contained by 0.8828 to bring rise resumption. Whole rally from 0.8312 is still in progress and break of 0.8994 will target 0.9304 key high. There is no clear sign of up trend resumption yet. Hence, we'll be cautious on strong resistance from 0.9304 to limit upside and bring another fall. However, break of 0.8828 will turn focus back to 0.8742 support. Break there will indicate near term reversal.
In the bigger picture, price actions from 0.9304 are viewed as a medium term corrective pattern. It's uncertain whether it is finished yet. But in case of another fall, we'd expect strong support from 0.8116 cluster support (50% retracement of 0.6935 to 0.9304 at 0.8120) to contain downside and bring rebound. Whole up trend from 0.6935 is expected to resume after consolidation from 0.9304 completes.
RBA Keeps Official Cash Rate At 1.5%
Earlier this morning, the Reserve Bank of Australia kept its official cash rate on hold, at 1.5%, as the market had expected. Australia's headline inflation for the year to date of 1.9% is below the RBA's target band of 2 to 3%, so any hike in interest rates was always unlikely. More so, export demand may be reduced with recent USD weakening and strengthening commodity prices putting pressure on AUD.
In another showing of the Trump Administrations lack of 'continuity' the recently positioned Chief of Staff, John Kelly, fired Trumps recently installed communications director Anthony Scaramucci after just 10 days in the job. Concern abounds from the markets that the US Administration is in turmoil, although Kelly's appointment may bring ease to the markets as he is regarded as a tough disciplinarian. USD weakness continued Monday with key levels being breached in many financial instruments. There appears to be no immediate respite to USD pressure, although Friday's NFP may slow further USD declines?
EURUSD rose on Monday to 1.1846; levels not seen since January of 2015. EURUSD has gained nearly 15% since trading around 1.0340 back in early January. Markets are eyeing 1.20 as the next major level if USD weakness continues. EURUSD is currently trading around 1.1820.
USDJPY fell to a 6-week low on Monday of 110.005 and is little changed overnight, currently trading around 110.25.
GBP remains strong against USD and is currently trading just above 1.3200, after hitting an early high on Tuesday of 1.32344.
AUDUSD improved on Monday on the back of improved Chinese data and is little changed following the RBA announcement that kept the official cash rate at 1.5%. Currently, AUDUSD is trading around 0.8010.
Gold remains strong, reaching levels not seen since late 2016. Gold is currently trading around $1,269.5.
Oil maintained its recent gains and may move higher, as the US announced that it was imposing sanctions against Venezuelan President Maduro. Currently, WTI is trading near Tuesday's high of $50.35pb.
At 10:00 BST Eurostat will release Eurozone Gross Domestic Product (YoY) & (QoQ) for the second quarter. Year on Year consensus is expected at 2.1%, an improvement on Q1's release of 1.9%. Markets will be looking to see that the Eurozone economy is indeed strengthening, which should mean an easing of monetary policy by the ECB.
At 13:30 BST will see a plethora of data releases from the US: Personal Consumption expenditures. Personal Income & Personal Spending all (MoM) and (YoY). The markets need to see an improvement in all the releases to underline an improving US economy. Spending needs to improve to get an upward move in CPI that will help the Federal Reserve justify any further hikes by year end.
AT 15:00 BST the Institute for Supply Management (ISM) will release Manufacturing PMI (Jul) and Prices Paid. Consensus for both releases are 56.5 and 56 respectively (from 57.8 and 55 respectively previously). As an indicator of Business conditions in the US Manufacturing sector, a slight reduction is expected but a significant drop will see further downward pressure on USD.
EUR/AUD Daily Outlook
Daily Pivots: (S1) 1.4716; (P) 1.4762; (R1) 1.4839; More...
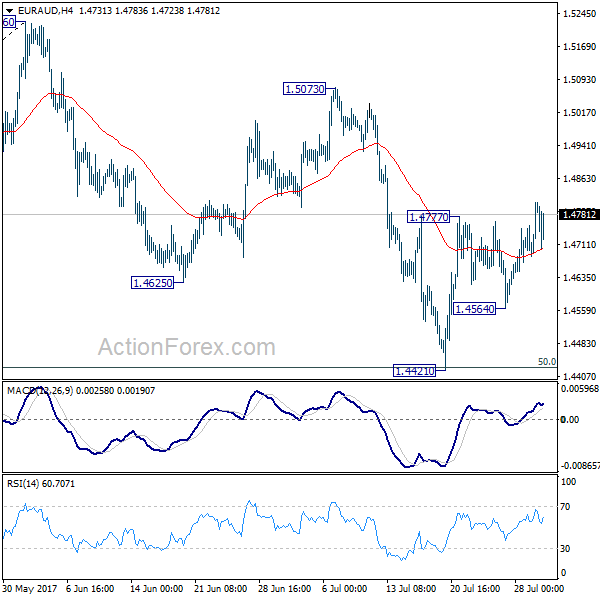
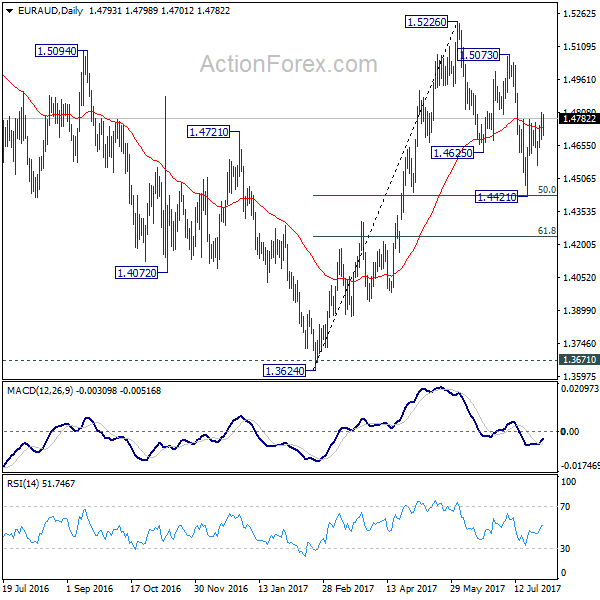
EUR/AUD's break of 1.4777 indicates resumption of the rise from 1.4421. Intraday bias is back on the upside for 1.5073 resistance. As not before, correction from 1.5226 should have completed with three waves down to 1.4421 already. On the downside, break of 1.4564 support will dampen this bullish view and will turn bias back to the downside for 1.4421 support instead.
In the bigger picture, we're holding on to the view that corrective decline from 1.6587 medium term has completed at 1.3624. Rise from 1.3624 is expected to resume to retest 1.6587. The corrective structure of the fall from 1.5226 is affirming this view. Above 1.5226 will target a test on 1.6587 key resistance. However, another decline will dampen our view and would drag EUR/AUD lower to retest key support zone around 1.3624.
Market Update – Asian Session: China PMIs Remain In Expansion, RBA Leaves Rate Unchanged Noting Dollar Weakness
Asia Summary
Markets in the region opened mixed before strengthening on the back of strong China data . Broad dollar weakness as the overall theme with Anthony Scaramucci was removed as White House communications director just 10 days after being appointed by Trump, just adding fuel to the fire. Geopolitical risk remains a concern for global growth with no continent being immune from the risk. According to Oliver Wyman banks may need $30-50B in additional capital to support new European units after hard Brexit. RBA left cash target rate unchanged, as expected noting that the recent Aussie strength is more dollar weakness.
Regional PMI Manufacturing PMIs were generally weaker with only Malaysia and Taiwan rising m/m. China Caixin PMI manufacturing rose to its highest reading since March and had its second consecutive month of expansion. South Korea had a large trade surplus at $10.6B, exports rose to US, EU and China. China's OMO were lower from the prior day, while the PBOC set the yuan mid-point rate at its strongest setting since Oct of last year.
Key economic data
(CN) CHINA JUL CAIXIN PMI MANUFACTURING: 51.1 V 50.4E (highest reading since March, 2nd consecutive month of expansion)
(AU) RESERVE BANK OF AUSTRALIA (RBA) LEAVES CASH RATE TARGET UNCHANGED AT 1.50%; AS EXPECTED
(KR) SOUTH KOREA JULY CPI M/M: 0.2% V 0.1%E; Y/Y: 2.2% V 2.1%E; CPI CORE Y/Y: 1.8% V 1.6%E
(AU) AUSTRALIA JUL AIG PERFORMANCE OF MANUFACTURING INDEX: 56.0 V 55.0 PRIOR
(KR) SOUTH KOREA JULY TRADE BALANCE: $10.6B V $8.7BE
(JP) JAPAN JUL FINAL PMI MANUFACTURING: 52.1 V 52.2 PRELIM
(KR) SOUTH KOREA JUL PMI MANUFACTURING: 49.1 V 50.1 PRIOR
Speakers and Press
China
(CN) PBOC Assistant Gov: PBOC will ensure smooth, orderly deleveraging - Chinese press
(CN) PBOC has discovered operational violations among 40 Chinese banks and issued business correction orders with a compliance period of up to six months
Korea
(KR) US military detected highly unusual and unprecedented levels of North Korean submarine activity and evidence of an ejection test in the days following recent ICBM launch
Japan
(JP) Japan PM Abe said to be considering former ministers Motegi (trade) and Onodera (defense) for key positions during reshuffle - Japan press
(JP) Japan Chief Cabinet Sec Suga: Confirms Abe to reshuffle cabinet on Aug 3rd
(JP) Japan Fin Min Aso: Next US/Japan economic dialogue meeting is not set; will discuss tariffs on frozen beef imports in talks with US
Other
(PH) Philippine Central Bank Gov Espenilla: Economic expansion is durable and broad based; CPI forecast points to near the midpoint of the 2017-19 range
Asian Equity Indices/Futures (00:00ET)
Nikkei +0.2%, Hang Seng +0.8%, Shanghai Composite +0.4%, ASX200 +0.6%, Kospi +1.0%
Equity Futures: S&P500 +0.2%; Nasdaq +0.4%, Dax +0.2%, FTSE100 +0.3%
FX ranges/Commodities/Fixed Income (00:00ET)
EUR 1.1837-1.1820; JPY 110.43-110.00; AUD 0.8043-0.7997; NZD 0.7525-0.7504
Aug Gold +0.2% at 1,268/oz; Sept Crude Oil +0.2% at $50.27/brl; Sept Copper +0.2% at $2.89/lb
(CN) China PBOC OMO injects CNY170B in 7-day and 14-day reverse repos v CNY240B prior in 7-day
USD/CNY *(CN) PBOC SETS YUAN REFERENCE RATE AT: 6.7148 (strongest setting since Oct 2016) V 6.7283 PRIOR
(CN) China MOF suspends 10-yr bond from trading due to abnormal fluctuations
JGB (JP) Japan MoF sells ¥1.86T v ¥2.3T indicated in 10-yr 0.1% (prior 0.1%) JGBs; Avg yield: 0.073% v 0.079% prior; bid to cover: 4.21x v 4.77x prior
(HK) Overnight Hong Kong dollar interbank rate -43bps to 0.28286%
Equities notable movers
Hong Kong/China
Eve Energy, 300014.CN Reports H1 net CNY232.5M, +161.4% y/y; +4.6%
Shanghai Electric, 2727.HK Gets regulatory approval to buy assets from group via share issue; +1.9%
Japan
Japan Airlines, 9201.JP Reports Q1 Net ¥19.6B v ¥14.7B y/y; Op ¥24.7B v ¥22.1B y/y; Rev ¥314.8B v ¥297.2B y/y; +2.2%
Australia
iSentia Group, ISD.AU Guides FY17 underying EBITDA A$41.5M v A$44Me (prior A$44M); Rev A$155M (prior A$162M); The board has decided to fully write down the value of the King Content business for A$37.08M; -18.9%
Doray Minerals, DRM.AU Announces assay results from drilling at Deflector Gold Copper Mine; +7.7%
Korea
Hyundai Heavy, 009540.KR Reports Q2 (KRW) Net 69.2B v 137.5B y/y; Op 151.7b v 142Be; Rev 4.63T v 4.6Te; +4.3%
Oil Prices Rose To A Two-Month High Of USD 52.92/bbl
Oil Prices Rose To A Two-Month High Of USD 52.92/bbl
Market movers today
Today, the euro area GDP figures for Q2 are due out, and we estimate growth of 0.5% q/q. The solid euro area recovery should have continued in Q2, also reflected in the declining unemployment rate. The growth figure could get more at tent ion than usual amid the ECB's increased focus on the stronger economic growth and less so on the lack of underlying price pressure, as the latter should eventually strengthen when the recovery continues.
In the US, the focus is on the PCE headl ine and core inflation figures for June, which we estimate will be muted. We still think risks are skewed towards the Fed pausing its hiking cycle due to continuing low inflation, which may not be just ‘transitory' as the Fed claims, (see FOMC review – Smidgen dovish but it does not alter the overall picture, 26 July). Markets will also watch out for further insights into the Fed's monetary policy stance, as the Fed's Mester and Williams (both FOMC voting members) will speak today.
Manufacturing PMI data for July is also out for a range of European countries, including the UK, Italy and Spain. In the US, we will get the ISM manufacturing index, which weestimate moderated slightly in July to 55.5 from 57.8, in line with the Markit PMI.
In the Scandies, PMI manufacturing data for July is due out for Sweden and Norway.
Selected market news
Asian shares ticked up this morning, supported by optimism on the global economy ahead of a flurry of data released today. The Dow Jones hit a new record high as investors remained optimistic on US corporate earnings, while the VIX volatility index stood near the record-low levels reached last week. The private Caixin manufacturing PMI published this morning showed conditions in China's manufacturing sector improving further in July, diverging from the fall in the official PMI release yesterday. China has proven more resilient than expected over the past couple of months, but we still look for softer Chinese activity ahead.
Euro area core inflation unexpectedly rose to 1.2% y/y in July and the rising underlying price pressures – although due mainly to volatile components – should be welcome news for the ECB, as it reduces the pressure on rate setters to continue QE at the current pace. Although the initial reaction in EUR/USD was muted, the cross reached a new 2-1/two-year high of 1.1844 in later trading due to month-end port folio adjustments and rising political uncertainty in the US, following the sudden departure of White House communications director Anthony Scaramucci.
After UK ministers gave a range of conflicting views about the Brexit ‘divorce', Prime Minister Theresa May's spokesman clarified on Monday that the free movement of people from the EU will end in March 2019 when Britain leaves the bloc. Reaching an agreement on atransitional deal with the EU that does not include the freedom of movement will be even more difficult for the UK government , and political uncertainty surrounding Brexit remains high.
Oil prices rose to a two-month high of USD 52.92/bbl on Monday, on expectations of US sanctions against Venezuela after Sunday's widely criticised election of a constitutional assembly.
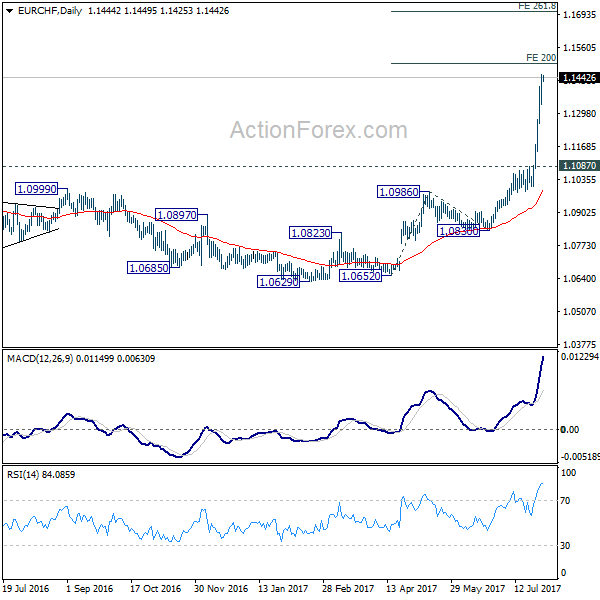
EUR/CHF Daily Outlook
Daily Pivots: (S1) 1.1371; (P) 1.1412; (R1) 1.1490; More...
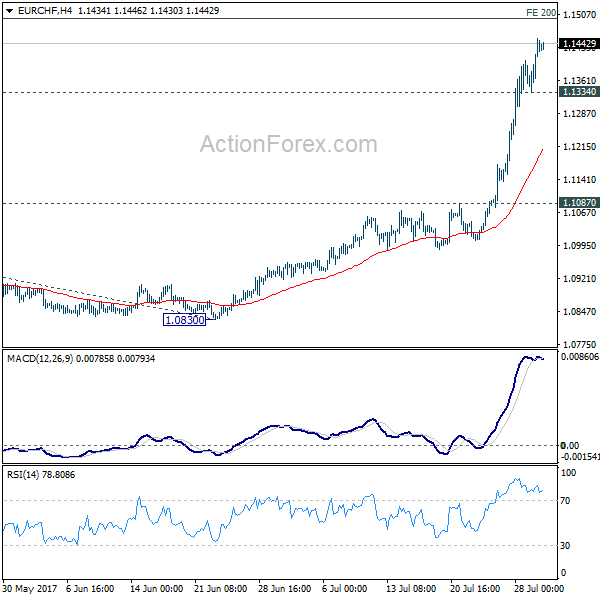
EUR/CHF's rally continues and reaches as high as 1.1454 so far. Intraday bias stays on the upside for 200% projection of 1.0652 to 1.0986 from 1.0830 at 1.1498. Break will target 261.8% projection at 1.1704 next. On the downside, below 1.1334 minor support will turn intraday bias neutral and bring consolidations first, before staging another rise.
In the bigger picture, sustained break of 1.1198 key resistance confirms resumption of the long term rise from SNB spike low back in 2015. In this case, EUR/CHF would eventually head back to prior SNB imposed floor at 1.2000. For now, this will be the favored case as long as 1.1087 resistance turned support holds.
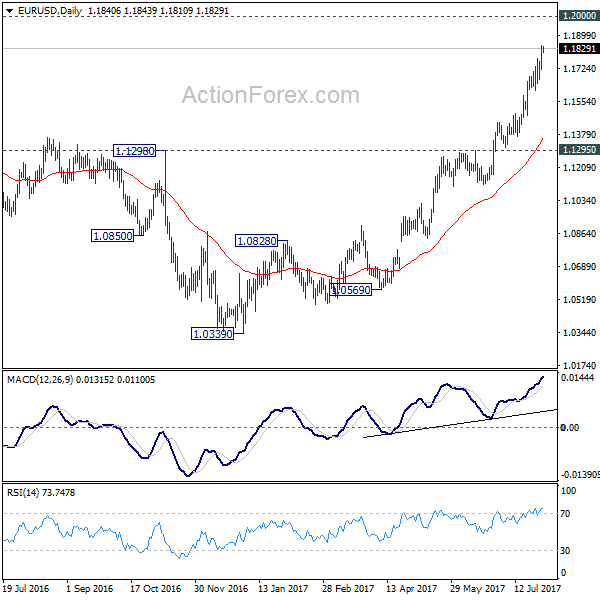
EUR/USD Daily Outlook
Daily Pivots: (S1) 1.1760; (P) 1.1802 (R1) 1.1883; More...
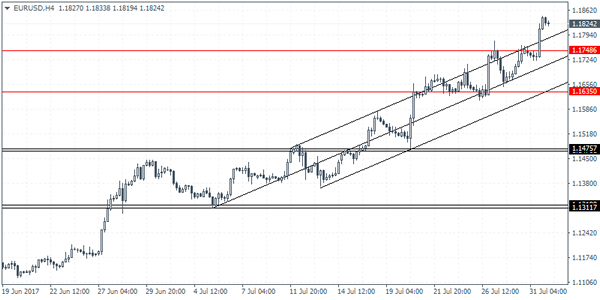
EUR/USD's rally extends to as high as 1.1845 so far. Intraday bias stays on the upside. Current rally from 1.0339 should target 1.2 handle next. On the downside, below 1.1722 minor support will turn intraday bias neutral and bring consolidation before staying another rally.
In the bigger picture, an important bottom was formed at 1.0339 on bullish convergence condition in weekly MACD. Sustained break of 55 month EMA (now at 1.1760) will pave the way to key fibonacci level at 38.2% retracement of 1.6039 (2008 high) to 1.0339 (2017 low) at 1.2516. While rise from 1.0339 is strong, there is no confirmation that it's developing into a long term up trend yet. Hence, we'll be cautious on strong resistance from 1.2516 to limit upside. But for now, medium term outlook will remain bullish as long as 1.1295 support holds, in case of pull back.
GBP/USD Daily Outlook
Daily Pivots: (S1) 1.3129; (P) 1.3176; (R1) 1.3255; More...
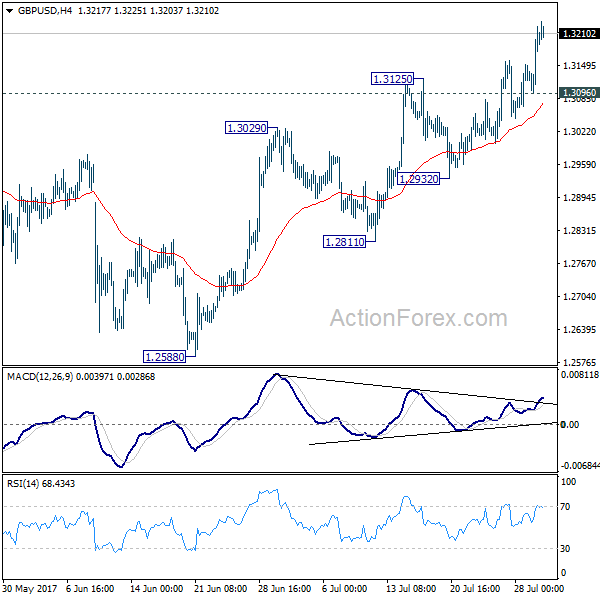
GBP/USD's rally extends further and took out 61.8% projection of 1.2108 to 1.3047 from 1.2588 at 1.3168. There is no sign of topping yet and intraday bias stays on the upside. Further rise would be seen to 1.3444 key resistance. We'll look for topping signal again around there. On the downside, below 1.3096 minor support will turn bias neutral first. Further break of 1.2932 support will indicate reversal and will turn bias to the downside to target 1.2588 key support next.
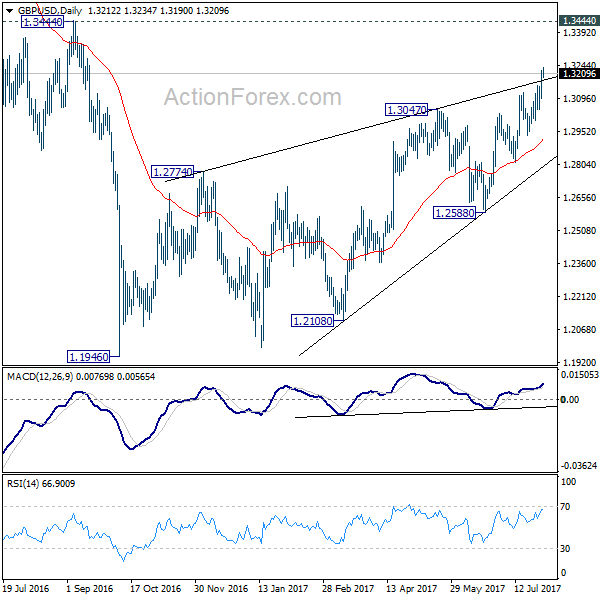
In the bigger picture, overall, price actions from 1.1946 medium term low are seen as a corrective pattern that is still in progress. While further upside is expected, larger outlook remains bearish as long as 1.3444 key resistance holds. Down trend from 1.7190 (2014 high) is expected to resume later after the correction completes. And break of 1.2588 will indicate that such down trend is resuming.