
Sample Category Title
EUR/USD Daily Outlook
Daily Pivots: (S1) 1.1760; (P) 1.1802 (R1) 1.1883; More...
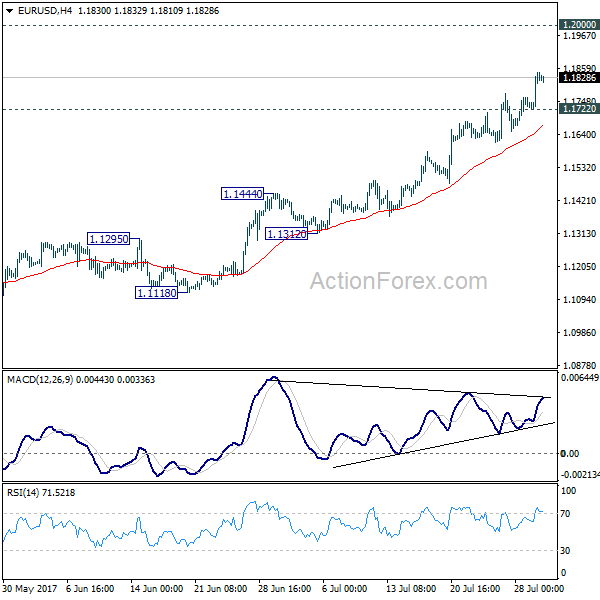
EUR/USD's rally extends to as high as 1.1845 so far. Intraday bias stays on the upside. Current rally from 1.0339 should target 1.2 handle next. On the downside, below 1.1722 minor support will turn intraday bias neutral and bring consolidation before staying another rally.
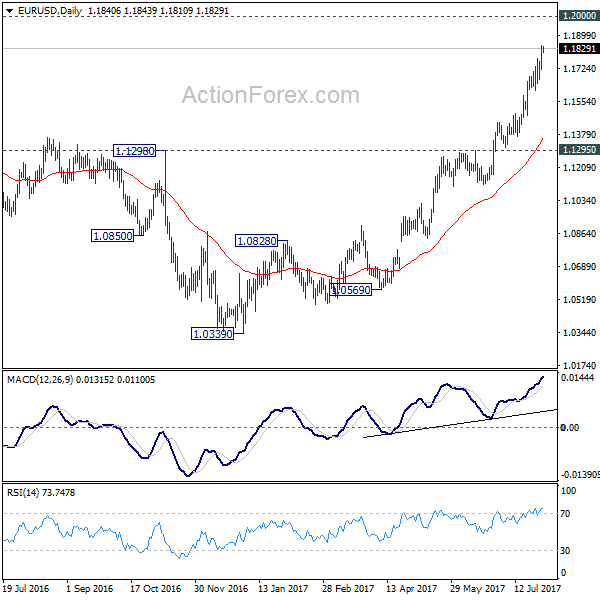
In the bigger picture, an important bottom was formed at 1.0339 on bullish convergence condition in weekly MACD. Sustained break of 55 month EMA (now at 1.1760) will pave the way to key fibonacci level at 38.2% retracement of 1.6039 (2008 high) to 1.0339 (2017 low) at 1.2516. While rise from 1.0339 is strong, there is no confirmation that it's developing into a long term up trend yet. Hence, we'll be cautious on strong resistance from 1.2516 to limit upside. But for now, medium term outlook will remain bullish as long as 1.1295 support holds, in case of pull back.
GBP/USD Daily Outlook
Daily Pivots: (S1) 1.3129; (P) 1.3176; (R1) 1.3255; More...
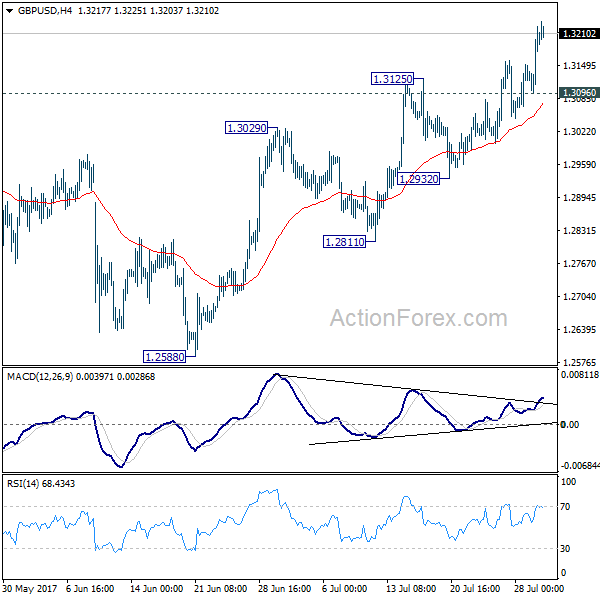
GBP/USD's rally extends further and took out 61.8% projection of 1.2108 to 1.3047 from 1.2588 at 1.3168. There is no sign of topping yet and intraday bias stays on the upside. Further rise would be seen to 1.3444 key resistance. We'll look for topping signal again around there. On the downside, below 1.3096 minor support will turn bias neutral first. Further break of 1.2932 support will indicate reversal and will turn bias to the downside to target 1.2588 key support next.
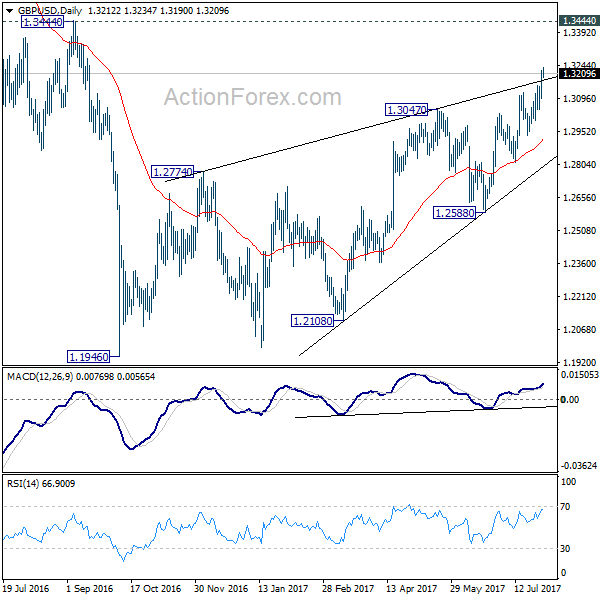
In the bigger picture, overall, price actions from 1.1946 medium term low are seen as a corrective pattern that is still in progress. While further upside is expected, larger outlook remains bearish as long as 1.3444 key resistance holds. Down trend from 1.7190 (2014 high) is expected to resume later after the correction completes. And break of 1.2588 will indicate that such down trend is resuming.
Post RBA Rate Decision
As widely expected no policy change and as equally anticipated the RBA did mention that the exchange rate is providing headwinds on growth, but current price action is the key.
AUDUSD has continued to grind higher all session pushed on by stronger than expected China Caixin PMI that has commodities looking buoyant. While the USD weakness has been driving the commodity bloc ship of late, it now looks like commodity prices themselves are providing another thorn in the RBA’s side who have been leaning against the current Australian dollar ramp. But with little follow through after both Debelle and Lowe jawboning the currency last week, there was a high chance for the RBA to disappoint the doves, and price action suggests this
Despite holding in neutral gear, on the whole, the statement was balanced, and we could see A $ extension fueled by a weaker US dollar, surging iron ore prices and RBA soft shoe approach.
The RBA continues to point out concerns regarding low wage growth and labour under-utilisation, combined with recent more delicate CPI print, so it’s unlikely the RBA will withdraw monetary stimulus this year, but this alone is not enough to shift the current tidal wave of A$ demand
The immediate reaction was to see a fall from around 0.8020 to 0.7995 . We have since come back 0.8020 +
Daily Technical Analysis: EURUSD, GBPUSD, USDJPY, USDCHF
EURUSD
As expected, the EURUSD broke above the 'mother bar' yesterday as you can see on my daily chart below, topped at 1.1845. The bias remains bullish in nearest term testing 1.1875 before targeting 1.2000 key resistance. Immediate support is seen around 1.1775. A clear break below that area could lead price to neutral zone in nearest term testing 1.1725 support area but overall I remain bullish and any downside pullback should be seen as a good opportunity to buy and only a clear break below 1.1650 would interrupt the bullish outlook.
GBPUSD
The GBPUSD continued its bullish momentum yesterday topped at 1.3223. The bias remains bullish in nearest term testing 1.3300/50 region. Immediate support is seen around 1.3160. A clear break below that area could lead price to neutral zone in nearest term testing 1.3125 – 1.3075 area which is a good place to buy. On the upside, a clear break and daily close above 1.3350 would expose 1.3500 region. Overall I remain bullish and only a clear break back below 1.3000 key support would interrupt the bullish outlook.
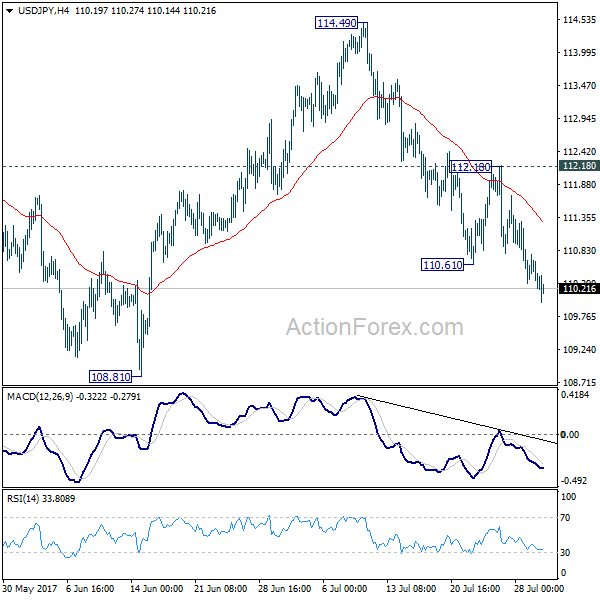
USDJPY
The USDJPY had a bearish momentum yesterday bottomed at 110.21 and hit 110.00 earlier today in Asian session. The bias remains bearish in nearest term testing a trend line support as you can see on my daily chart below, located around 109.00/50 area which is a good place to buy with a tight stop loss. Immediate resistance is seen around 110.80. A clear break above that area could lead price to neutral zone in nearest term as direction would become unclear. On the downside, a clear break below the trend line support and 109.50/00 would activate my bearish mode.
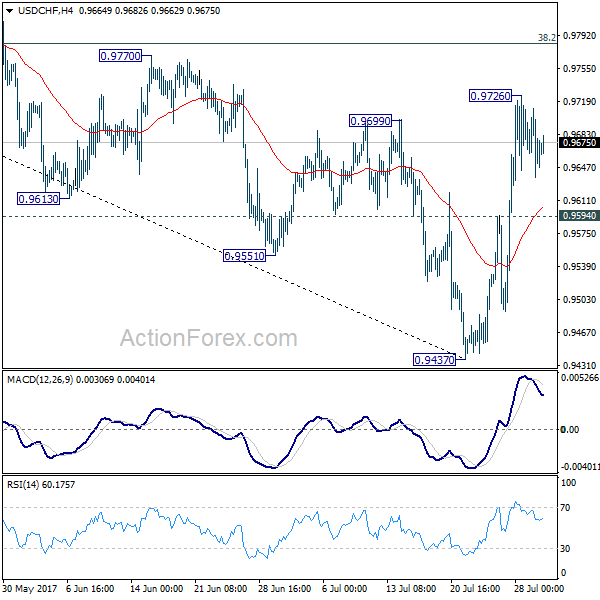
USDCHF
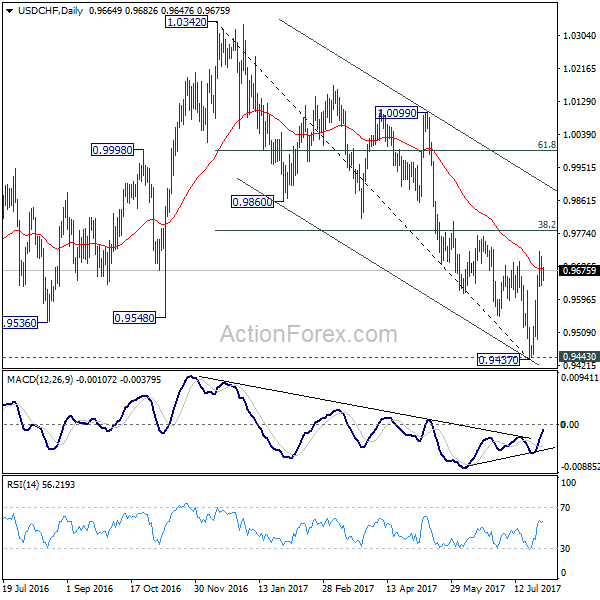
The USDCHF was indecisive yesterday. The bias is neutral in nearest term. Overall price is still in a bullish phase since bounced-off 0.9450 key support but unable to make a clear break above 0.9700 resistance so far as you can see on my daily chart below. Immediate support is seen around 0.9620. A clear break and daily close below that area could trigger further bearish pressure testing 0.9550 region but key support remains at 0.9450. On the upside, a clear break above 0.9700 would expose 0.9765 – 0.9807 key resistance area which remains a good place to sell.
USD/CHF Daily Outlook
Daily Pivots: (S1) 0.9632; (P) 0.9672; (R1) 0.9708; More...
A temporary top is in place at 0.9726 and intraday bias in USD/CHF is turned neutral first. Another rise is expected as long as 0.9594 support holds. Prior break of 0.9699 resistance suggests near term reversal after defending 0.9443 key support. Above 0.9726 will target 38.2% retracement of 1.0342 to 0.9437 at 0.9783 first. Break will target channel resistance (now at 0.9899). However, firm break of 0.9594 will dampen this bullish view and turn bias back to the downside for 0.9437.
In the bigger picture, current development argues that USD/CHF has successfully defended 0.9443 key support level. And long term range trading in 0.9443/1.0342 is extending with another rise. At this point, there is no sign of an up trend yet. Hence, while further rise is expected in USD/CHF, we'll start to be cautious on loss of momentum above 61.8% retracement of 1.0342 to 0.9437 at 0.9996.
Daily Technical Analysis: EUR/USD Breaks 1.0750 Resistance And Continues Bullish Impulse
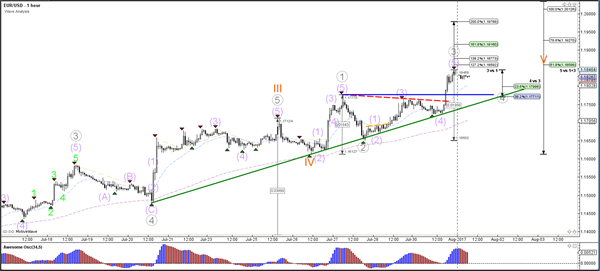
Currency pair EUR/USD
The EUR/USD continued with the uptrend as expected in yesterday's analysis. The bullish breakout above the resistance trend line (dotted red) saw price move towards the 61.8% Fibonacci target. Price could potentially extend the bullish momentum towards the 1.1925 and even 1.20 when considering the strong bullish breakout candle on the 4 hour chart.
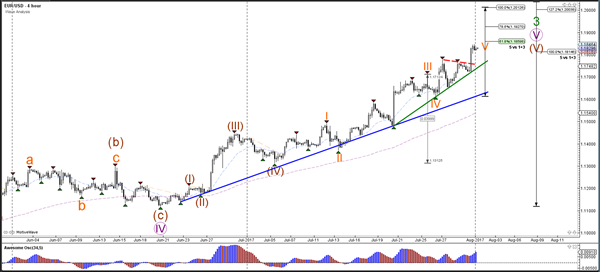
The EUR/USD is most likely building a wave 3 (grey) momentum which might not yet be completed. A bullish continuation could see price move towards the 161.8% Fibonacci target of wave 3 vs 1 for instance. Once wave 3 is completed, then a wave 4 (grey) retracement is expected to take place.
Currency pair USD/JPY
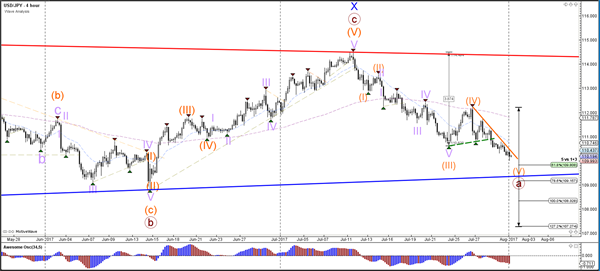
The USD/JPY downtrend indeed reached the 110 target as mentioned in yesterday's analysis. The round level could act as support and cause a retracement or even a potential reversal. Eventually a larger support trend line (blue) could be the end target of the bearish wave 5 (orange) at 109.50.
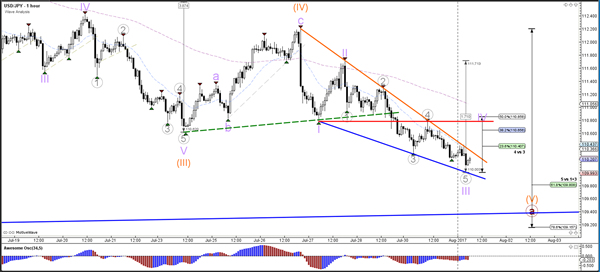
The USD/JPY indeed completed a wave 4 (grey) retracement and continued lower within wave 5 (grey). The slower bearish momentum is causing a falling wedge chart pattern (orange/blue), which could lead to a bullish retracement. The pullback could be part of a wave 4 (purple) within the 5th wave (orange).
Currency pair GBP/USD
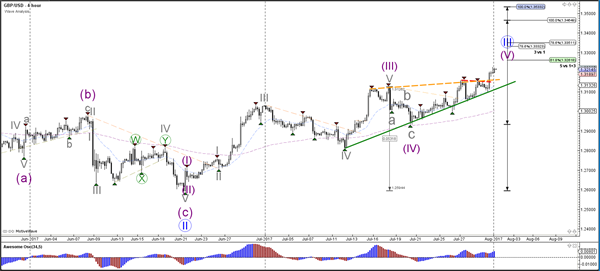
The GBP/USD broke the rising wedge chart pattern to the upside. The bullish break above resistance (dotted lines) indicates a continuation of the wave 5 (purple). Whether the wave 3 (blue) will indeed be confirmed depends on how far the GBP/USD will move. A failure to break above the 100% Fibonacci target could indicate an ABC rather than a 123.
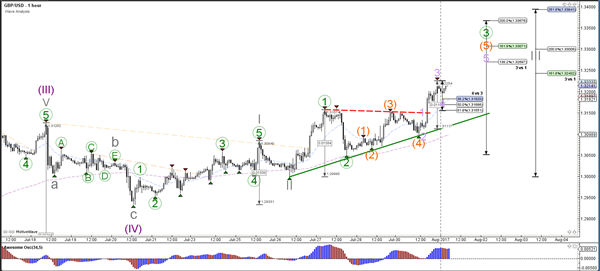
The GBP/USD could be building an extension of the wave 3 (green) with 5 internal waves (orange/purple). A pullback could be part of the wave 4 (purple) which means that the Fibonacci levels of wave 4 vs 3 could act as support.
USD/JPY Daily Outlook
Daily Pivots: (S1) 110.36; (P) 110.84; (R1) 111.14; More...
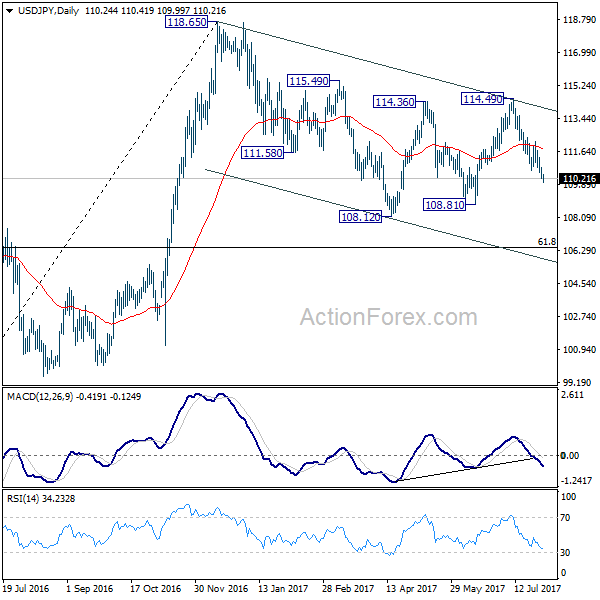
USD/JPY's fall is still in progress and reaches as low as 109.99 so far. Intraday bias remains on the downside for 108.81 support first. Break there will resume whole correction from 118.65 and target 61.8% retracement of 98.97 to 118.65 at 106.48. Nonetheless, break of 112.18 resistance will dampen this bearish view and turn focus back to 114.49 resistance instead.
In the bigger picture, the corrective structure of the fall from 118.65 suggests that rise from 98.97 is not completed yet. Break of 118.65 will target a test on 125.85 high. At this point, it's uncertain whether rise from 98.97 is resuming the long term up trend from 75.56, or it's a leg in the consolidation from 125.85. Hence, we'll be cautious on topping as it approaches 125.85. If fall from 118.65 extends lower, down side should be contained by 61.8% retracement of 98.97 to 118.65 at 106.48 and bring rebound.
USD/CAD Daily Outlook
Daily Pivots: (S1) 1.2426; (P) 1.2477; (R1) 1.2528; More....
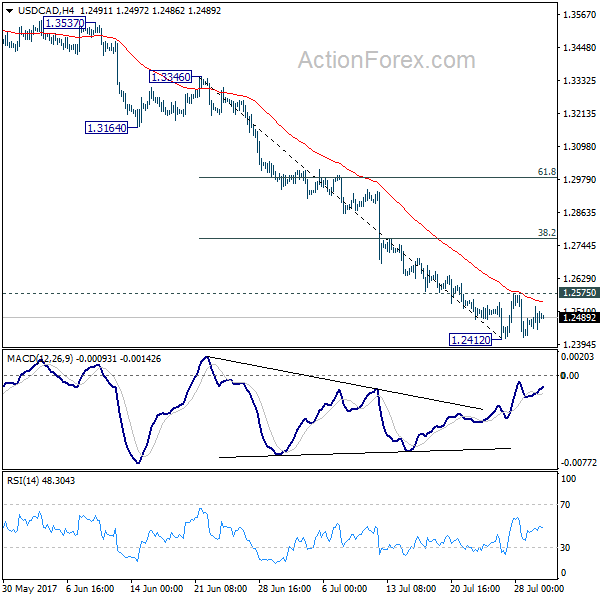
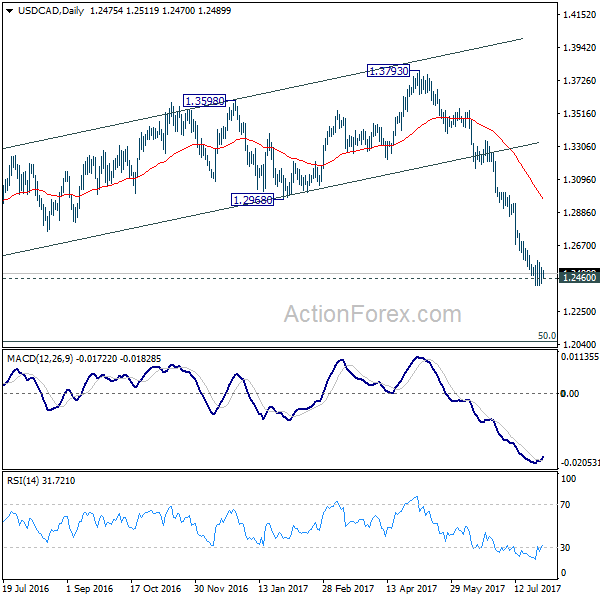
USD/CAD is staying in consolidation above 1.2412 and intraday bias remains neutral first. On the upside, above 1.2575 minor resistance will extend the rebound from 1.2412 and target 38.2% retracement of 1.3346 to 1.2412 at 1.2769. On the downside, break of 1.2412 will extend recent fall from 1.3793 to next key fibonacci level at 1.2048.
In the bigger picture, price actions from 1.4689 medium term top are seen as a correction pattern. Fall from 1.3793 is seen as the third leg and should target 50% retracement of 0.9406 to 1.4869 at 1.2048. At this point, we'd look for strong support from there to contain downside and bring rebound. However, firm break there will target 100% projection of 1.4689 to 1.2460 from 1.3793 at 1.1564.
RBA Reiterate Currency Concerns Whilst Avoiding A Classic Jawbone
It's well known that a higher exchange rate is a headache for the RBA, so AUD's break of 80c made this a core focus of today's statement.
The higher AUD was clearly attributed to a weaker USD, yet as this issue is out of their hands they may not fancy their chances of turning the tide with a direct jawbone. Guy Debelle provided a minor retracement in a speech recently, only to AUD remain elevated. So, for today's statement I'd have expected their wording to be more direct if they thought they could change this trend. Yet instead it merely outlines the headwinds a higher AUD brings to their output and forecasts, making today's exchange rate commentary more of an attempt to manage expectations over a classic jawbone.
Summary of RBA's August 2017 statement
- The Board decided to leave the cash rate unchanged at 1.50 per cent
- central forecast is for the economy to grow at an annual rate of around 3 per cent
- Slow growth in real wages and high levels of household debt are likely to constrain growth in spending
- Forward-looking indicators point to continued growth in employment
- Inflation is expected to pick up gradually
- The higher exchange rate is expected to contribute to subdued price pressures
- It is also weighing on the outlook for output and employment. An appreciating exchange rate would be expected to result in a slower pick-up in economic activity and inflation than currently forecast
- Rent increases remain low in most cities
- Investors in residential property are facing higher interest rates
- The low level of interest rates is continuing to support the Australian economy
Earlier in the session, manufacturing PMI expanded for a 10th straight month in July and sots at a 3-month high of 56. The 1yr average trend continues to point higher although this month it has flattened off at 54.2. This is the 5th month above the 1yr average to show continued support for growth from the sector. New orders declined -3.7pts on the month and sits at a 6-month low of 558.8. The 1yr average is 57.2. which suggests potential headwinds ahead later in the year of orders do not pick up pace.
Trade data will be on focus tomorrow to see if exports can sustain the 9% annual rate seen last month. The trade balance has remained in surplus for 6 months which shows AUD is in demand by the rest of the world.
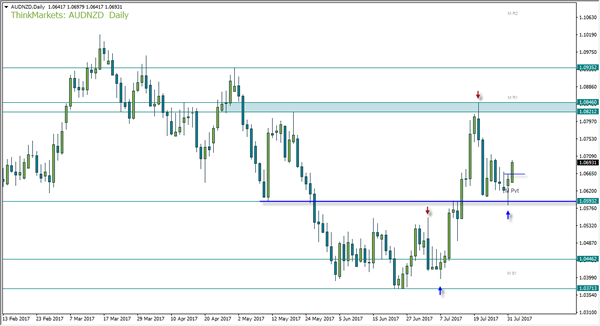
AUDNZD may have formed a swing low with a bullish hammer above 1.0593 support. As we have broken yesterday's high and now also above the monthly pivot, we have greater confidence in the hammer's low holding as support. As price action on AUDNZD cab be choppy and often provides overlapping candles, it is a pair which suits the use of limit orders for set-and-forget trades very well. We could consider using yesterday's high to aid with trade entry (to enter long upon a retracement) or somewhere around the monthly pivot.
Assuming this is part of a 5-wave rally and we are now in the 5th wave, this also assumes it will break to a new high. We remain reserved on that outcome as, ideally, we would not have such a large overlap between the hammer low and the end of wave-2. So, for now we aim to exit before we get to the highs, unless momentum is strong in which case we can revise the target higher as price action unfolds.
Global PMIs Soften As Europe Leads The Way | CESI Rebounds Without The Dollar
It is the start of a new month, which means we'll now see a host of soft business surveys for the globe which provide a preview of growth potential further into the year.
Manufacturing PMI expanded for a 10th straight month in July and sots at a 3-month high of 56. The 1yr average trend continues to point higher although this month it has flattened off at 54.2. This is the 5th month above the 1yr average to show continued support for growth from the sector. New orders declined -3.7pts on the month and sits at a 6-month low of 558.8. The 1yr average is 57.2. which suggests potential headwinds ahead later in the year of orders do not pick up pace.
Input prices rose to a 3-month high of 69.3 and tracks the Melbourne monthly CPI higher (currently 2.7% annually). Average wages declined for a 2nd consecutive month which brings the index down to 55.7 from 60.4, placing it firmly below the 1yr average at 58.3.
Chinas manufacturing PMI's have picked up slightly, although the story of two tales continues between the NBS and manufacturing read. NBS (National Bureau of Statistics) is government related and uses a smaller ample size of the largest companies, which often provides a rosier outlook for China when compared with the Markit PMI. The latter, which is privately run company, also includes small to medium sized companies and uses a larger sample size. Therefore, when we compare PMI's we use Markit data to keep a consistency among the countries involved.
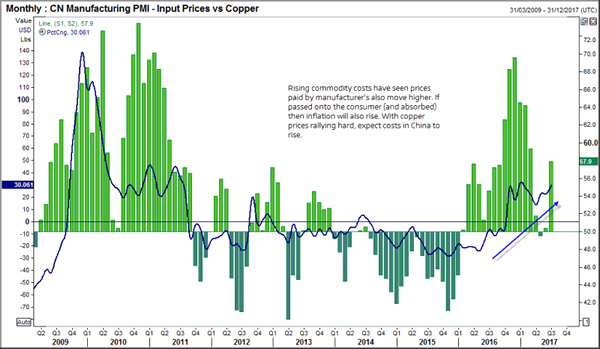
Still, the NBS reads has its use as the internal reads do provide a look inflationary forces. Input costs have risen sharply due to higher commodities but an important commodity to follow for China and global growth and inflation is copper.
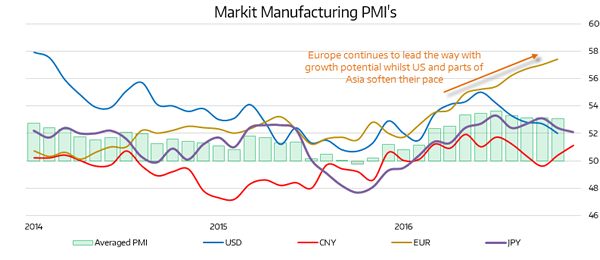
Apart from Europe, the developed world seems to be falling behind with their rate of manufacturing PMI expansions. Whilst China's manufacturing PMI has recovered after a blip below 50 the rate of expansion remains sanguine. Japan's PMI continues to expand but at 52 and pointing gently lower, it hardly sets the world alight. And US Markit PMI provides a similar tale, only this time the top is more prominent in Q1 and has since pointed steadily lower. This is an important point because PMI data tends to lead GDP growth by 6-12 months, so if it has softened since the end of Q1, it paints a weak growth story around end of Q3 to early 2018. We have taken the average of all four which suggests it topped in May, which in turn means global growth is likely to stutter in Q4 – Q2 '18. ISM PMI data is out tonight and this has painted a better picture for the US but for a fairer comparison, we used Markit PMIs for consistency.
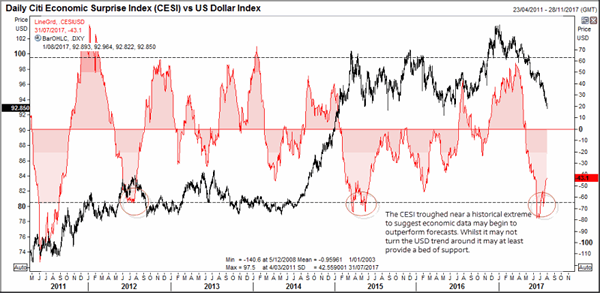
Whilst the USD breaks support levels with ease, we wonder if it is now approaching a sentiment extreme and in need of a reprieve. A clue may be within the CESI (City Economic Surprise index). We highlighted in June how the CESI had moved to levels usually associated with a turnaround. The further negative the index sits the worse economic data performs in relation to consensus. It has now bounced back within -1.5 standard deviation to show it isn't underperforming as badly as it once and may try to move higher form here. The correlation between the index and the US Dollar is not a simple or even that reliable over the longer-term. Yet we can use it to assess sentiment and urge caution from being too bearish on USD now as it sits above key support (2016 low) and every man and his dog is now short the USD.