Sample Category Title
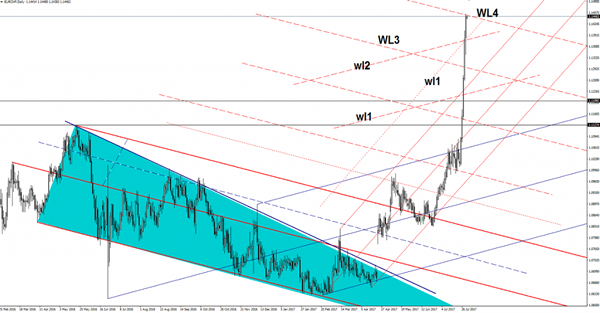
EUR/CHF Bullish Until Sellers Appear
EUR/CHF extends the amazing rally, has managed to climb above the 1.1450 level on Monday, much above the 1.1405 last week’s high. Price dropped in the fresh start of the week, but the buyers are still in the game and have forced the rate to breakout above the confluence area formed between the wl2 and the wl1.
You can see that has reached another upside target (WL4), a valid breakout above the fourth warning line (WL4) will confirm a further increase.
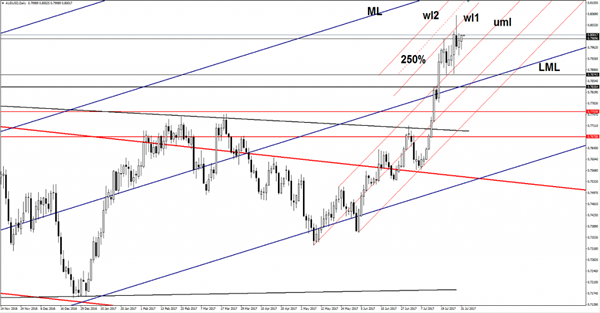
AUD/USD Rallying Ahead RBA
Price increased on Monday and resumed the Friday’s bullish candle, it is expected to climb much higher because is trading in the buyer’s territory. AUD/USD moves higher as the USDX dropped sharply again after the United States data was sent to the public. The US figures have come in mixed, but weren’t able to inspire the greenback.
USDX is trading much below the 93.00 psychological level and is expected to reach the 92.49 long term static obstacle, where he could find support again.
Price could be driven by the fundamental factors today because the economic calendar is filled with high impact data, the Reserve Bank of Australia will publish the Cash Rate, which is expected to remain steady at 1.50%. The Cash Rate remains unchanged since August 2016, maybe the RBA Rate Statement will bring a high volatility, so you should be careful. The AIG Manufacturing Index will be released as well later.
The perspective is bullish on the daily chart, the greenback could increase a little only if the United States data will come in better in the afternoon. Another disappointment will ruin the USD, which will resume the bearish momentum.
Price has managed to come back above the 0.7989 static resistance, a minor consolidation will bring a good buying opportunity with a first upside target at 0.8065 previous high. AUD/USD should increase further as long as the upper median line (uml) remains intact.
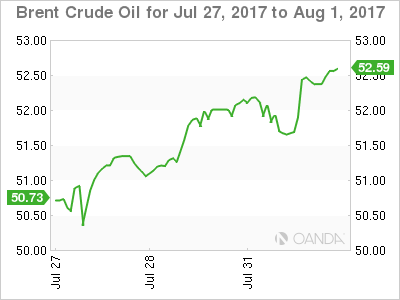
Sanctions Lite Boosts Oil But Beware The Russian Bear
The U.S announces a sanctions 'lite' package on Venezuela fueling further rallies in crude, but deteriorating relations with Russia could have a larger downstream effect.
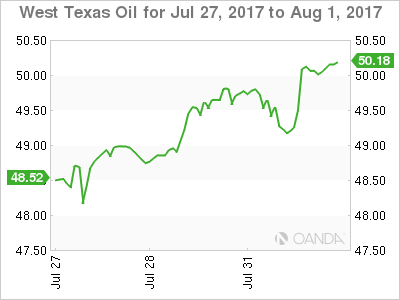
Another storming rally overnight from both oil contracts with the highlight being WTI nudging above the magical 50.00 a barrel level. Both contracts fell one percent initially before charging higher by some two percent to close in New York near their highs. More significantly from a technical perspective, both contracts tested and held their respective 100-day moving averages on the initial pullback suggesting the rally still has plenty of legs.
The main event was the U.S. Governments announcement of sanctions on Venezuela. Admittedly they were a sanctions 'lite' package, only targeting President Maduro's assets in the U.S. or under U.S. supervision. The implicit threat though is that the level of sanctions can be ratcheted up from this low level. This shot across the bows rather than a full tactical strike kept oil bid during the latter half of the session.
Traders, however, should keep an eye on the deteriorating relationship between Russia and the United States. With new sanctions pending from Washington, this has the potential to cause much more immediate supply disruptions, most especially in the Natural Gas market. The sanctions themselves will most likely draw Europe into the mire as well and could be quite supportive to the Brent contract. Already the premium over WTI is at six-month highs.
Tonight we will receive the first crude inventory numbers from the U.S. for the week in the form of the American Petroleum Institute's figures. The street will be looking for evidence of the continued trend of inventory drawdowns, and the street seems to have an itchy trigger finger to buy crude should the numbers stay on target.
Brent spot trades at 52.50 in early Asia with crucial support at 51.40, the 100-day moving average. The overnight price action formed a double top at 52.70, just above present levels, and a break could set the scene for further technical gains above the May highs around 54.00.
WTI spot trades at 50.15 with the 49.00/49.15 region the key short-term support. It contains the overnight low and the 100-day moving average. The overnight high just above at 50.25 is initial resistance. A break of this level opens a test of the May highs at 51.70.
Shambolic US Administration
Shambolic US Administration
The Washington political train wreck and month end flow has left the US dollar teetering on the brink of a cliff. After struggling through a torturous time last week, and just when it appeared the USD onslaught had abated, the dollar bulls were swallowed up by the expanding “DMV” political sinkhole.And while month end portfolio flows were not as unruly as they can usually be, USD sellers were coming out of the woodwork and could be found in every corner of the market.
However, we are entering a data-laden week for the USD, and we should expect this to come into trading decisions.With currencies trading at multi year highs will acrophobia set in before US payrolls? Since a good portion of the overnight dollar swoon was inspired on the back of month end portfolio adjustment, it's difficult to envision more dollar selling ahead of the US economic data.
But the troublesome political headlines continue to weigh on sentiment, and while the removal of a White House communications director is hardly market moving fodder, it does point to growing instability in the Trump administration where Senior White House official continue to have very short shelf lives. Add in the US government's diplomatic fracas with Russia and the confusing narrative over North Korea, political tensions in Washington remain on a rolling boil
The RBA rate decision is the primary regional focus today. Last week Governor Lowe and Deputy Governor Debelle leaned against the view that interest rates in Australia will track other G-10 central bankers policy normalisation. However, the post rate decision statement does not offer this latitude and given the economic pick up in Australia it's highly unlikely the RBA will downgrade their economic assessment and move off their neutral policy stance. .
EURO
Expect a range trade day in APAC as the market awaits PMI data across Europe and the US PCE prints. But we should expect the market is to lighten up long EUR positions at current levels given the month end USD selling influence but maintain a stronger EURO bias while in buying the dip mode.
Japanese Yen
USDJPY continues to trade heavy on the back of a weaker dollar. With North Korea and shambolic US administration headlines filling the airwaves, topside moves will be limited.
Aussie dollar
Wait and see mode ahead of the RBA policy decision but it remains a US dollar story line on the back of a dovish Fed outlook.
USD/CAD Canadian Dollar Lower As Producer Prices Fall
The Canadian dollar depreciated on Monday. The loonie started the week on the back foot as raw material and producer prices disappointed with a 3.7 percent and 1.0 percent contractions. Lower energy prices had a negative impact on both indices and will continue to raise question marks if the Bank of Canada (BoC) decides to raise interest rates in October. The CAD has rallied against the USD after a quick turn from neutral to hawk by the Canadian central bank. The July interest rate hike came about after the BoC signalled markets mid June. The bank of expected to follow through in October to leave the benchmark rate at 1.00 percent, the same level that before the two proactive rate cuts in 2015.
The USD is mixed as political drama continues to impair the currency. The reshuffle of the communications team of the Trump Administration ahead of important policy reform pushes and the NAFTA renegotiation talks has boosted the EUR, JPY and CHF against the dollar.
Profit taking and uncertainty around the US possible sanctions to Venezuela have put a stop to the crude rally from last week. Crude ended higher after another weekly drawdown of US crude inventories. Report from US producers of cutting back on capital expenses will limit the pace of rig count growth and could give an advantage to the Organization of the Petroleum Exporting Countries (OPEC) oil cuts that were agreed with other major producers.
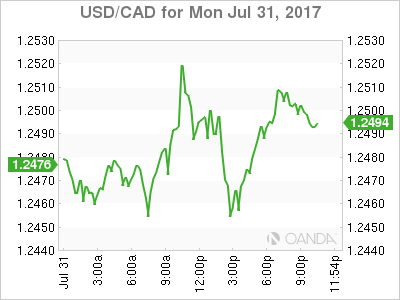
The USD/CAD gained 0.412 in the last 24 hours. The currency is trading at 1.2485 after disappointing raw materials and producer prices. Inflation has remained weak even as the economy is on a stronger pace of growth as evidenced by the gross domestic product (GDP) numbers released last week. The Canadian dollar appreciated versus the US dollar on Friday after the GDP in May tripled forecasts. The rebound in oil production put Canadian growth at 0.6 percent beating a forecast of 0.2 percent. Annual growth is 4.6 percent, the fastest since the year 2000.
The loss of momentum of oil prices at the start of the week also put the loonie rally on hold. Weekly inventories in the US have been the main driver and again the American Petroleum Institute (API) and the Energy Information Administration (EIA) releases on Tuesday afternoon and Wednesday will be important in determining crude prices. The high correlation between the Canadian dollar and energy prices is well known and while it has decreased following the efforts to diversify the economy by the government and the central bank it remains an important sector of the economy.
Canadian and American employment data will be a big draw for investors this week. The U.S. non farm payrolls (NFP) could mark a reversal for the USD as once again employment comes to the rescue of the dollar. Low wage growth could reduce the impact of another big headline jobs gain as the Fed grapples with higher monetary policy in a low inflation environment.
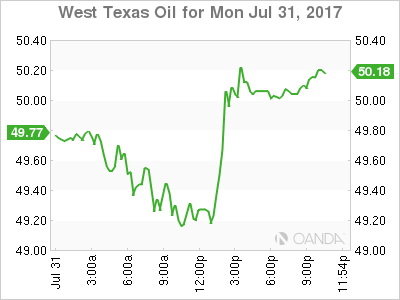
Oil lost 0.854 percent on Monday. The price of West Texas Intermediate is trading at $49.32 after profit taking slowed down the black stuff. Last week’s meeting of the Organization of the Petroleum Exporting Countries (OPEC) and other members in Russia reenergized the impact of the production cut agreement. Saudi Arabia pledge to cut even further and emphasized a hardening of compliance vigilance for producers. The political situation in Venezuela could lead to sanctions by the biggest market for their oil, the United States.
The middle of the week inventory releases have been the drivers of oil prices of late. The US rig count has slowed down as producers are rethinking their investments with oil prices range bound. Larger than expected drawdowns have pushed crude to two month highs and is now back to where it was back in May.
Market events to watch this week:
Tuesday, August 1
12:30 am AUD Cash Rate
12:30 am AUD RBA Rate Statement
4:30 am GBP Manufacturing PMI
10:00 am USD ISM Manufacturing PMI
6:45 pm NZD Employment Change q/q
Wednesday, August 2
4:30 am GBP Construction PMI
8:15 am USD ADP Non-Farm Employment Change
10:30 am USD Crude Oil Inventories
9:30pm AUD Trade Balance
Thursday, August 3
4:30 am GBP Services PMI
7:00 am GBP BOE Inflation Report
7:00 am GBP MPC Official Bank Rate Votes
7:00 am GBP Monetary Policy Summary
7:00 am GBP Official Bank Rate
7:30 am GBP BOE Gov Carney Speaks
8:30 am USD Unemployment Claims
10:00 am USD ISM Non-Manufacturing PMI
9:30 pm AUD RBA Monetary Policy Statement
9:30 pm AUD Retail Sales m/m
Friday, August 4
8:30 am CAD Employment Change
8:30 am CAD Trade Balance
8:30 am USD Average Hourly Earnings m/m
8:30 am USD Non-Farm Employment Change
Gold Shrugs Off Strong Housing Report
Gold is showing limited movement at the start of the week. In North American trade, spot gold is trading at $1268.50, down 0.08% on the day. On the release front, Pending Home Sales posted a gain of 1.6% in June, beating the forecast of 0.9%. On Tuesday, the US publishes Personal Spending and the ISM Manufacturing PMI.
US Advance GDP impressed in the second quarter with a strong gain of 2.6%, beating the estimate of 2.5%. The economy was boosted by strong consumer spending and business investment, as fears of a second straight quarter of weak growth proved unfounded. Still, inflation remains weak, and wage growth fell in Q2 despite a robust labor market and unemployment at just 4.4%. Investors are skeptical that the Fed will press the rate trigger in December due to low inflation. The odds of a December increase are at 42%, compared to 50% a month ago, according to the CME Group.
The US dollar has posted broad losses in response to climbing political risk in the US, and investors have snapped up gold, a traditional safe haven asset, in response. Gold has reeled off three consecutive weekly gains. There was more angst for the White House on Friday, as President Trump's struggling healthcare bill gasped its final breath as the bill was defeated in the Senate after three Republican lawmakers joined the Democrats and voted against the bill. This is another setback for President Trump, who has been unable to get Congress to pass any significant legislation, despite the Republicans controlling both the House and the Senate. Trump will now be able to focus on other issues such as tax reform, but investors are skeptical as to whether the President will have the support he needs in Congress to pass major legislation.
Elliott Wave Trade Ideas Performance Update
1 position was entered last week with total loss of 60 points and the positions are listed below.
26 Jul: GBP/JPY - Short at 145.90, exited at 146.50 (- 60 points)
| AUD EUR/JPY EUR/GBP CAD GBP GBPJPY
Jan - 15 -275 - 35 -120
Feb + 140 -17 - 40 +11
Mar - 20 +115 +132 - 19
Apr + 30 - 40 +120 + 45
May - 55 +100 - 6 -65 -60
Jun + 81 +150 - 10 +185 -120 +205
Jul - 40 - 60
Aug
Sep
Oct
Nov
Dec
Y-T-D + 216 - 82 +67 +463 -185 +130
Pound Higher, Markets Eye UK Manufacturing PMI
GBP/USD has posted slight gains in Monday trade. In the North American session, the pair is trading at 1.3181, up 0.34% on the day. On the release front, British Net Lending to Individuals climbed to GBP 5.6 billion in June, above the estimate of GBP 4.9 billion. This was the highest reading since March 2016. In the US, Pending Home Sales posted a gain of 1.6% in June, beating the forecast of 0.9%. On Tuesday, the UK releases Manufacturing PMI, and the US publishes Personal Spending and the ISM Manufacturing PMI.
US Advance GDP impressed in the second quarter with a strong gain of 2.6%, beating the estimate of 2.5%. The economy was boosted by strong consumer spending and business investment, as fears of a second straight quarter of weak growth proved unfounded. Still, inflation remains weak, and wage growth fell in Q2 despite a robust labor market and unemployment at just 4.4%. Investors are skeptical that the Fed will press the rate trigger in December due to low inflation. The odds of a December increase are at 42%, compared to 50% a month ago, according to the CME Group.
The US dollar has posted broad losses in response to climbing political risk in the US, and the pound has taken full advantage. GBP/USD has touched the 1.32 line on Monday, for the first time since September 2016. There was more bad news for the White House on Friday, as President Trump's struggling healthcare bill gasped its final breath as the bill was defeated in the Senate after three Republican lawmakers joined the Democrats and voted against the bill. This is another setback for President Trump, who has been unable to get Congress to pass any significant legislation, despite the Republicans controlling both the House and the Senate. Trump will now be able to focus on other issues such as tax reform, but investors are skeptical as to whether the President will have the support he needs in Congress to pass major legislation.
Candlesticks and Ichimoku Trade Ideas Performance Update
6 positions were entered among all 4 currency pairs with total profit of 85 points and the positions are listed below:
25 Jul: USD/JPY - Short at 111.45, exited at 111.35 (+ 10 points)
26 Jul: USD/JPY - Short at 112.00, exited at 111.90 (+ 10 points)
26 Jul: USD/CHF- Short at 0.9570, exited at 0.9570 ( 0 point)
27 Jul: EUR/USD - Short at 1.1680, exited at 1.1715 (- 35 points)
27 Jul: USD/JPY - Short at 111.45, exited at 110.45 (+ 100 points)
27 Jul: GBP/USD - Long at 1.3085, exited at 1.3085 ( 0 point)
| JPY EUR CHF GBP
Jan + 167 - 85 - 10 + 50
Feb + 200 +150 +93 - 59
Mar -23 -70 -23 - 35
Apr + 65 + 93 + 50 - 40
May - 65 - 35 + 100 -175
Jun -100 -10 - 10 +175
Jul + 85 - 35 - 8
Aug
Sep
Oct
Nov
Dec
Y-T-D + 328 + 3 +192 - 74
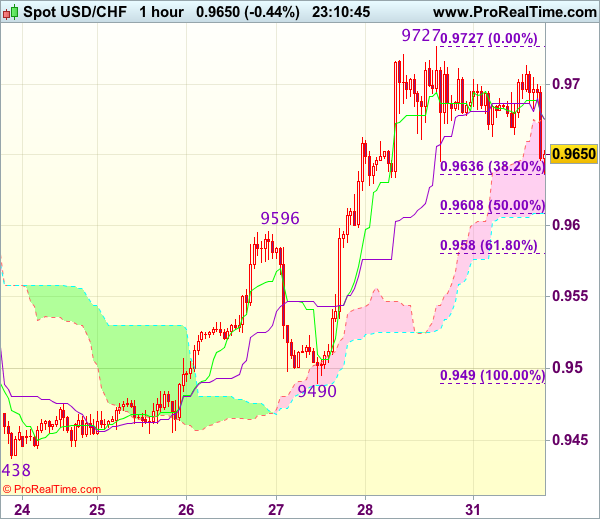
Trade Idea Wrap-up: USD/CHF – Buy at 0.9600
USD/CHF - 0.9666
Most recent candlesticks pattern : N/A
Trend : Near term up
Tenkan-Sen level : 0.9675
Kijun-Sen level : 0.9675
Ichimoku cloud top : 0.9675
Ichimoku cloud bottom : 0.9609
Original strategy :
Buy at 0.9600, Target: 0.9700, Stop: 0.9565
Position : -
Target : -
Stop : -
New strategy :
Buy at 0.9600, Target: 0.9700, Stop: 0.9565
Position : -
Target : -
Stop : -
As the greenback has retreated after faltering below last week’s high at 0.9727, retaining our view that further consolidation below this level would be seen and initial downside risk remains for pullback to 0.9635 (38.2% Fibonacci retracement of 0.9490-0.9727), however, previous resistance at 0.9596 should turn into support and contain downside, bring another rise later, above said resistance at 0.9727 would extend recent rise to 0.9750-60, then 0.9780 but reckon 0.9800 would hold from here.
In view of this, would not chase this rise here and would be prudent to buy dollar on further pullback as previous resistance at 0.9596 should turn into support and contain dollar’s downside. Below 0.9580 (61.8% Fibonacci retracement of 0.9490-0.9727) would defer and suggest a temporary top is formed instead, bring correction to 0.9540-50 but price should stay well above support at 0.9490, bring another rise later.