Sample Category Title
Candlesticks and Ichimoku Trade Ideas Performance Update
6 positions were entered among all 4 currency pairs with total profit of 85 points and the positions are listed below:
25 Jul: USD/JPY - Short at 111.45, exited at 111.35 (+ 10 points)
26 Jul: USD/JPY - Short at 112.00, exited at 111.90 (+ 10 points)
26 Jul: USD/CHF- Short at 0.9570, exited at 0.9570 ( 0 point)
27 Jul: EUR/USD - Short at 1.1680, exited at 1.1715 (- 35 points)
27 Jul: USD/JPY - Short at 111.45, exited at 110.45 (+ 100 points)
27 Jul: GBP/USD - Long at 1.3085, exited at 1.3085 ( 0 point)
| JPY EUR CHF GBP
Jan + 167 - 85 - 10 + 50
Feb + 200 +150 +93 - 59
Mar -23 -70 -23 - 35
Apr + 65 + 93 + 50 - 40
May - 65 - 35 + 100 -175
Jun -100 -10 - 10 +175
Jul + 85 - 35 - 8
Aug
Sep
Oct
Nov
Dec
Y-T-D + 328 + 3 +192 - 74
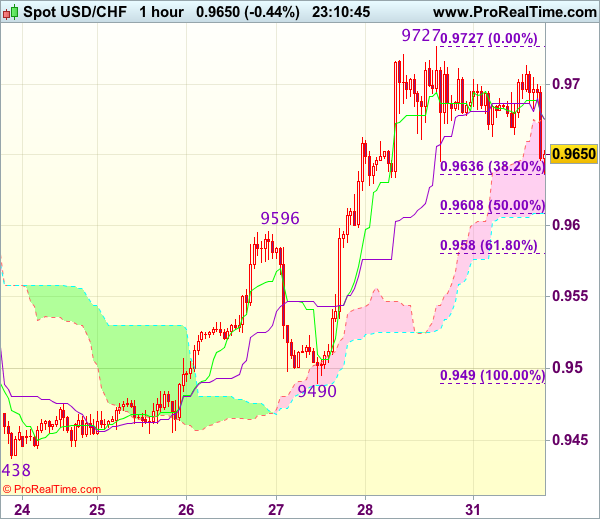
Trade Idea Wrap-up: USD/CHF – Buy at 0.9600
USD/CHF - 0.9666
Most recent candlesticks pattern : N/A
Trend : Near term up
Tenkan-Sen level : 0.9675
Kijun-Sen level : 0.9675
Ichimoku cloud top : 0.9675
Ichimoku cloud bottom : 0.9609
Original strategy :
Buy at 0.9600, Target: 0.9700, Stop: 0.9565
Position : -
Target : -
Stop : -
New strategy :
Buy at 0.9600, Target: 0.9700, Stop: 0.9565
Position : -
Target : -
Stop : -
As the greenback has retreated after faltering below last week’s high at 0.9727, retaining our view that further consolidation below this level would be seen and initial downside risk remains for pullback to 0.9635 (38.2% Fibonacci retracement of 0.9490-0.9727), however, previous resistance at 0.9596 should turn into support and contain downside, bring another rise later, above said resistance at 0.9727 would extend recent rise to 0.9750-60, then 0.9780 but reckon 0.9800 would hold from here.
In view of this, would not chase this rise here and would be prudent to buy dollar on further pullback as previous resistance at 0.9596 should turn into support and contain dollar’s downside. Below 0.9580 (61.8% Fibonacci retracement of 0.9490-0.9727) would defer and suggest a temporary top is formed instead, bring correction to 0.9540-50 but price should stay well above support at 0.9490, bring another rise later.
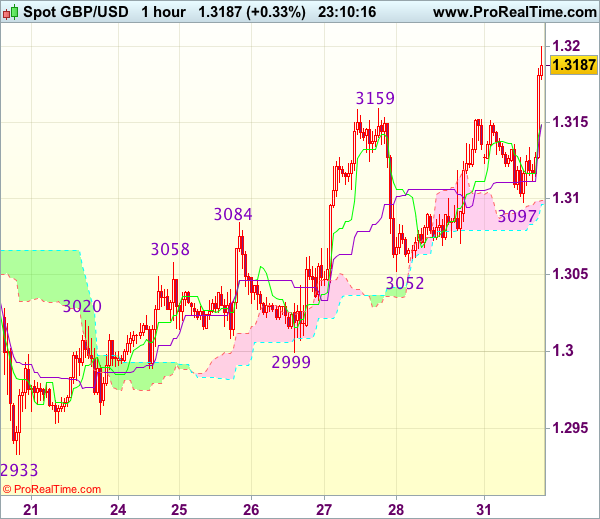
Trade Idea Wrap-up: GBP/USD – Buy at 1.3130
GBP/USD - 1.3180
Most recent candlesticks pattern : N/A
Trend : Near term up
Tenkan-Sen level : 1.3149
Kijun-Sen level : 1.3149
Ichimoku cloud top : 1.3099
Ichimoku cloud bottom : 1.3096
Original strategy :
Exit long entered at 1.3085
Position : - Long at 1.3085
Target : -
Stop : -
New strategy :
Buy at 1.3130, Target: 1.3230, Stop: 1.3095
Position : -
Target : -
Stop : -
Current rally in NY morning together with the breach of previous resistance at 1.3159 confirm recent upmove has resumed and upside bias is seen for further gain to 1.3210-20, then towards 1.3240-50, however, near term overbought condition should prevent sharp move beyond 1.3275-80 and reckon 1.3300 would hold from here, risk from there has increased for a retreat to take place later.
In view of this, would not chase this rise here and would be prudent to buy cable on pullback as the Tenkan-Sen (now at 1.3149) should limit downside, bring another upmove later. Below 1.3110-15 would defer and risk test of support at 1.3097 but only break there would signal a temporary top is possibly formed, bring further fall towards previous support at 1.3052.
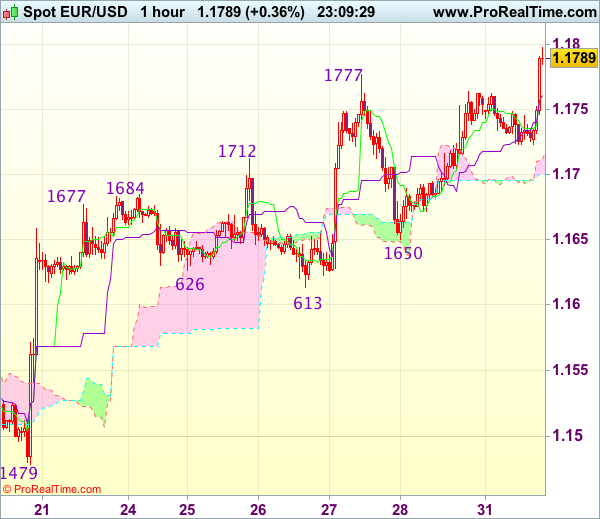
Trade Idea Wrap-up: EUR/USD – Buy at 1.1750
EUR/USD - 1.1793
Most recent candlesticks pattern : N/A
Trend : Near term up
Tenkan-Sen level : 1.1761
Kijun-Sen level : 1.1761
Ichimoku cloud top : 1.1711
Ichimoku cloud bottom : 1.1700
New strategy :
Buy at 1.1750, Target: 1.1850, Stop: 1.1715
Position : -
Target : -
Stop : -
As the single currency has surged again after finding renewed buying interest at 1.1723 and price just broke above last week’s high at 1.1777, adding credence to our bullish view that recent upmove from 1.0340 low is still in progress and upside bias remains for further gain to 1.1820-25, then towards 1.1850-55 (50% projection of 1.1370-1.1777 measuring from 1.1650) but loss of near term upward momentum should prevent sharp move beyond 1.1875-80 and price should falter below 1.1900-05 (61.8% projection), risk from there has increased for a retreat later.
In view of this, would not chase this rise here and would be prudent to buy euro on pullback as 1.1750 should limit downside. Below said support at 1.1723 would defer and suggest top is possibly formed, bring retracement of recent rise to 1.1690-95 first but indicated support at 1.1650 should hold.
WTI Oil Eventually Cracked Psychological $50 Barrier
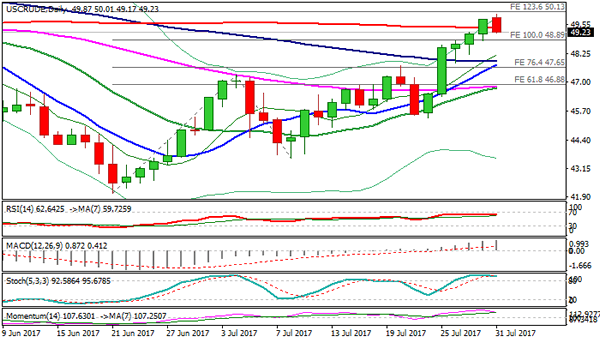
WTI oil eventually cracked psychological $50.00 barrier (also top of weekly cloud) on Monday, but showed strong hesitation at the resistance on quick pullback below broken 200SMA ($49.41), to pressure broken bull-channel resistance at $49.14.
Reaction at $50.00 barrier was expected, as traders also booked profits after last week's strong rally (the biggest weekly advance since the last week of Nov 2016).
Deeper pullback could be anticipated as slow stochastic is reversing in deep overbought territory.
Daily close below 200SMA will be bearish signal for further correction. Friday's low at $48.85 marks next support, ahead of more significant $48.25 level (Fibo 38.2% of $45.39/$50.01 upleg) where extended dips should be ideally contained, before bulls resume towards targets at $50.13 (FE 123.6% of the wave C from $43.63) and $50.27 (29 May high).
Res: 50.01; 50.13; 50.27; 50.50
Sup: 49.14; 48.92; 48.25; 47.70
Trade Idea Wrap-up: USD/JPY – Sell at 111.20
USD/JPY - 110.47
Most recent candlesticks pattern : N/A
Trend : Near term down
Tenkan-Sen level : 110.58
Kijun-Sen level : 110.65
Ichimoku cloud top : 111.49
Ichimoku cloud bottom : 111.17
New strategy :
Sell at 111.20, Target: 110.20, Stop: 111.55
Position : -
Target : -
Stop : -
As the greenback has remained under pressure after recent anticipated selloff, adding credence to our bearish view that the decline from 114.50 is still in progress and downside bias remains for further weakness to 110.00-05 but near term oversold condition should limit downside to 109.75-80 and reckon 109.50 would hold from here, risk from there is seen for a rebound later.
In view of this, would not chase this fall here and would be prudent to sell dollar again on subsequent rebound as 111.29 resistance should cap upside. Above the upper Kumo (now at 111.49) would defer but only break of resistance at 111.71 would abort and signal low is formed instead, bring subsequent rise towards last week’s high at 112.20.

Dollar Edges Up in Quiet Trading; Euro Unmoved by Flash CPI Data
Major currencies were steady in European trading on Monday as risk aversion and central bank meetings later in the week kept investors on the sidelines despite some key data releases. The US dollar inched higher against most other currencies but was weaker against the Japanese yen. The euro saw a mixed response to flash inflation numbers out of the Eurozone, while the pound held near last week's 10-month highs ahead of 'Super Thursday'.
Fresh geopolitical tensions gave rise to some risk-off sentiment at the start of the trading week following Friday's long-range missile test by North Korea. Gold climbed to a near 7-week high of $1270.98 an ounce in the Asian session and the yen was firmer against most major currencies. The Swiss franc was also broadly up, including against the euro where it looks on track to end the single currency's run of four straight sessions of sharp gains. The euro was marginally weaker at around 1.1375 francs, having hit a 2½-year high of 1.1406 francs on Friday. However, the franc was slightly down against the dollar with the greenback reclaiming the 0.97 handle today.
Better-than-expected data out of the Eurozone failed to lift the euro on Monday. Flash inflation readings for the euro bloc showed headline CPI was unchanged at 1.3% year-on-year in July, in line with forecasts. However, the core reading, which excludes food and energy prices, beat expectations of 1.1% to rise to 1.3% y/y - the highest since August 2013 - from 1.2% in May. Also coming in stronger-than-expected was the Eurozone's unemployment rate, which fell to 9.1% in June from a revised prior and expected figure of 9.2%.
Traders also shrugged off robust German retail sales numbers released earlier in the day. The euro rose slightly after the data before continuing its steady downtrend during the course of the day. It was last trading at $1.1732, having opened at $1.1761.
Sterling also lost some ground against the dollar but remained supported above the $1.31 level for most of the day. The British currency briefly fell below $1.31 after lending figures released by the Bank of England showed consumer credit rose less-than-expected in June, although mortgage lending increased more strongly than anticipated. The BoE had recently warned about unsustainable increases in consumer debt and today's rise, which was the slowest in over a year, may be of some comfort to the Bank, which meets on Thursday for its latest policy meeting.
Meanwhile, the greenback remained pressured against the yen even as it recovered against its other peers. Dollar/yen hovered around 110.50 for much of the day as the ongoing turmoil in the White House continued to worry investors. US data today included the Chicago PMI and pending home sales.
The Chicago PMI - a gauge of business activity in the Chicago region - fell to 58.9 in July from 65.7 previously and was below forecasts of 60.0. Pending home sales rose by more-than-expected however, jumping by 1.5% in June, compared with the 0.7% gain anticipated.
Another currency heading down versus the US currency was the Canadian dollar. A bigger-than-expected drop in Canadian producer and raw material prices weighed on the loonie today, as well as a downward reversal in oil prices. Dollar/loonie gained about 0.5% to 1.2485 in late European trading, moving away from last week's 2-year low of 1.2412.
Oil prices reversed earlier gains when they were lifted by the prospect of US sanctions on Venezuela, which is a major oil producer and OPEC member. Prices were also boosted by reports that OPEC members will hold a meeting in Abu Dhabi next week to discuss improving compliance to the output deal. WTI and Brent crude hit 2-month highs of $50.06 and $52.92 respectively before retreating. The commodity came under pressure after analysts cut their forecasts of crude oil prices for 2017. This led to the WTI oil price falling by 0.8% in late session to $49.30 a barrel, though the price of Brent was down a more moderate 0.3%.
Yen Edges Higher on Strong Japanese Industrial, Housing Data
USD/JPY is showing little movement in the Monday session. In North American trade, the pair is trading at 110.50, down 0.22% on the day. In Japan, Preliminary Industrial Production gained 1.6%, matching the forecast. As well, Housing Starts posted a strong gain of 1.7%, crushing the estimate of 0.1%. Later in the day, Japan releases Final Manufacturing PMI. Over in the US, we'll get a look at Pending Home Sales, which is expected to gain 0.9%. On Tuesday, the US releases two key indicators – Personal Spending and ISM Manufacturing PMI.
Japanese manufacturing and industrial indicators for June started the week on a positive note. Preliminary Industrial Production rebounded with a strong gain of 1.6%, after a decline of 3.3% in the May. As well, Housing Starts gained 1.7%, compared to a reading of -0.3% in May. These numbers underscore a stronger Japanese economy, buoyed by stronger demand for Japanese exports. Still, weak inflation levels remain a serious concern. The BoJ's ultra-loose monetary policy has failed to coax inflation upwards, and consumers remain wary, as borrowing and spending levels remains soft. At its policy meeting earlier in July, the BoJ again extended its time-frame for reaching its inflation target of 2%. The bank is reluctant to make scale back its asset-purchase program, which means that it will likely lag behind other central banks, such as the ECB, in reducing its stimulus program.
The US dollar has posted broad losses in response to climbing political risk in the US. This was again the case on Friday, as President Trump's struggling healthcare bill gasped its final breath as the bill was defeated in the Senate after three Republican lawmakers joined the Democrats and voted against the bill. This is another setback for President Trump, who has been unable to get Congress to pass any significant legislation, despite the Republicans controlling both the House and the Senate. Trump will now be able to focus on other issues such as tax reform, but investors are skeptical as to whether the President will have the support he needs in Congress to pass major legislation. On Monday, USD/JPY touched a low of 110.30, its lowest level since June 15.
August Seasonals get a Glance
The momentum and the seasonals diverge as we head into August. The loonie as the top performer in July as the Swiss franc lagged. A big week for data and central banks awaits. Just earlier, the Chicago PMI fell to 58.9 in July from 65.7, posting its bioggest decline since Feb 2015. Prending Home Sales rose rose 1.5% vs an exp 1.0%. Friday's Premium USD trade has been filled and is in progress. Ashraf's Bitcoin webinar this evening is at 8 pm London.

The July story was liftoff in central bank hike expectations as signs of global growth emerged. There are no obvious signs that it will be derailed this time but we're reminded of the many times in the past where it seemed growth was going to turn a corner only to stumble later.
In recent years, August has been a challenging month due to Chinese policy shifts and risk aversion. Seasonally, there are warning signs. AUD/USD has fallen in 10 of the past 12 Augusts and the average decline over the past decade is 1.05%. The RBA could set the tone in its Aug 1 decision.
Seasonal patterns are hit and miss but at the start of July we warned that it was the worst month for USD/JPY and the pair fell 1.5%. On the flipside, oil defied July seasonal weakness but the pattern continues in August and September.
Another seasonal pattern (and another central bank) to watch is pound weakness. August is the worst month on the calendar for cable in the short and long term.
Meanwhile, gold has some momentum and a seasonal tailwind as the August average gain over the past decade is 2.2%.
Ultimately, many of these patterns will need help from a bout of risk aversion so we will be watching all the usual and usual suspects.
CFTC Commitments of Traders
Speculative net futures trader positions as of the close on Tuesday. Net short denoted by - long by +.
- EUR +91K vs +91K prior
- GBP -26K vs -16K prior
- JPY -121K vs -127K prior
- CHF -2K vs -4K prior
- CAD +27K vs +8K prior
- AUD +56K vs +51K prior
- NZD +35K vs +36K prior
The market was a bit wrong-footed on sterling this week as it gained across the board. With the BoE coming up this week and US/CA jobs to follow, expect more moves ahead. The other story continues to be CAD as specs shake off the sting of the wrong-footed bet against the loonie and pile into longs. How far can the pendulum swing before the BOC gets cold feet about rate hikes?
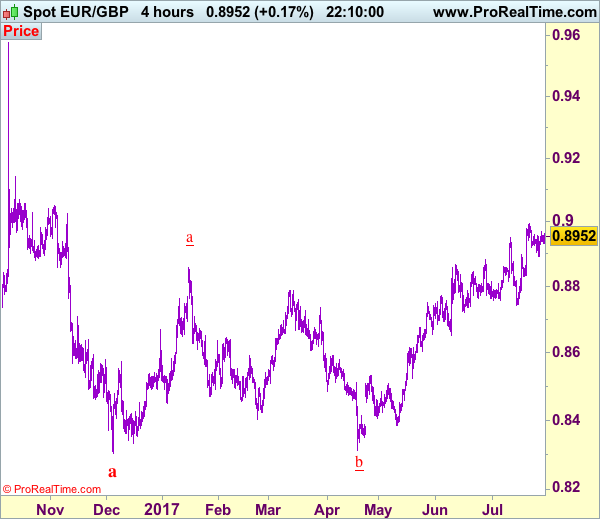
Trade Idea: EUR/GBP – Buy at 0.8925
EUR/GBP - 0.8951
Recent wave: Major double three (A)-(B)-(C)-(X)-(A)-(B)-(C) is unfolding and 2nd (A) has possibly ended at 0.6936.
Trend: Near term up
Original strategy :
Buy at 0.8925, Target: 0.9025, Stop: 0.8885
Position : -
Target : -
Stop : -
New strategy :
Buy at 0.8925, Target: 0.9025, Stop: 0.8885
Position : -
Target : -
Stop : -
The single currency rebounded after finding support at 0.8891, suggesting the pullback from 0.8995 has possibly ended there, hence retest of this level would be seen, however, break there is needed to confirm upmove has resumed for test of psychological resistance at 0.9000, then 0.9020 but reckon upside would be limited to 0.9050 due to overbought condition, risk from there has increased for a retreat later.
In view of this, would not chase this rise here and would be prudent to buy euro on dips as 0.8920-25 should limit downside. A break of said support at 0.8891 would defer and suggest a temporary top is formed instead, bring correction to 0.8860-65 but only break of support at 0.8829 would provide confirmation, bring correction to 0.8800 first.
Our preferred count is that, after forming a major top at 0.9805 (wave V), (A)-(B)-(C) correction is unfolding with (A) leg ended at 0.8400 (A: 0.8637, B: 0.9491 and 5-waver C ended at 0.8400. Wave (B) has ended at 0.9413 and impulsive wave (C) has either ended at 0.8067 or may extend one more fall to 0.8000 before prospect of another rally. Current breach of indicated resistance at 0.9043 confirms our view that the (C) leg has ended and bring stronger rebound towards 0.9150/54, then towards 0.9240/50.