Sample Category Title
Market Update – European Session: Euro Area Unemployment Continues To Improve To Multi-Year Lows
Notes/Observations
Unemployment data continues to improve in Europe; Euro Zone at lowest level since 2009; Italy Unemployment hits a 5-year low but aided by temporary positions
Geopolitical risks simmer around the globe (Venezuela, North Korea and Russia)
Central bank policy decisions due from RBA and BOE this week with US jobs data scheduled on Friday
Overnight/weekend
Asia:
China July Manufacturing PMI (Govt Official) misses expectations but expands for the 12th straight month. ( 51.4 v 51.5e). Softer data seen as govt began to try to rein in a hot property market and rising corporate debt.
China State Researcher Long Guoqiang: US trade calculation exaggerates deficit with China
Japan Jun Preliminary Industrial Production registers a slight beat and hints at more stable growth (M/M: 1.6% v 1.5%e; Y/Y: 4.9% v 4.8%e)
North Korea said to have test fired another missile
South Korea and US conduct joint ballistic missile test in response to North Korea's most recent ICBM test
Europe:
ECB'S Lautenschlaeger (Germany): it's important to prepare for the exit from accommodative policy in good time; unwind will be a long process; Inflation is not quite there yet
Fitch affirmed France sovereign rating at AA; outlook Stable
Americas:
(VZ) At least 9 killed, including a candidate, amid Venezuela protests during election for new legislative body that will reform constitution
US said to be considering oil-related sanctions against Venezuela, which could be announced by as early as today; not expected to include ban on Venezuelan oil shipments to the U
Economic Calendar
(DE) Germany Jun Retail Sales M/M: 1.1% v 0.2%e; Y/Y: 1.5% v 2.7%e
(TR) Turkey Jun Trade Balance: -$6.0B v -$6.0Be
(IT) Italy Jun Preliminary Unemployment Rate: 11.1% v 11.2%e
(UK) Jun Net Consumer Credit: £1.5B v £1.5Be; Net Lending: £4.1 v £3.4Be
(UK) Jun Mortgage Approvals: 64.7K v 65.0Ke
(EU) Euro Zone July Advance CPI Estimate Y/Y: 1.3% v 1.3%e; CPI Core Y/Y: 1.2% v 1.1%e
(EU) Euro Zone Jun Unemployment Rate: 9.1% v 9.2%e (lowest level since 2009)
(IT) Italy July Preliminary CPI (NIC including tobacco) M/M: 0.1% v 0.0%e; Y/Y: 1.1% v 1.0%e
(IT) Italy July Preliminary CPI EU Harmonized M/M: -1.9% v -1.9%e; Y/Y: 1.2% v 1.2%e
Fixed Income Issuance:
None seen
SPEAKERS/FIXED INCOME/FX/COMMODITIES/ERRATUM
Equities
Indices [Stoxx600 +0.2% at 379, FTSE +0.4% at 7398, DAX flat at 12164, CAC-40 -0.1% at 5126, IBEX-35 +0.1% at 10550, FTSE MIB +0.3% at 21496, SMI +0.4% at 9055, S&P 500 Futures flat at 2471]
Market Focal Points/Key Themes: European Indices trade higher across the board with outperformance in the Swiss SMI and FTSE 100, after US indices closed around flat on Friday. HSBC shares outperform following their earnings beat and sharebuyback, whilst upgraded guidance helps Sanofi trade higher. On the downside Utilitywise trade lower by over 40% after lowering guidance, while Legrand trades lower after results. In what will be another busy week for earnings notable highlight this mornign include
Equities
Materials: [Umicore +2.2% (Earnings)]
Financials: [HSBC [HSBA.UK] +2.7% (Earnings)]
Technology: [RIB Software [RSTA.DE] +4.5% (Earnings), Rexel [RXL.FR] +1.4% (Earnings), Legrand [LR.FR] -4% (Earnings)]
Healthcare: [Sanofi [SAN.FR] +1.5% (Earnings)]
Utilities:[Veolia {VIE.FR] +2.2% (Earnings), Utilitywise [UTW.UK] -41% (Earnings, guidance)]
Speakers
Chancellor of Exchequer Hammond (Fin Min): Would not seek to bring the tax rate down to well below EU standards
VP Pence: US stood with Baltic nations, whose biggest threat is Russian aggression. US hoped for better relations with Russia. Recent diplomatic action taken by Moscow would not deter the commitment of the US
China PBoC Dep Gov Zhang Xiaohu reiterated China to balance yuan rate flexibility and stability
Currencies
USD consolidated its recent bout of weakness but the greenback was still facing headwinds from political uncertainty.
EUR/USD around 1.1740 as price developments and employment trends continued to play into the ECB playbook and keep potential scaling back of stimulus in the near future.
GBP/USD fractionally lower at 1.3110 with focus on the BOE rate decision this Thursday.
Fixed Income
Bund futures trade at 161.89 down 14 ticks remaining contained with gamma likely to remain suppressed into another week of net negative supply and supportive month-end flows. Resistance lies near the 162.75 level followed by 163.50. A break of the 160.00 support level could see lows target 159.25 followed by 157.50.
Gilt futures trade at 126.24 higher by 5 ticks with the focus on Thursday's BOE rate decision, Inflation Report and monetary policy summary. Price finds key support at the 125.42 support level. An acceleration lower could test the 122.88 region. Resistance remains the noted 126.51 region, followed by 127.50.
Monday's liquidity report showed Friday's excess liquidity fell to €1.661T a drop of €16B from €1.677T prior. Use of the marginal lending facility fell to €207M from €225M prior.
Corporate issuance saw $36B issued last week. Next week's forecast is $25B
Looking Ahead
06:00 (IL) Israel to sell 2021, 2022 and 2027 bonds
06:00 (IT) Italy Jun PPI M/M: No est v -0.4% prior; Y/Y: No est v 3.1% prior
06:45 (US) Daily Libor Fixing
07:00 (IN) India announces details of upcoming bond sale (held on Fridays)
07:00 (IN) India Jun Fiscal Deficit (INR Crore): No est v 167739 prior
07:25 (BR) Brazil Central Bank Weekly Economists Survey
08:00 (PL) Poland July Preliminary CPI M/M: -0.2%e v -0.2 % prior; Y/Y: 1.6%e v 1.5 % prior
08:00 (ZA) South Africa Jun Trade Balance (ZAR): No est v 9.5B prior
08:00 (UK) Baltic Dry Bulk Index
08:00 (ES) Spain Debt Agency (Tesoro) announces size of upcoming actions in week
08:30 (CA) Canada Jun Industrial Product Price M/M: -0.3%e v -0.2% prior; Raw Materials Price Index M/M: -3.3%e v -1.8% prior
09:00 (FR) France Debt Agency (AFT) to sell combined €4.9-6.1B in 3-month, 6-month and 12-month Bills
09:00 (BE) Belgium Q2 Preliminary GDP Q/Q: No est v 0.6% prior; Y/Y: No est v 1.6% prior
09:00 (MX) Mexico Q2 Preliminary GDP Q/Q: No est v 0.7% prior; Y/Y: 1.8%e v 2.8% prior
09:00 (CL) Chile Jun Unemployment Rate: 7.1%e v 7.0% prior
09:30 (EU) ECB announces Covered-Bond Purchases
09:35 (EU) ECB calls for bids in 7-Day Main Refinancing Tender
09:45 (US) July Chicago Purchasing Manager: 60.0e v 65.7 prior
10:00 (US) Jun Pending Home Sales M/M: +1.0%e v -0.8% prior; Y/Y: No est v 0.5% prior
10:00 (MX) Mexico Jun Net Outstanding Loans (MXN): No est v 3743B prior
10:30 (US) July Dallas Fed Manufacturing Activity: 13.0e v 15 prior
11:30 (US) Treasury to sell 3-Month and 6-Month Bills
15:00 (AR) Argentina Jun Industrial Production Y/Y: 3.5%e v 2.7% prior; Construction Activity Y/Y: No est v 10.3% prior
16:00 (US) Weekly Crop Condition Report
Foreign Exchange Market Commentary: EUR/USD, USD/JPY, GBP/USD, GOLD, WTI CRUDE, DJIA, FTSE100, DAX
EUR/USD
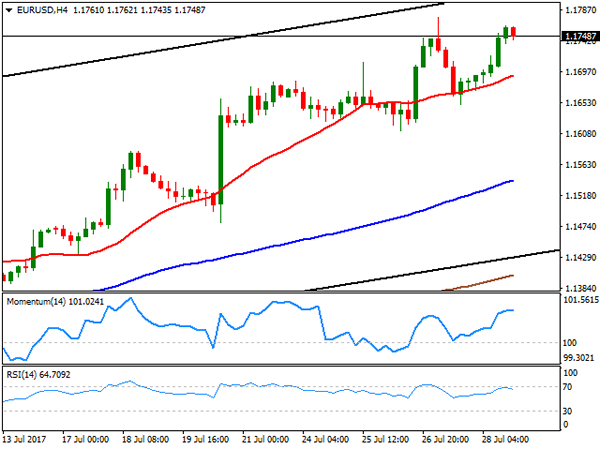
The EUR/USD pair closed the week at 1.1748, its highest settlement since January 2015, on fresh signs of decreasing inflationary pressures in the US. On Friday, the country released its advanced Q2 GDP figures, which showed that the economy expanded at a healthy annual rate of 2.6%, well above a previously revised 1.2% and in line with market's expectations, but the GDP price index for the three months to June resulted at 1.0%, down from previous 2.0% and the expected 1.3%. Also, the core PCE price index advanced by just 0.3% in the quarter, down from previous 2.2% and denting further expectations of a tighter monetary policy coming from the Fed. Additionally, German's preliminary July inflation came better-than-expected, growing annually by 1.7%, somehow increasing the pressure over the ECB on a sooner decision on tapering. The imbalance between central banks keeps shrinking, whilst the US in undermined by local political jitters, fundamentally poising a risk towards the upside.
The pair closed not far from a year high of 1.1776, the immediate resistance for this Monday, and the daily chart for the pair shows that technical indicators have resumed their advances after a modest correction, holding within overbought territory. The pair is also well above bullish moving averages in the daily chart, all of which favors additional gains. The pair also advanced for a third consecutive week, which increases the risk of a downward correction in the starting one, not expected to be significant at this point. In the 4 hours chart, technical indicators lost upward strength and turned modestly lower near overbought territory, whilst the 20 SMA aims north around 1.1690, in line with the dominant bullish trend, but also indicating that the pair may correct lower this Monday.
Support levels: 1.1715 1.1670 1.1620
Resistance levels 1.1780 1.1810 1.1845
USD/JPY
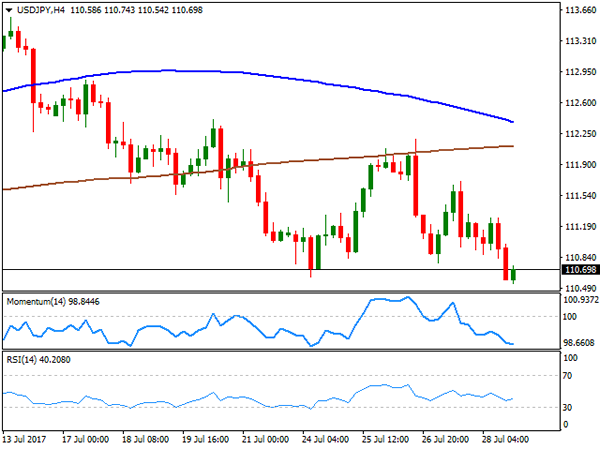
The USD/JPY pair reached a fresh July's low of 110.54 on Friday, settling not far above it and looking poised to extend its decline. The JPY appreciated on Friday, not only on US poor inflation within the Q2 GDP release, but also on headlines indicating new missile tests in North Korea, which once again hit the Japanese sea. Over the weekend, the US flew two bombers over the peninsula, in a show of force, while President Trump stated its "disappointment" over Chinese response to the matter. The escalating conflict could spur risk aversion at the beginning of the week, resulting in a JPY appreciation. Additionally, Japan will release industrial production and housing data early Monday, which may also have a saying on the pair's faith. In the daily chart, the pair settled well below its 100 DMA, while the RSI maintains a bearish slope around 36, as the Momentum consolidates near its July lows, all of which favors a bearish extension for the upcoming sessions. In the 4 hours chart, the 100 SMA accelerated lower, approaching the 200 SMA both well above the current level, while technical indicators hold near oversold territory, also in line with additional declines ahead.
Support levels: 110.50 110.00 109.65
Resistance levels: 110.90 111.25 111.60
GBP/USD
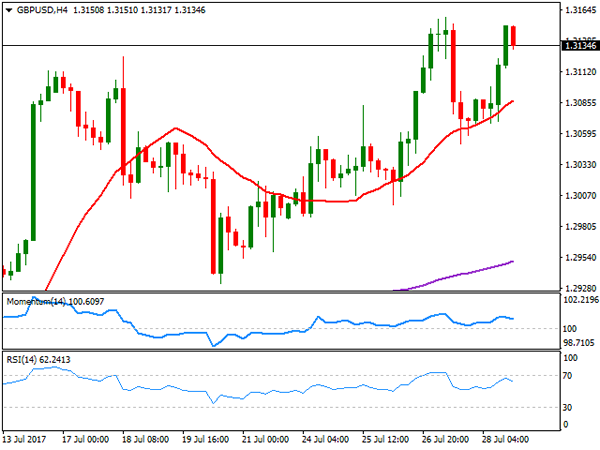
The GBP/USD pair closed the week with gains at 1.3134, level last seen in September 2016, and extending its yearly advance modestly, reaching 1.3158 on Thursday. There were no major macroeconomic of Brexit news this past week to move the Pound, with the pair's advance solely backed by persistent dollar's weakness. The mentioned yearly high was reached after late Wednesday, the US Federal Reserve made its monetary policy announcement, seen by the market as dovish on inflation. UK's Markit PMIs for July will release this week, whilst the BOE will meet next Thursday, the main events for the week. Changes of a change in monetary policy are limited given that, despite holding well above the BOE's 2% target, inflation has eased this past month. In fact, a dovish stance could be priced in ahead of the event, although broad dollar's weakness may result in a shallow retracement in the pair. From a technical point of view, the daily chart shows that the price is well above a bullish 20 SMA, while the RSI turned hither around 64 and the Momentum keeps consolidating within positive territory, favoring additional gains on an acceleration through 1.3160. In the 4 hours chart, technical indicators eased modestly within bullish territory, but the price also holds above a bullish 20 SMA, all of which limits chances of a steep decline ahead.
Support levels: 1.3100 1.3060 1.3020
Resistance levels: 1.3160 1.3200 1.3250
GOLD
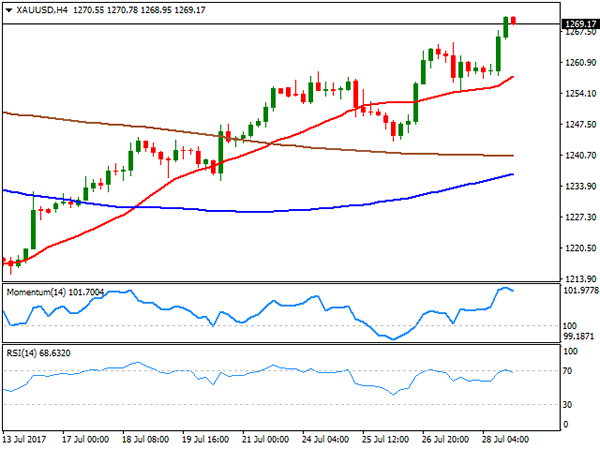
Spot gold extended its advance to a fresh July high of $ 1,270.78 a troy ounce on Friday, ending the day slightly below it, but maintaining its bullish stance. Following a dovish Fed on Wednesday, the commodity got additional support from US GDP data, as despite the US is estimated to have grew by 2.6% in the second quarter, price inflation came in well below expectations, with core PCE up by just 0.3% in the same period. Gold settled at its highest since mid June, and technical readings in the daily chart favor an upward extension ahead, as indicators extended their advances to fresh 1-month highs, maintaining their bullish slopes, despite being in overbought territory. The same chart shows that the 20 DMA is gaining upward strength below the current level, while the 100 and 200 DMAs, remain flat, but also under the current price. In the 4 hours chart, technical indicators have turned lower within overbought territory, rather reflecting shrinking volumes at the end of the week than suggesting a downward movement, whilst the price remains well above all of its moving averages, keeping the risk towards the upside.
Support levels: 1,267.90 1,254.75 1,245.20
Resistance levels: 1,274.10 1,283.30 1,290.10
WTI CRUDE OIL
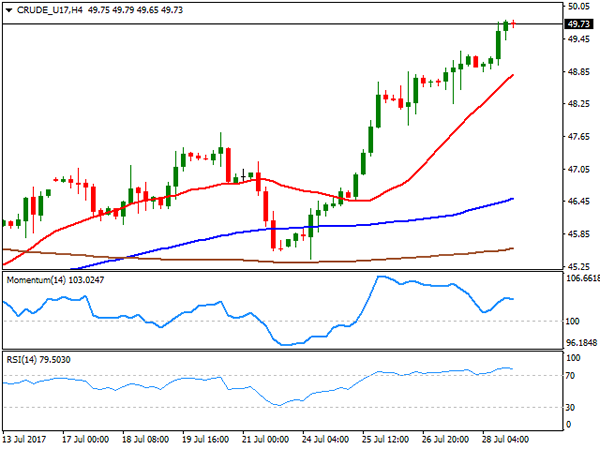
Crude oil prices extended their advance on Friday to levels last seen in May, with West Texas Intermediate crude futures settling at $49.73, up on the week by 8.6%. Oil prices surged on the back of positive market news, as US inventories fell by more than expected, while Saudi Arabia pledged to reduce further its oil output in August. The Baker Hughes report released on Friday, showed that the number of active rigs drilling oil in the US rose by 2 to 766 this past week, indicating the upward pace of US production began to decelerate. WTI's daily chart favors additional gains ahead, given that the price is above its 20 and 100 SMAs, with the shortest advancing below the largest, and the 200 DMA holding flat above the current level, around 50.00. Indicators in the mentioned time frame resumed their advances after a modest correction, now entering overbought territory with strong upward slopes. In the 4 hours chart, the RSI indicator turned modestly lower, but holds around 79, while the Momentum indicator is diverging lower, but still within positive territory, a first sign that the rally won't extend much more before at least correcting. The 20 SMA in this last time frame heads north around 48.80, providing a strong dynamic support.
Support levels: 49.45 48.80 48.20
Resistance levels: 50.10 50.65 52.20
DJIA
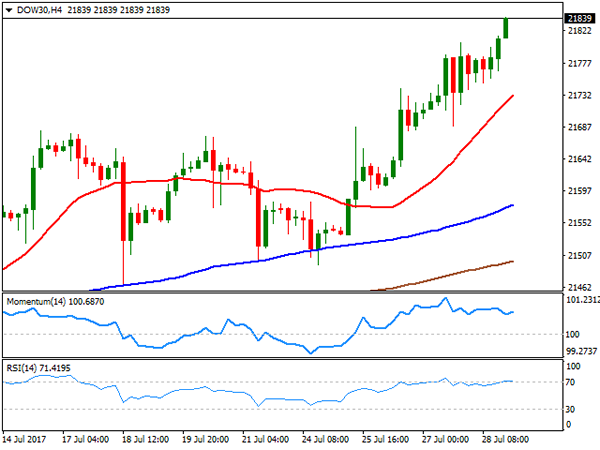
Wall Street closed mixed on Friday, with the Dow Jones Industrial Average ending up 33 points or 0.15% at new all-time highs of 21,880.31. The Nasdaq Composite lost 7 points, to 6,374.68, while the S&P settled at 2,472.10, down 3 points or 0.13%. The technology sector was the worst performer, dragged lower by a mixed quarterly result from Amazon, as the company beat revenue estimates, but fell short on earnings. Chevron led advancers, up 1.89%, while Exxon mobile was the worst performer, shedding 1.52%, both led by earnings reports, the main driver these days. The daily chart for the Dow shows that the index closed at its highs, up for a fourth consecutive day, and with moving averages still heading north below the current level, but technical indicators paring gains near overbought readings. In the 4 hours chart, however, the risk remains towards the upside, as the 20 SMA accelerated north below the current level, while the Momentum indicator turned modestly higher well into bullish territory, and the RSI consolidates around 71.
Support levels: 21,814 21,766 21,718
Resistance levels: 21,900 21,945 21,990
FTSE100
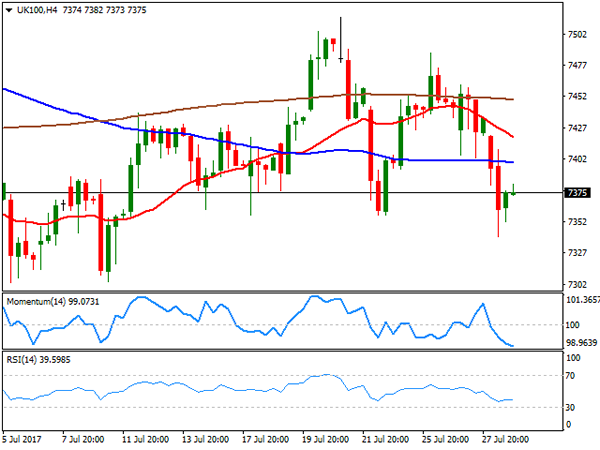
The FTSE 100 lost 1.0% or 73 points last Friday to close at 7,368.37. A US regulatory decision about the tobacco industry led the way lower, as the FDA proposed to lower nicotine levels to non-addictive levels. British American Tobacco plunged 6.80%, leading the way lower, followed by Imperial Brands that shed 3.79%. Miners and energy-related equities led the advance, with AstraZeneca leading the way higher, up 3.62%. The daily chart for the Footsie shows that the index closed below its 20 and 100 DMAs, that anyway remain flat and within a tight range, whilst technical indicators turned south, currently pressuring their mid-lines, all of which is not enough to confirm a bearish extension. In the shorter term, and according to the 4 hours chart, however, the bearish stance is clearer, given that technical indicators head south within negative territory, whilst the index develops below all of its moving averages, and particularly with the 20 SMA gaining downward strength.
Support levels: 7,340 7,294 7,257
Resistance levels: 7,398 7,434 7,587
DAX
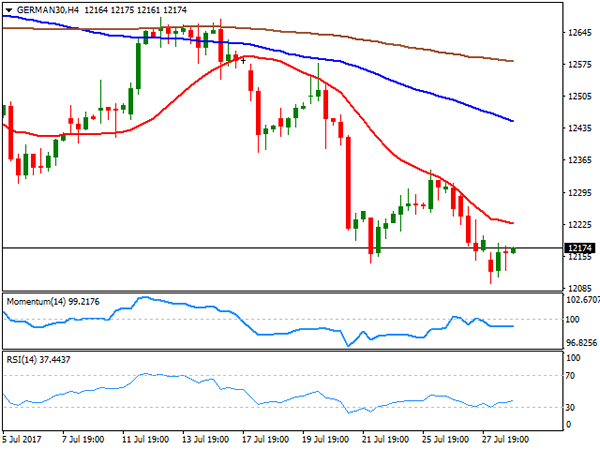
The German DAX lost 49 points last Friday to settled at 12,162.70, down for a second consecutive week and at levels last seen in April, as EUR's strength kept local shares under pressure. All European indexes closed in the red, led by automakers and chemicals companies. Emissions scandal hit all German big names in the automotive sector, on allegations they had colluded for decades to limit the pace of technological advances in their vehicles and stifle competition. Within the DAX, only 9 members closed up on Friday, with Adidas leading the way, up 4.04%. Line on the other hand, was the worst performer, shedding 2.36%, and Volkswagen closing 1.01% lower. The daily chart for the benchmark shows that the index is further below its 20 and 100 DMAs, with the shortest crossing below the larger and technical indicators maintaining their bearish slopes within negative territory. In the 4 hours chart, technical indicators turned flat well into negative territory, as the index develops below all of its moving averages, also maintaining the risk towards the downside.
Support levels: 12,146 12,098 12,053
Resistance levels: 12,199 12,235 12,292
Technical Outlook: AUDUSD Is Consolidating Under 0.8000, Awaiting RBA For Fresh Signal
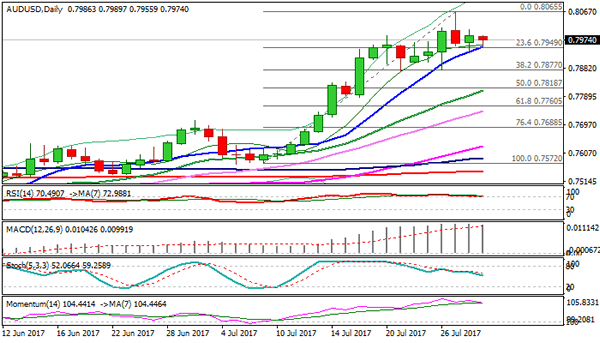
The Aussie dollars holding within a narrow range on Monday, below 0.8000 barrier, after spiking to fresh multi-month high at 0.8065 last week.
The pair remains in an uptrend from mid-May low at 0.7328, with stronger acceleration that started in early July, boosted by weaker dollar and higher commodity prices.
Three consecutive strong bullish weeks and ending the second straight month in bullish mode, signal further advance, which requires eventual weekly close above 0.8000 barrier, reinforced by falling weekly 200SMA.
Meanwhile, the pair may extend consolidation and dip lower on negative signal from daily RSI bearish divergence and the indicator's reversal from overbought territory.
Break below initial support, provided by rising 10SMA (currently at 0.7952) which contained last week's downside attempts, would generate bearish signal and risk extension towards next strong supports at 0.7877 (daily higher base / Fibo 38.2% of 0.7572/0.8065 upleg) and 0.7809 (rising 20SMA).
Focus is on RBA's interest rates decision on Tuesday with the central bank widely expected to keep interest rates unchanged at 1.5%.
Markets will be also watching RBA's Monetary Policy statement on Friday, as hawkish tone of the statement would further boost Australian currency.
Res: 0.7989, 0.8000, 8065, 0.8100
Sup: 0.7952, 0.7900, 0.7877, 0.7809
Dollar Weighed By Month End Flows And Political Tensions
Monday July 31: Five things the markets are talking about
The 'mighty' U.S dollar starts the week trading with a bearish price action against the yen on repatriation flows as White House's tensions with North Korea and Russia have escalated over the weekend.
Note: A North Korean missile launch showed that it might be within striking range of the U.S, while in Russia, President Putin has declared that he will kick out over 750 U.S diplomats by the end of September in retaliation to new sanctions. In Venezuela, at least nine killed, including a candidate, amid Venezuela protests during election for new legislative body that will reform constitution.
On the data front, there is a trifecta of central bank meetings with the Reserve Bank of Australia (RBA), Reserve Bank of India (RBI) and the Bank of England (BoE) all announcing their respective monetary policies (Aug 1, 2 and 3 respectively).
Elsewhere, the final July PMI's will be released for a host of countries, while trade data will be reported for Australia, Canada and the U.S.
Finally, ending another week of heavy earnings reports will be Friday's July employment data for the U.S and Canada.
1. Stocks get the green light for now
Year-to-date, equities have rallied to record levels globally on evidence of a resilient worldwide economy.
In Japan, the Nikkei ended slightly softer overnight (-0.2%), trading atop of its seven week lows as a sell-off in index heavyweight stocks offset gains in companies with upbeat earnings. For the month, the Nikkei has lost -0.5%, snapping a three-month winning streak. The broader Topix index closed -0.2% lower after swinging between gains and losses.
Down-under, Australia's S&P/ASX 200 Index rallied +0.3%, while South Korea's Kospi index added +0.1%.
In Hong Kong, the Hang Seng Index added +1.3% with financials among the biggest contributors to the advance. The index has completed a seventh-straight month of gains – For July, HSI was up +6.1%.
In China, stocks extended their gains, aided by earnings outlooks at resource firms. The blue-chip CSI300 index rallied +0.5%, while the Shanghai Composite Index added +0.6%, it's highest since mid-April. For the month, CSI300 advanced +2.0%, while SSEC gained +2.5%.
In Europe, regional indices trade higher across the board with outperformance in the Swiss SMI and FTSE 100 mostly buoyed by financials. It will be another busy week for earnings.
U.S stocks are set to open flat.
Indices: Stoxx600 +0.2% at 379, FTSE +0.4% at 7398, DAX flat at 12164, CAC-40 -0.1% at 5126, IBEX-35 +0.1% at 10550, FTSE MIB +0.3% at 21496, SMI +0.4% at 9055, S&P 500 Futures flat at 2471
2. Oil hits new high on tighter U.S market, Venezuela sanctions risk
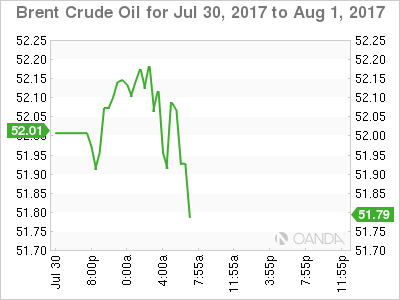
Overnight, oil prices hit a two-month high, lifted by a tightening U.S crude market and the threat of sanctions against OPEC-member Venezuela.
Brent crude futures are at +$52.85 per barrel, up +33c or +0.6%, while U.S. West Texas Intermediate (WTI) futures briefly jumped over +$50 per barrel, up +25c, or +0.5% from Friday's close.
Note: The price rises put both crude benchmarks on track for a sixth consecutive session of gains and up +10% since the last meeting of OPEC and other major producers.
U.S crude inventories have fallen by -10% from their March peaks to +483.4m barrels, while production numbers indicate that U.S output has dipped by -0.2% to +9.41m bpd in the week to July 21, after rising by more than +10% since mid-2016.
Drilling for new U.S production is also slowing, with just 10 rigs added in July, the fewest since May 2016.
Note: Despite the signs of a tighter market stateside, supplies in China remain plentiful – June crude inventories rose to the highest level in 11-months, marking the third month of gains.
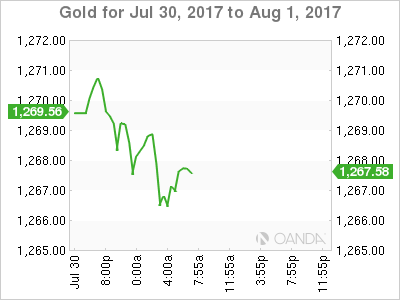
Gold prices are trading atop/near its seven-week high overnight (-0.2% to +$1,267.07 an ounce) as tensions on the Korean peninsula boosted safe-haven demand for the precious metal – It gained +1.1% last week in what was its third consecutive weekly gain.
Silver also rallied +1.2% last week, its third straight weekly gain, while copper climbed +1.2% to +$2.91 a pound, its highest price in more than two-years.
3. Global yields little changed
U.S government-bond prices rallied Friday after domestic data showed economic growth picked up in Q2 (+2.6% vs. +2.7%e), but that inflation continues to remain somewhat tepid.
U.S Q2 GDP rose at a +2.6% annual rate vs. the +2.7% expected, while the U.S employment-cost index (a broad gauge of wages and benefits), advanced by a seasonally adjusted +0.5% in Q2, less than the +0.6% rate the market was expecting.
The yield on benchmark 10's settled at +2.29%, down -2 bps from Thursday's close. However, it was still the first weekly gain for bond yields since July 7.
Elsewhere, Germany's 10-year Bund yield has declined -1 bps to +0.54%, U.K 10-year Gilts have also fallen -1 bps to +1.21%.
4. Is the Dollar undervalued?
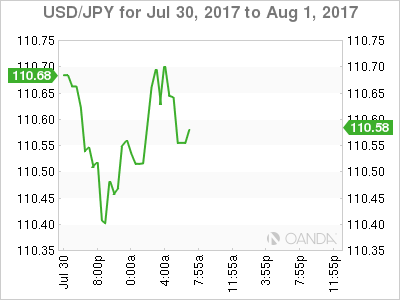
U.S political uncertainty surrounding the Trump administration has pressured the mighty USD, down -9% against the majors year-to-date.
Based on U.S fundamentals, is the dollar too much undervalued? Data for leveraged funds indicated that they are holding net 'short' dollar positions for the first time since May 2016.
The weakness in the world's reserve currency comes despite the Fed hiking rates last month, the prospect of further increases, and the shrinking of the Fed's balance sheet “relatively soon”. The market is also expecting a tightening soon bias from a plethora of other central banks (ECB, BoE, BoC and RBA). Maybe it's time to consider lightening up on the sell the Trump dollar trade?
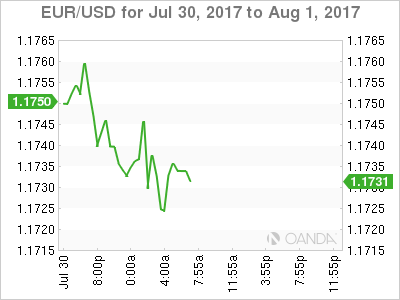
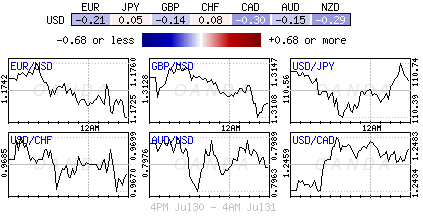
This morning, the EUR (€1.1733) has managed to pare some of its losses outright after in-line eurozone headline CPI inflation data, above-forecast core CPI data and better-than-expected jobless data (see below). It's now trading down -0.1% ahead of the U.S open.
GBP/USD is fractionally lower at £1.3110 with market focus on the BoE rate decision this Thursday.
5. Eurozone jobless rate falls, inflation stalls
Data this morning showed that the Eurozone's annual rate of inflation for July was as expected at +1.3%, unchanged m/m and remains at the lowest level for this year. The core rate nudged up to +1.2% despite a slowing of service prices, but all measures remain well below the ECB's target of just under +2%.
Causing further frustration for Euro policy makers is the unemployment rate continues to fall quite quickly – it's down to +9.1% in June, its lowest level in eight-years. The May rate was revised lower from 9.3% to 9.2%.
Overnight, China July Manufacturing PMI (Government Official) misses expectations, but expands for the 12th straight month.
China July official manufacturing PMI came in at 51.4 vs. 51.5e, and non-manufacturing PMI at 54.5 also shy of expectations.
Digging deeper, sub-component for construction rose to a high not seen since Dec 2013.
Euro Steady As Eurozone CPI Matches Estimate
In the Monday session, EUR/USD has edged lower, as the pair is trading at the 1.1730, down 0.15% on the day. On the release front, German Retail Sales climbed 1.1%, crushing the estimate of 0.1%. Eurozone CPI Flash Estimate remained unchanged at 1.3%, matching the forecast. In the US, today’s major event is Pending Home Sales. The markets are expecting a rebound of 0.9%, after three straight declines. On Tuesday, the US releases ISM Manufacturing PMI, with the markets expecting the index to dip to 56.4 points.
German indicators started the week on a positive note, as retail sales posted a strong gain of 1.1%. This marked the strongest gain since February. Last week, GfK German Consumer Climate strengthened for a fourth straight month, improving to 10.8 in the July report. This edged above the estimate of 10.7 points. Importantly, strong consumer confidence has translated into increased consumer spending, a key driver of economic growth. However, the fly in the ointment remains inflation, which is stuck at low levels. The lack of inflation is a pressing concern for ECB policymakers, and there is little chance that the bank will end its quantitative easing program before December, if inflation levels don’t move upwards.
It’s become an all-too-familiar pattern out of Washington – trouble for the White House has translated into losses for the US dollar, as higher political risk has led to investors moving away from the greenback in favor of other currencies and gold. It was déjà vu on Friday, as President’s struggling healthcare bill gasped its final breath as the bill was defeated in the Senate after three Republican lawmakers joined the Democrats and voted against the bill. This is another setback for President Trump, who has been unable to get Congress to pass any significant legislation, despite the Republicans controlling both the House and the Senate. Trump will now be able to focus on other issues such as tax reform, but investors are skeptical as to whether the President will have the support he needs in Congress to pass major legislation. The US dollar was broadly lower on Friday and the euro climbed to 1.7777, its highest level since January 2015.
GBP/JPY Daily Outlook
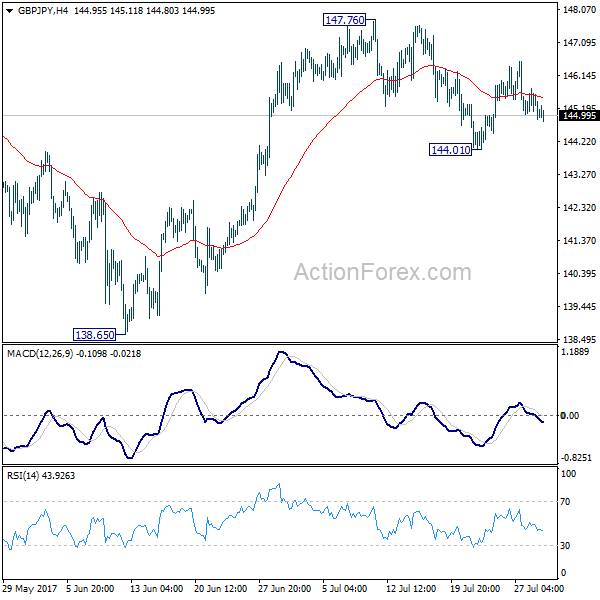
Daily Pivots: (S1) 144.95; (P) 145.36; (R1) 145.73; More
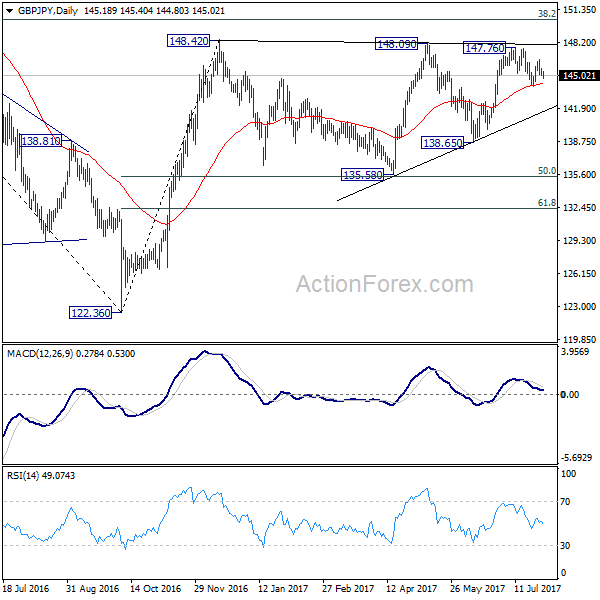
Intraday bias in GBP/JPY remains neutral for the moment. On the upside, break of 147.76/148.42 key resistance zone will resume larger rebound from 122.36. On the downside, break of 144.01 will extend the sideway pattern from 148.20 with another fall back to 135.58/65 support zone.
In the bigger picture, rise from medium term bottom at 122.36 is expected to continue to 38.2% retracement of 196.85 to 122.36 at 150.43. Decisive break there will carry long term bullish implications and pave the way to 61.8% retracement at 167.78. In case the sideway pattern from 148.42 extends, we'd be looking for strong support from 135.58 and 50% retracement of 122.36 to 148.42 at 135.39 to contain downside.
Forex Technical Analysis: EUR/USD, USD/JPY, GBP/USD
EUR/USD
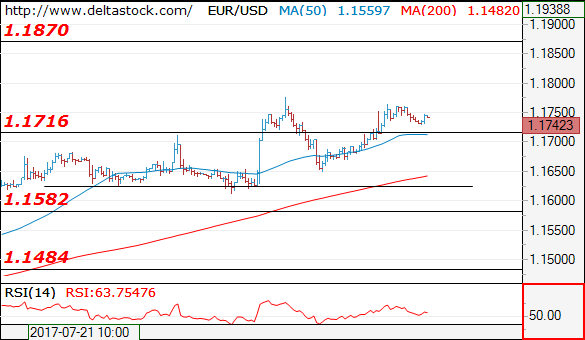
Current level - 1.1742
The bias is bullish above 1.1716, for a rise towards 1.1870 area. An eventual slide below the latter will provoke another attempt at 1.1650.
| Resistance | Support | ||
| intraday | intraweek | intraday | intraweek |
| 1.1716 | 1.1870 | 1.1611 | 1.1580 |
| 1.1870 | 1.2000 | 1.1580 | 1.1480 |
USD/JPY
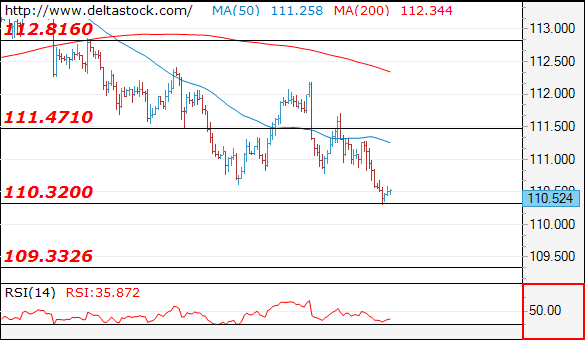
Current level - 110.54
The downtrend is intact, heading towards 109.30 support zone. Minor intraday resistance lies at 110.80, followed by the key area at 111.47.
| Resistance | Support | ||
| intraday | intraweek | intraday | intraweek |
| 111.47 | 114.50 | 110.30 | 110.30 |
| 112.80 | 115.50 | 109.30 | 108.10 |
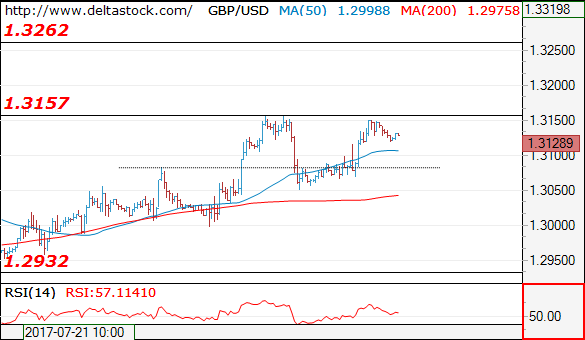
GBP/USD
Current level - 1.3128
A violation of the previous high at 1.3157 will confirm, that the consolidation pattern is over and the pair will target 1.3260 mark.
| Resistance | Support | ||
| intraday | intraweek | intraday | intraweek |
| 1.3157 | 1.3260 | 1.3100 | 1.2930 |
| 1.3260 | 1.3500 | 1.3050 | 1.2810 |
EUR/JPY Daily Outlook
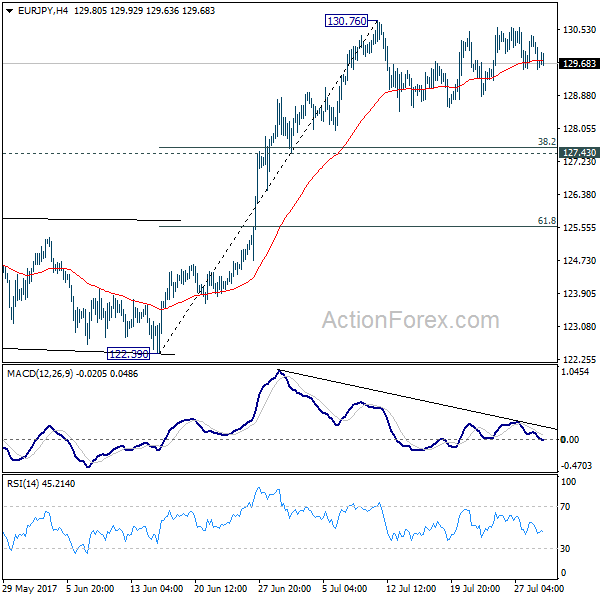
Daily Pivots: (S1) 129.58; (P) 129.99; (R1) 130.43; More...
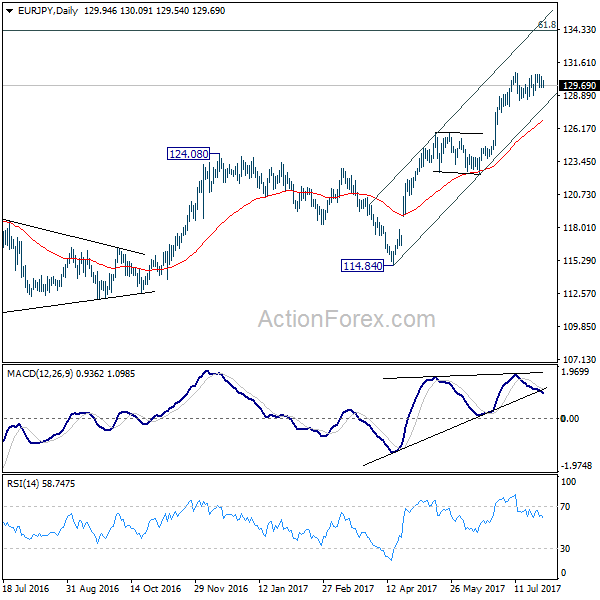
Intraday bias in EUR/JPY remains neutral as consolidation from 130.76 is extending. Another fall could be seen. But downside should be contained by 127.43 cluster support (38.2% retracement of 122.39 to 130.76 at 127.56) and bring rebound. Above 130.76 will extend the larger rally to next key fibonacci level at 134.20.
In the bigger picture, the down trend from 149.76 (2014 high) is completed at 109.03 (2016 low). Current rally from 109.03 should be at the same degree as the fall from 149.76 to 109.03. Further rise is expected to 61.8% retracement of 149.76 to 109.03 at 134.20. Sustained break there will pave the way to key long term resistance zone at 141.04/149.76. Medium term outlook will remain bullish as long as 124.08 resistance turned support holds.
Euro Gains Moderately As Core Inflation And Unemployment Surprise Positively
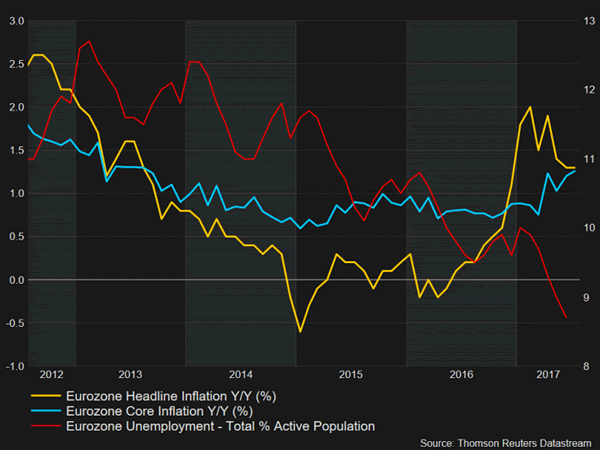
July flash inflation numbers, as well as the June unemployment rate for the eurozone were released today. The positive surprise in core inflation, in conjunction with the fall in the unemployment rate, led to the euro recording gains relative to major currencies.
Looking at today's figures, the July flash inflation rate stood at 1.3% on an annual basis, as expected. This also coincided with the prior month's figure. Rising energy prices contributed the most to inflationary pressures during July. The respective number for core inflation, the measure that excludes volatile unprocessed food and energy items, was released at 1.3% year-on-year as well, outstripping expectations for 1.1% growth and coming in above June's 1.2%. This constitutes a four-year high for the measure that is often cited by the European Central Bank in its policy making.
Turning to June's unemployment rate, it edged down to 9.1%, its lowest since 2009, from May's downwardly revised 9.2% (from 9.3% before). Analysts' projections were for a reading of 9.2%. This multi-year low reaffirms that euro area economies remain within a path of stronger growth. Adding to this, Germany saw its unemployment rate falling to 3.8% from 3.9% in May. This raises hopes that the eurozone's largest economy will experience more significant wage rises leading to positive contagious effects for the entire euro area.
Regarding reaction in the forex markets, the euro advanced on the news relative to the dollar as euro/dollar rose to as high as 1.1744 within the first few minutes of data release. The pair previously traded at 1.1731. Euro/pound also gained, rising to the intra-day high of 0.8961 from 0.8953 before the numbers went public. Gains relative to both currencies were not sustained, though it is worthy of mention that the common currency has considerably advanced versus the US and British currencies since the start of the year. Year-to-date, euro/dollar is up 11.6% and euro/pound up 5.0%.
During its last meeting on July 20, the ECB maintained its accommodative monetary policy stance with Mario Draghi, the central bank's President, emphasizing the need to be patient in terms of policy normalization. Today's upbeat figures are sure to add to speculation that the ECB will soon start removing accommodation or at least more actively talk about such a shift in policy. The Bank next meets on September 7.
EUR/GBP Daily Outlook
Daily Pivots: (S1) 0.8923; (P) 0.8946; (R1) 0.8964; More
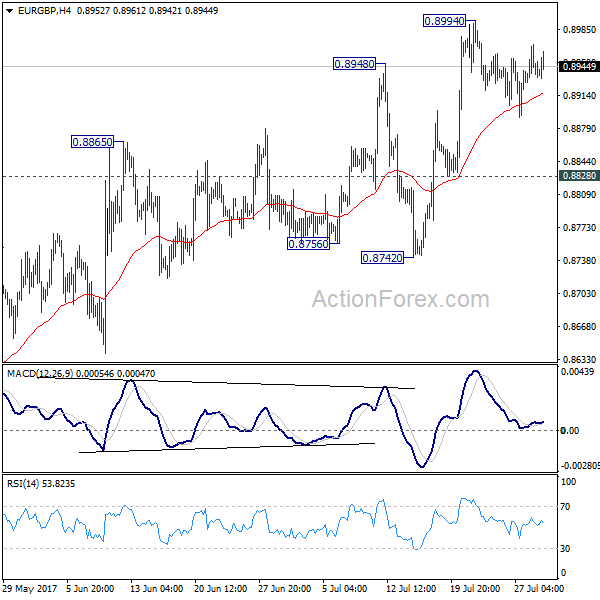
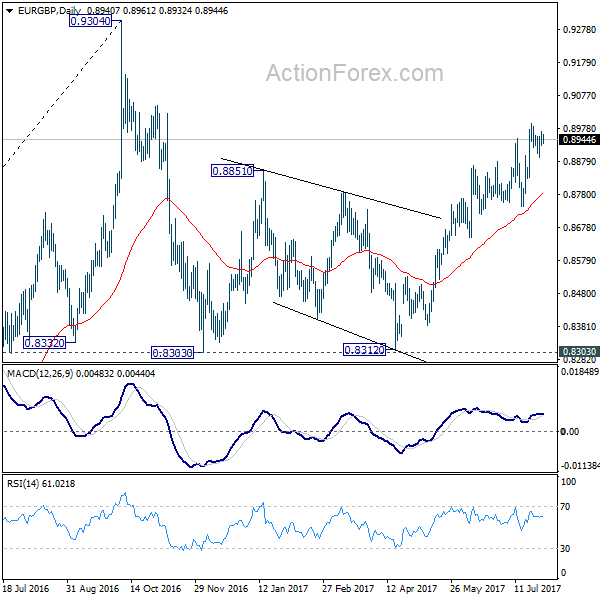
Intraday bias in EUR/GBP remains neutral for the moment as consolidation from 0.8994 continues. In case of another retreat, downside should be contained by 0.8828 to bring rise resumption. Whole rally from 0.8312 is still in progress and break of 0.8994 will target 0.9304 key high. There is no clear sign of up trend resumption yet. Hence, we'll be cautious on strong resistance from 0.9304 to limit upside and bring another fall. However, break of 0.8828 will turn focus back to 0.8742 support. Break there will indicate near term reversal.
In the bigger picture, price actions from 0.9304 are viewed as a medium term corrective pattern. It's uncertain whether it is finished yet. But in case of another fall, we'd expect strong support from 0.8116 cluster support (50% retracement of 0.6935 to 0.9304 at 0.8120) to contain downside and bring rebound. Whole up trend from 0.6935 is expected to resume after consolidation from 0.9304 completes.