Sample Category Title
Euro Gains Moderately As Core Inflation And Unemployment Surprise Positively
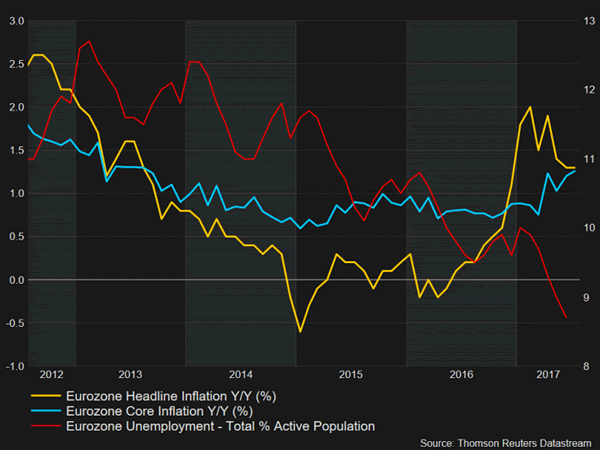
July flash inflation numbers, as well as the June unemployment rate for the eurozone were released today. The positive surprise in core inflation, in conjunction with the fall in the unemployment rate, led to the euro recording gains relative to major currencies.
Looking at today's figures, the July flash inflation rate stood at 1.3% on an annual basis, as expected. This also coincided with the prior month's figure. Rising energy prices contributed the most to inflationary pressures during July. The respective number for core inflation, the measure that excludes volatile unprocessed food and energy items, was released at 1.3% year-on-year as well, outstripping expectations for 1.1% growth and coming in above June's 1.2%. This constitutes a four-year high for the measure that is often cited by the European Central Bank in its policy making.
Turning to June's unemployment rate, it edged down to 9.1%, its lowest since 2009, from May's downwardly revised 9.2% (from 9.3% before). Analysts' projections were for a reading of 9.2%. This multi-year low reaffirms that euro area economies remain within a path of stronger growth. Adding to this, Germany saw its unemployment rate falling to 3.8% from 3.9% in May. This raises hopes that the eurozone's largest economy will experience more significant wage rises leading to positive contagious effects for the entire euro area.
Regarding reaction in the forex markets, the euro advanced on the news relative to the dollar as euro/dollar rose to as high as 1.1744 within the first few minutes of data release. The pair previously traded at 1.1731. Euro/pound also gained, rising to the intra-day high of 0.8961 from 0.8953 before the numbers went public. Gains relative to both currencies were not sustained, though it is worthy of mention that the common currency has considerably advanced versus the US and British currencies since the start of the year. Year-to-date, euro/dollar is up 11.6% and euro/pound up 5.0%.
During its last meeting on July 20, the ECB maintained its accommodative monetary policy stance with Mario Draghi, the central bank's President, emphasizing the need to be patient in terms of policy normalization. Today's upbeat figures are sure to add to speculation that the ECB will soon start removing accommodation or at least more actively talk about such a shift in policy. The Bank next meets on September 7.
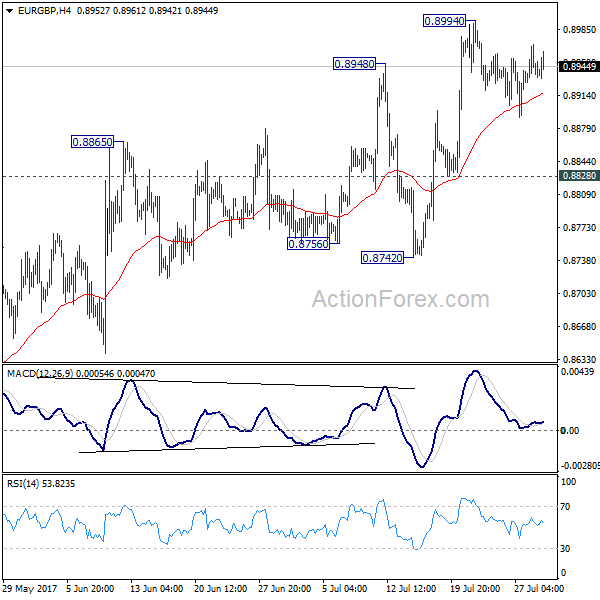
EUR/GBP Daily Outlook
Daily Pivots: (S1) 0.8923; (P) 0.8946; (R1) 0.8964; More
Intraday bias in EUR/GBP remains neutral for the moment as consolidation from 0.8994 continues. In case of another retreat, downside should be contained by 0.8828 to bring rise resumption. Whole rally from 0.8312 is still in progress and break of 0.8994 will target 0.9304 key high. There is no clear sign of up trend resumption yet. Hence, we'll be cautious on strong resistance from 0.9304 to limit upside and bring another fall. However, break of 0.8828 will turn focus back to 0.8742 support. Break there will indicate near term reversal.
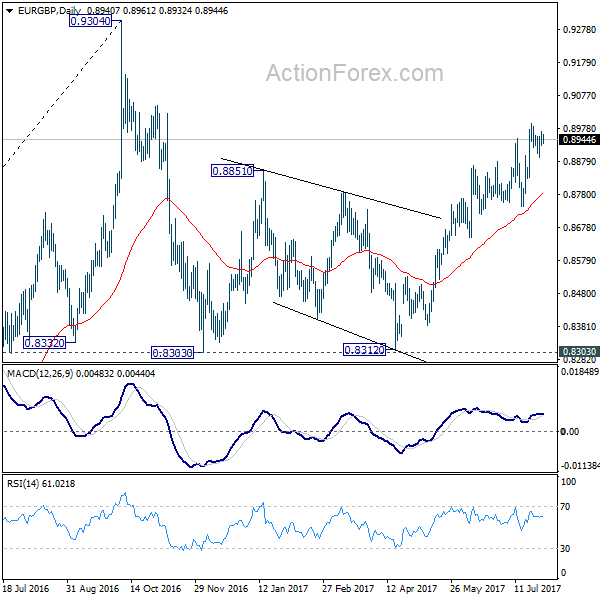
In the bigger picture, price actions from 0.9304 are viewed as a medium term corrective pattern. It's uncertain whether it is finished yet. But in case of another fall, we'd expect strong support from 0.8116 cluster support (50% retracement of 0.6935 to 0.9304 at 0.8120) to contain downside and bring rebound. Whole up trend from 0.6935 is expected to resume after consolidation from 0.9304 completes.
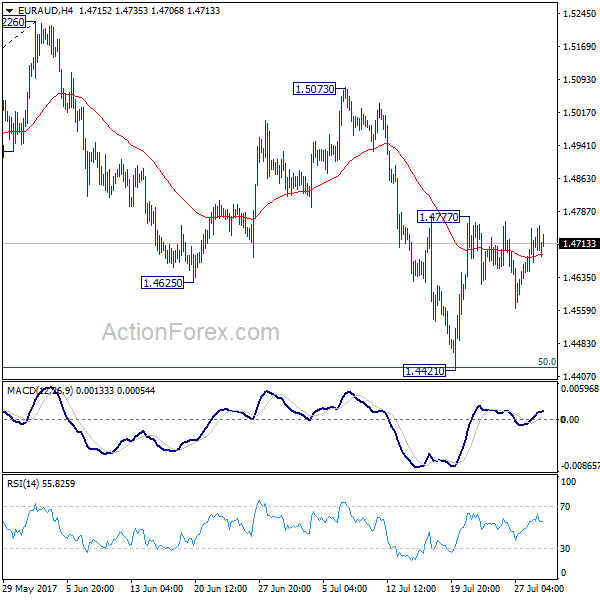
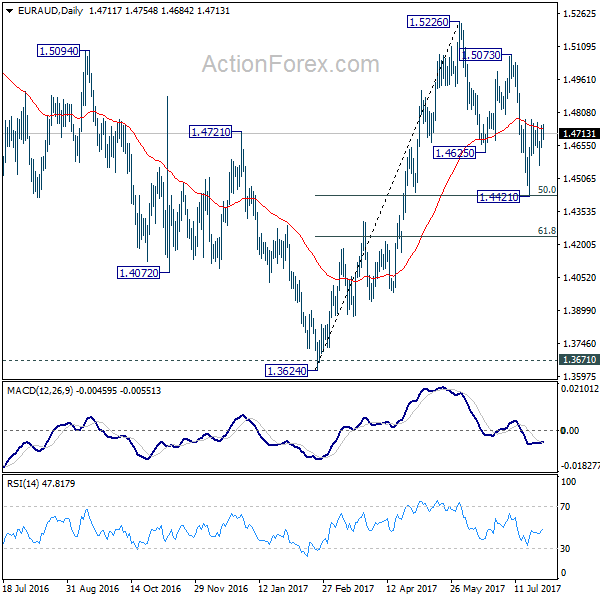
EUR/AUD Daily Outlook
Daily Pivots: (S1) 1.4653; (P) 1.4701; (R1) 1.4754; More...
Intraday bias in EUR/AUD remains neutral for the moment. At this point, we're still favoring the case that correction from 1.5226 has completed with three waves down to 1.4421 already. Hence, another rally is expected. Break of 1.4777 will turn bias to the upside for 1.5073 resistance first. Break there will indicate resumption of whole rise from 1.3624. However, break of 1.4221 will invalidate our view and extend the decline from 1.5226 to 61.8% retracement of 1.3624 to 1.5226 at 1.4236.
In the bigger picture, we're holding on to the view that corrective decline from 1.6587 medium term has completed at 1.3624. Rise from 1.3624 is expected to resume to retest 1.6587. The corrective structure of the fall from 1.5226 is affirming this view. Above 1.5226 will target a test on 1.6587 key resistance. However, another decline will dampen our view and would drag EUR/AUD lower to retest key support zone around 1.3624.
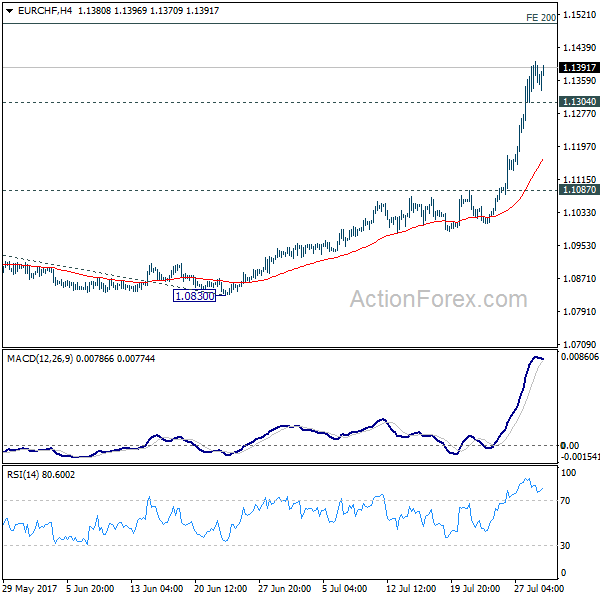
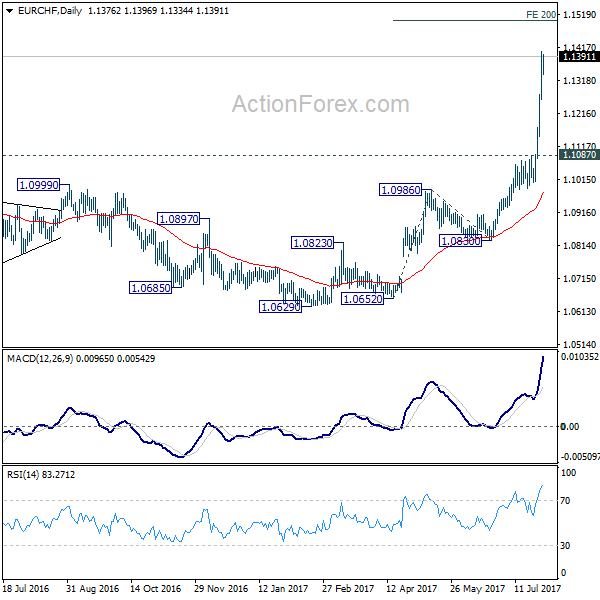
EUR/CHF Daily Outlook
Daily Pivots: (S1) 1.1291; (P) 1.1349; (R1) 1.1436; More...
With 1.1304 minor support intact, intraday bias in EUR/CHF remains on the upside for the moment. Current rally is expected to l target 200% projection of 1.0652 to 1.0986 from 1.0830 at 1.1498 next. On the downside, below 1.1304 minor support will turn intraday bias neutral and bring consolidations, before staging another rise.
In the bigger picture, sustained break of 1.1198 key resistance confirms resumption of the long term rise from SNB spike low back in 2015. In this case, EUR/CHF would eventually head back to prior SNB imposed floor at 1.2000. For now, this will be the favored case as long as 1.1087 resistance turned support holds.
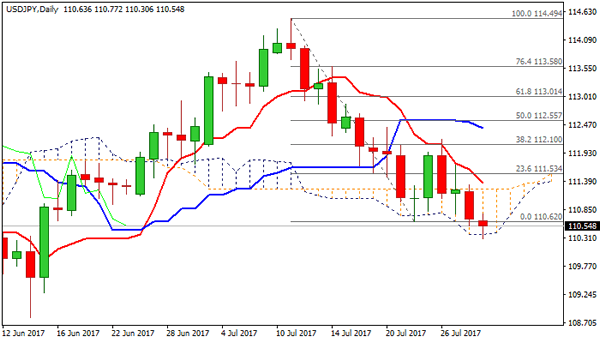
Technical Outlook: USDJPY – Daily Cloud Base Holds For Now But Bears Look For Further Extension Lower
Extension of last Friday's strong post-US data fall on Monday failed to clearly break below daily cloud base (110.38) at the first attempt. The pair hit session low at 110.30, but bounced higher, on consolidation ahead of renewed attempts lower.
Bids in the zone above 110.00 support keep the downside protected for now, with extended upticks, attracted by daily cloud twist later this week, expected to provide selling opportunities, as overall structure remains firmly bearish.
Sustained break below daily cloud and violation of 110.00 support, below which large stops are parked, would trigger fresh acceleration lower.
Extended upticks are expected to stay capped under daily cloud top at 111.23.
Res: 110.72, 111.00, 111.23, 111.36
Sup: 110.38, 110.14, 110.00, 109.26
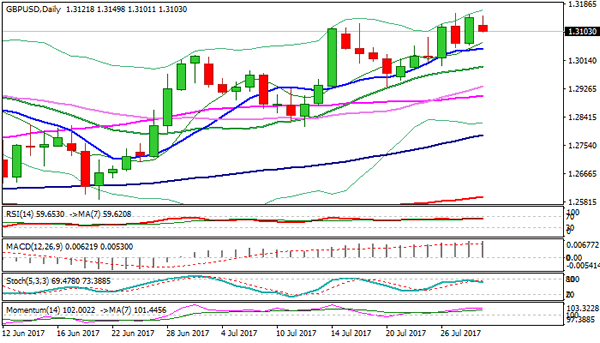
Technical Outlook: GBPUSD – Extended Consolidation Before Fresh Upside
Cable stands at the back foot in early Monday's trading and pressures initial support at 1.3100 after strong rally on Friday failed to regain last week's 1.3158 high (the heist since Sep 2016).
Deeper pullback signaled by bearish divergence on slow stochastic, as well as IMF report saying sterling is 15% overvalued.
Dips may test support at 1.3072 (Fibo 38.2% of 1.2932/1.3158 upleg) and extend to 1.3050 (50% retracement / daily Tenkan-sen / 10SMA) before broader bulls resume. Sustained break above 1.3158 to open round-figure barrier at 1.3200 and Fibo 138.2% projection at 1.3222.
Weekly close above 1.3109 (Fibo 38.2% of 1.5016/1.1930 fall) on Friday was a bullish signal for extension of recovery rally from post-Brexit lows at 1.2000 zone, where the base has been formed.
Res: 1.3134, 1.3158, 1.3200, 1.3222
Sup: 1.3100, 1.3072, 1.3050, 1.3018
Markets Calm Ahead Of Busy Week
- Earnings, central banks and data galore this week;
- EUR pops higher as unemployment falls to nine year low;
- US data eyed as busy week gets off to a slow start.
It's been a moderately positive start to trading on Monday, with stocks in Europe squeezing out small gains which is lifting US futures ahead of the open on Wall Street.
There's going to be no shortage of catalysts this week with earnings season being accompanied by major central bank announcements and big economic data. Arguably the two most notable events will be the Bank of England decision and US jobs report, both of which will come later in the week, but there's still plenty to watch out for before then with this morning already seeing unemployment and inflation data from the eurozone and PMI data from China.
The euro was briefly boosted by the euro area data which again showed the economic recovery gaining traction as unemployment fell to its lowest level since February 2009 and core inflation creeping higher. While this will be music to the ears of policy makers at the ECB as they prepare for further reductions in asset purchases later this year, it's worth remembering the low base that the region is recovering from.
Unemployment at 9.1% is still extremely high and when you break that down by country, it becomes much higher again in some places. Core inflation is also only at 1.3% which is still well below the ECBs target and with the currency appreciating strongly this year, downward pressures here will continue to build. The central bank should therefore tread very carefully when it comes to removing stimulus, as I expect it will.
Today is a little quiet on the earnings front, with the likes of Apple and Pfizer not reporting until tomorrow. It's also quiet on the data side with pending home sales and the Chicago PMI the only numbers scheduled for release. We may therefore see traders positioning themselves ahead of the rest of the weeks major events today, with a bad jobs report on Friday delivering another blow to the possibility of another rate hike this year.
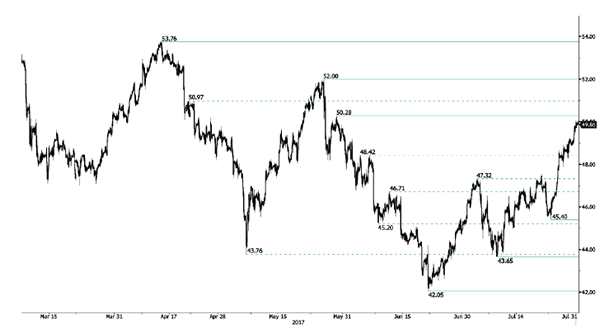
CRUDE OIL Monitoring Resistance At 50.28
Crude oil is trading higher Hourly support is given at 45.40 (24/07/2017 low). Strong resistance can be fouind at 50.28 (29/05/2017). Expected to show further consolidation before another leg higher.
In the long-term, crude oil has recovered after its sharp decline last year. However, we consider that further weakness are very likely. Strong support lies at 35.24 (05/04/2016) while resistance can now be ound at 55.24 (03/01/2017 high).
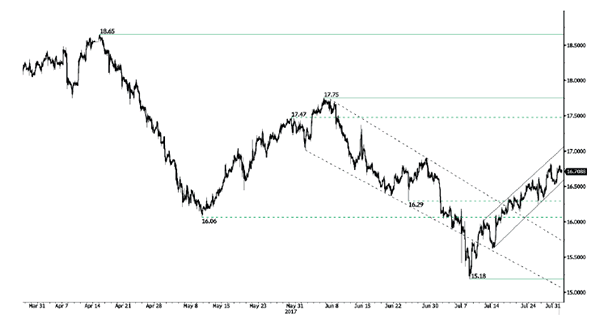
SILVER Riding Bullish Channel
Silver is pushing higher after the bounce from hourly support given at 15.18 (10/07/2017 low). Key resistance is given at a distance at 17.75 (06/06/2017 high). The commodity continues its short-term bullish increase.
In the long-term, the death cross indicates that further downsides are very likely. Resistance is located at 25.11 (28/08/2013 high). Strong support can be found at 11.75 (20/04/2009).
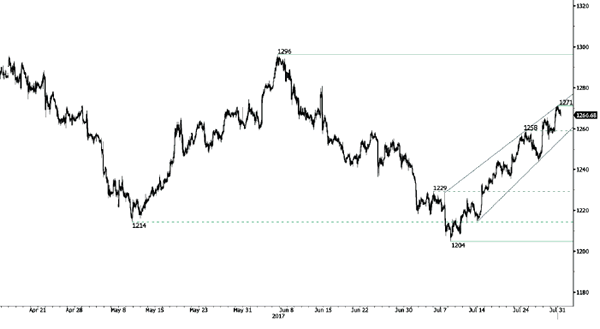
GOLD Riding Uptrend Channel
Gold continues to grow. Strong support is given at 1204 10/07/2017 high). Hourly resistance is given at 1271 (31/07/2017 high). Expected to show continued strengthening.
In the long-term, the technical structure suggests that there is a growing upside momentum. A break of 1392 (17/03/2014) is necessary ton confirm it, A major support can be found at 1045 (05/02/2010 low)