Sample Category Title
EUR/USD Elliott Wave Analysis
EUR/USD – 1.1733
EUR/USD: Wave (c) of 2 ended at 1.3993 and wave 3 of III has commenced for weakness to 1.0411 (1.236 of wave 1), then 1.0000.
The single currency has maintained a firm undertone after recent rally, adding credence to our bullish count that wave v as well as larger degree wave 3 has ended at 1.0340, hence wave 4 has commenced from there and upside bias remains for this move to extend gain to 1.1800-10, however, near term overbought condition should limit upside to 1.1870-80 and reckon 1.1950 would hold, price should falter below 1.2000, bring retreat later.
Our preferred count on the daily chart remains that a wave (II) from 1.2329 ended at 1.5145 with A-leg ended at 1.4720, followed by wave B at 1.2457, the wave C from there was also a 3 legged move and is labeled as (a): 1.3739, (b): 1.2885, the wave iii of the 5-waver (c) from 1.2885 has ended at 1.4339 and wave iv is a triangle ended at 1.3878 and wave v formed a top at 1.5145. The decline from there is a 5-waver (C) with minor wave (i) of I of (C) ended at 1.4218 with wave (ii) ended at 1.4580, wave (iii) ended at 1.3267 and wave (iv) ended at 1.3692 and wave (v) ended at 1.1876, this is also the low of wave I of (C) and wave II ended at 1.4940, hence wave III is now in progress with a diagonal wave 1 ended at 1.2042, the breach of previous support at 1.1876 (wave I trough) adds credence to our view that the wave 2 has ended at 1.3993, wave 3 has commenced for further weakness to 1.0411, then towards 1.0000.
On the downside, whilst initial pullback 1.1650 is likely, reckon downside would be limited to previous resistance at 1.1583 and 1.1530-35 should hold, bring another rise later. A daily close below support at 1.1479 would defer and suggest a temporary top is possibly formed, risk correction to minor support at 1.1435 but downside should be limited and price should stay above indicated support at 1.1370, bring another upmove later.
Recommendation: Buy at 1.1600 for 1.1800 with stop below 1.1500
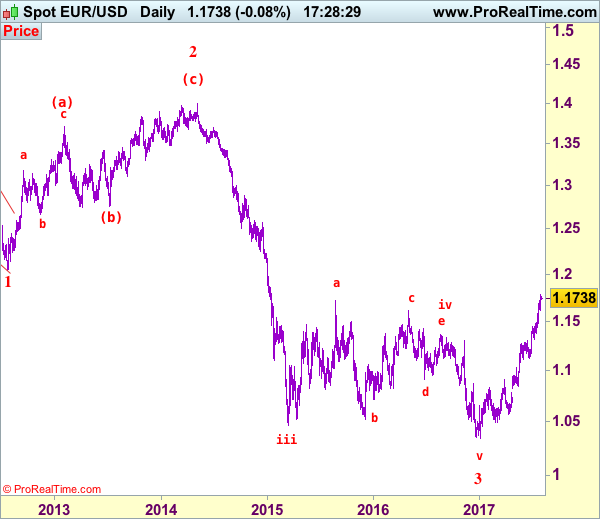
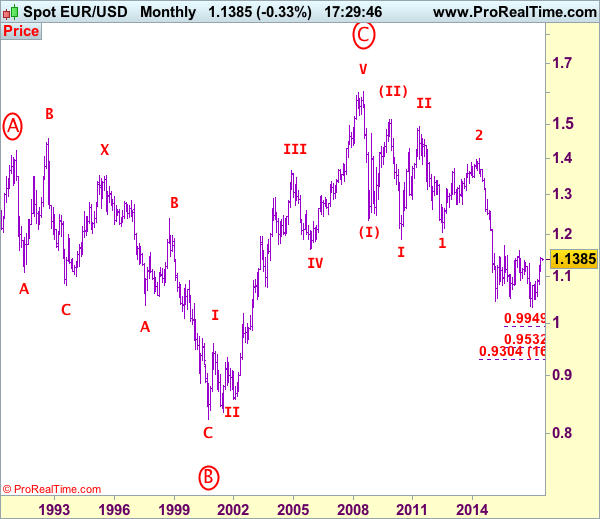
Euro's long-term uptrend started from 0.8228 (26 Oct 2000) with an impulsive structure. The rise from 0.8228 to 0.9593 (5 Jan 2001) is labeled as wave I, the retreat to 0.8352 (6 Jul 2001) is wave II and the rally to 1.3670 (31 Dec 2004) is wave III. Wave IV from there ended at 1.1640 (15 Nov 2005), the subsequent upmove to 1.6040 (July 15, 2008) is treated as wave V, the major selloff from the record high of 1.6040 to 1.2329 (October 27, 2008) signals a reversal has taken place with (I) leg ended at 1.2329 and once (II) ended at 1.5145, wave (III) itself is an extended move with I: 1.1876 and complex wave II ended at 1.4902, wave III has commenced with wave 1 and 2 ended at 1.2042 and 1.3993 respectively, wave 3 of III is now unfolding for weakness towards parity.
USD/JPY Elliott Wave Analysis
USD/JPY - 110.65
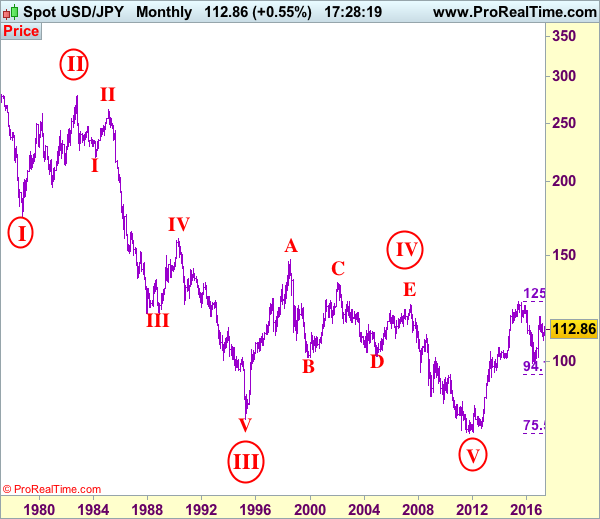
USD/JPY – Wave V of larger degree circle V has possibly ended at 75.31 and major correction has commenced and already met indicated target at 125.00.
The greenback staged the anticipated recovery to 112.20 before meeting renewed selling interest there (we recommended in our previous update to sell at 112.00 and a short position was entered) and the subsequent decline adds credence to our view that top has been formed at 114.50 and the decline from there may extend further weakness to 110.00, a daily close below there would reinforce our count that the entire corrective rebound from 108.13 has ended at 114.50 (tentatively wave b top), hence consolidation with downside bias remains for subsequent fall to 109.40-50 but reckon downside would be limited to 108.82 support. Only a break of this level would provide confirmation and signal wave c has commenced for retest of 108.13 first.
Our preferred count is that, triangle wave IV (with circle) ended at 101.45 and the circle wave V brought dollar down to the record low of 75.31 in 2011 and the subsequent rebound signal major correction has commenced with A leg ended at 84.19, followed by wave B at 77.14 and impulsive wave C is now unfolding (indicated upside target at 125.00 had been met) for gain towards 127.00 level. In the event dollar drops below support at 99.01, this would confirm medium term decline from 125.86 top (2015 high) has resumed for subsequent weakness to 98.00 and possibly 97.00.
Under this count, this wave C is unfolding as impulsive waves with (1) (2), 1 2 ended at 80.67, 79.07, 82.84 and 81.69 respectively, hence the extended wave 3 has ended at 103.74 and wave 4 correction of recent upmove should bring weakness to 92.57, then towards 90.88 but psychological support at 90.00 should limit downside and bring another rally later in wave 5, indicated target at 125.00 had been met and gain to 127.00 cannot be ruled out but reckon price would falter below 130.00.
On the upside, whilst initial recovery to 111.00 cannot be ruled out, reckon upside would be limited and resistance at 111.71 should hold, bring another decline. Above 111.71 would risk test of said resistance at 112.20 but only break there would abort and signal first leg of decline from 114.50 has ended, bring a stronger rebound to 112.85-90 but resistance at 113.58 should cap upside, bring another selloff later.
Recommendation: Hold short entered at 112.00 for 110.00 with stop above 111.75.

On the monthly chart, we have changed our preferred count that an impulsive wave is unfolding with major wave III with circle ended at 79.75, then followed by wave IV with circle and is labeled as a triangle with A: 147.64 (11 August, 1998), B: 101.25, C: 135.20, D: 101.67 and E leg ended at 124.14 to end the wave IV with circle. Hence, wave V with circle commenced from there and hit a record low of 75.31, however, the subsequent strong rebound signals this circle wave V has possibly ended there, hence gain to (indicated upside target at 122.00 and 125.00 had been met), the retreat from 125.86 suggests wave A of major correction has ended there and wave B correction back to 99.00, then 95.00 would be seen, however, reckon downside would be limited to 90.00, bring another rebound in wave C next year.
Trade Idea: GBP/USD – Buy at 1.3070
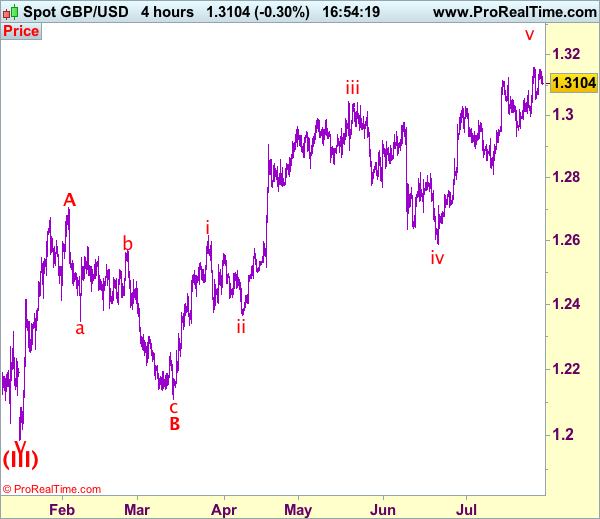
GBP/USD – 1.3112
Recent wave: Wave V of larger degree wave (III) has ended at 1.1986 and major correction has commenced from there for gain to 1.3000 and 1.3140-50
Trend: Near term up
New strategy :
Buy at 1.3070, Target: 1.3250, Stop: 1.3010
Position: -
Target: -
Stop:-
As sterling has eased after faltering below resistance at 1.3159 (last week’s high), suggesting consolidation below this level would be seen and pullback to 1.3070-80 cannot be ruled out, however, reckon support at 1.3050 would hold and bring another rise later, above said resistance at 1.3159 would extend gain to 1.3200, having said that, as this move is still viewed as the final wave v of larger degree wave C, reckon upside would be limited to 1.3240-50 and price should falter below 1.3300-10, then sterling shall retreat sharply from there.
Our preferred count on the daily chart is that cable's rebound from 1.3500 (wave (A) trough) is unfolding as a wave (B) with A ended at 1.7043, followed by triangle wave B and wave C as well as wave (B) has ended at 1.7192, the subsequent selloff is the larger degree wave (C) which is still unfolding with minor wave (III) of larger degree wave 3 ended at 1.1986, hence wave (IV) correction is in progress which could either be a triangle wave (IV) of a complex formation but upside should be limited to 1.3500 and price should falter well below 1.4000, bring another decline in wave (V) of 3 for weakness to 1.1500, then 1.1200.
On the downside, whilst pullback to 1.3070-80 cannot be ruled out, reckon support at 1.3050 would hold and bring another rise. Only below support at 1.2999 would abort and signal top has been formed at 1.3159, bring retracement of recent rise to 1.2980, then 1.2950-55 but previous support at 1.2933 should hold from here.
AUD/USD Daily Outlook
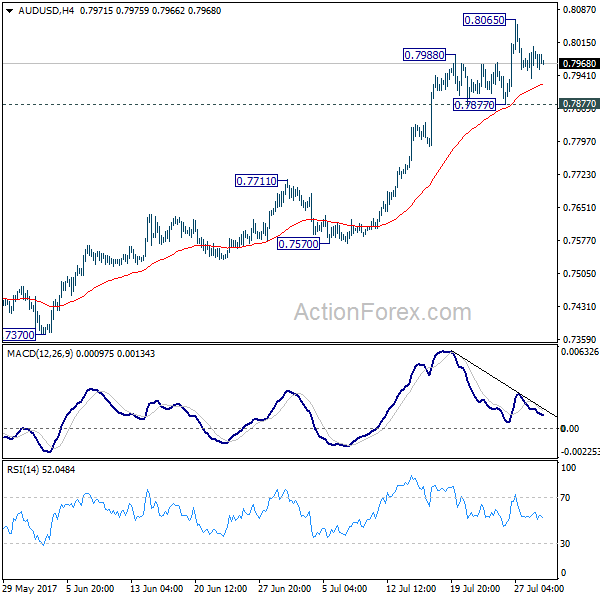
Daily Pivots: (S1) 0.7946; (P) 0.7976; (R1) 0.8016; More...
Intraday bias in AUD/USD remains neutral for consolidation below 0.8065. Another rally is expected as long as 0.7877 support holds. Break of 0.8065 will target 100% projection of 0.6826 to 0.7833 from 0.7328 at 0.8335. Nonetheless, break of 0.7877 will indicate short term topping on bearish divergence condition in 4 hour MACD. In such case, intraday bias will be turned back to the downside for 0.7711 resistance turned support.
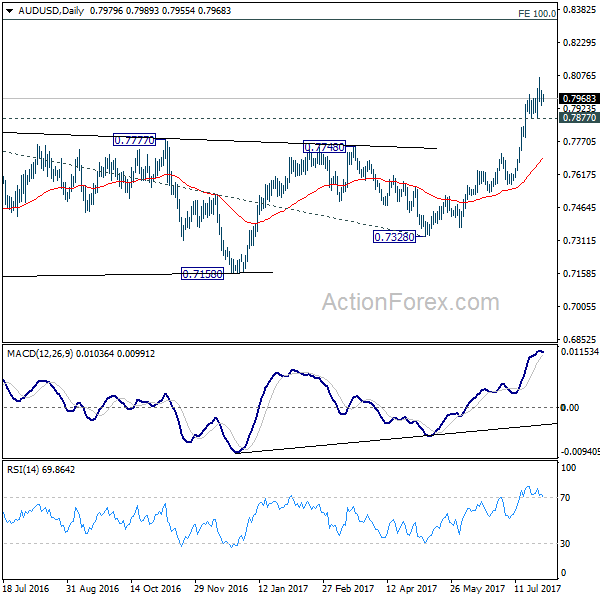
In the bigger picture, current development suggests that rebound from 0.6826 is developing into a medium term rise. There is no confirmation of trend reversal yet and we'll continue to treat such rebound as a corrective pattern. But in any case, further rise is now expected to 55 month EMA (now at 0.8100) or even further to 38.2% retracement of 1.1079 to 0.6826 at 0.8451. Break of 0.7328 support is needed to confirm completion of the rebound. Otherwise, further rise is now expected.
Is The RBA Comfortable With A Stronger AUD?
During the Asian day Tuesday, the RBA will announce its policy decision and the forecast is for the Bank to keep rates unchanged once again. July has been anything but boring for AUD traders. The fuss began after the minutes of the latest meeting showed a discussion regarding the level of the neutral policy rate in Australia, which was enough to raise speculation that the Bank may be preparing for a lift-off soon. However, a few days later, both Governor Lowe and Deputy Governor Debelle poured cold water on such expectations, signaling that markets shouldn't read too much into that conversation. Lowe made it clear that the Bank is likely to stay on hold for a while.
Having said that, we think that this meeting will still be closely watched for any updated signals on policy, and in particular, whether the Bank is comfortable with the latest rise in Australian yields as well as AUD appreciation. Indeed, both Lowe and Debelle noted that a lower Aussie would be desirable, implying there is a risk that the statement communicates a greater-than-previous discomfort about the recent surge in AUD. In such a case, the Aussie could correct lower.
AUD/USD traded in a consolidative manner on Friday, staying between the support of 0.7950 (S1) and the round figure of 0.8000 (R1). On Thursday, the pair slid back within the sideways range between 0.7900 (S1) and 0.8000 (R1) and thus, we consider the short-term outlook to have turned back to neutral. That said, if the RBA appears more concerned than previously with regards to Aussie's appreciation, we may see the pair sliding below 0.7950 (S1), and challenging the lower bound of the aforementioned range, at 0.7900 (S2). A clear dip below 0.7900 (S2) could set the stage for extensions towards our next support of 0.7840 (S3).
As for the bigger picture, as long as AUD/USD is trading above 0.7800, which acted as the upper bound of a wide range that had been containing the price action since the beginnings of March 2016, we still see a positive longer-term outlook. We would treat any possible retreat that stays limited above 0.7800 as a corrective phase.
Today's highlights:
Eurozone's preliminary CPIs for July will be in focus. The forecast is for the headline rate to have held steady, while the core rate is expected to have ticked down. We view the risks surrounding both forecasts as skewed to the upside. The July 2016 monthly CPI prints, which will be dropping out of the yearly calculation now, were -0.6% mom and -0.7% mom respectively. Therefore, even in case we get soft monthly prints today, as long as they are better than the dreadful prints of July 2016, they could still drag the yearly rates higher. What's more, the yearly change in oil prices turned positive in July, which further supports the case for an upside surprise in the headline rate. In case of better-than-expected CPIs, the euro could come under renewed buying interest. We also get the bloc's unemployment rate for June.
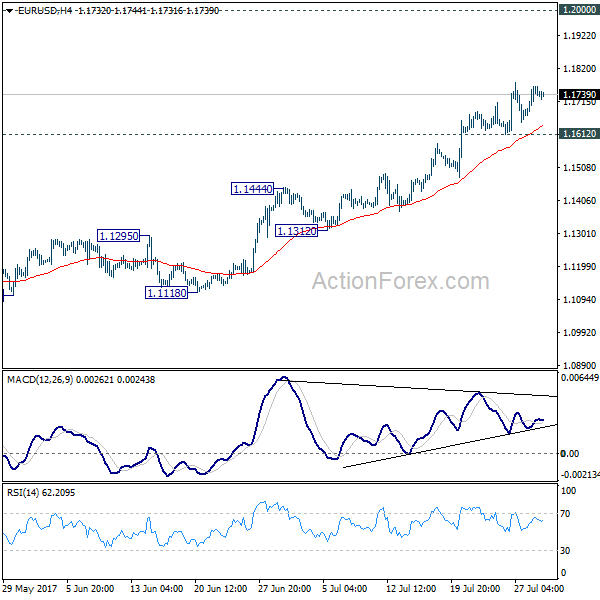
EUR/USD traded higher on Friday, broke back above 1.1710 (S1), but hit again resistance at 1.1775 (R1) before retreating somewhat. The rate continues to trade above the uptrend line drawn from the low of the 22nd of June and as a result, we consider the near-term picture to still be positive. Even if the pair retreats a bit more today, we think such a correction could encourage the bulls to take the reins again and shoot for another test at 1.1775 (R1). The catalyst for such an advance may be accelerating Eurozone CPIs today. A clear break above 1.1775 (R1) is possible to open the way for our next resistance of 1.1880.
In the US, the Chicago PMI and the Dallas Fed manufacturing activity index, both for July, are due out. We also get the nation's pending home sales for June.
As for the rest of the week:
On Tuesday, besides the RBA decision, we get a raft of economic data from the US: the core PCE price index for June, personal income and spending data also for the same month, as well as the ISM manufacturing PMI for July. In the UK, the manufacturing PMI for July will be in focus. On Wednesday, New Zealand's employment data for Q2 and the US ADP employment report for July are to be released. Thursday is 'Super Thursday” in the UK, meaning that besides the BoE rate decision and the meeting minutes, we also get the quarterly Inflation Report. Finally on Friday, the US employment report for July will take center stage and expectations are for another solid report overall. We also get Canada's employment data for the same month.
EUR/USD
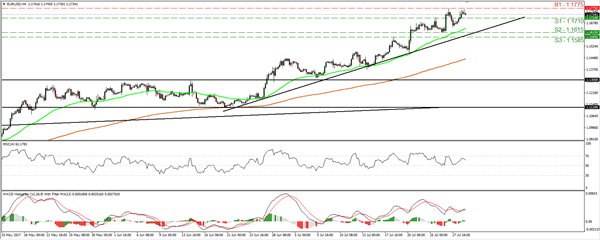
Support: 1.1710 (S1), 1.1615 (S2), 1.1585 (S3)
Resistance: 1.1775 (R1), 1.1880 (R2), 1.1980 (R3)
AUD/USD
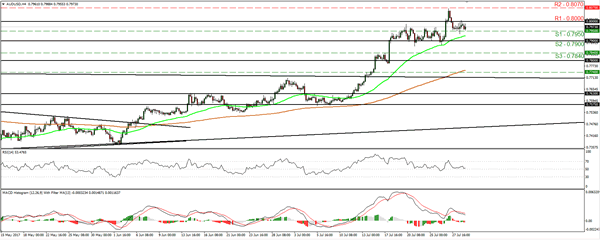
Support: 0.7950 (S1), 0.7900 (S2), 0.7840 (S3)
Resistance: 0.8000 (R1), 0.8070 (R2), 0.8160 (R3)
USD/CAD Daily Outlook
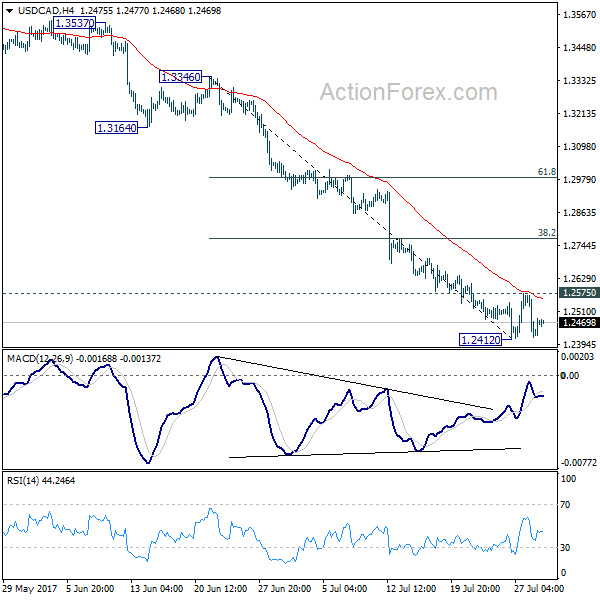
Daily Pivots: (S1) 1.2378; (P) 1.2473; (R1) 1.2527; More....
Intraday bias in USD/CAD remains neutral for the moment. On the upside, above 1.2575 will extend the rebound from 1.2412 and target 38.2% retracement of 1.3346 to 1.2412 at 1.2769 first. On the downside, break of 1.2412 will extend recent fall from 1.3793 to next key fibonacci level at 1.2048.
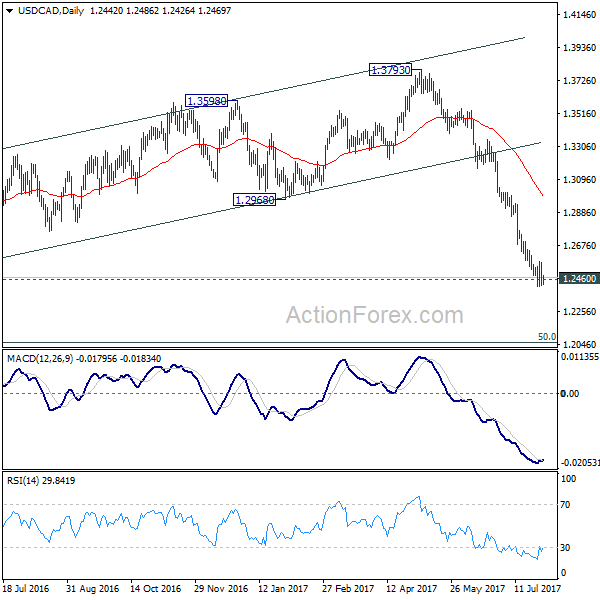
In the bigger picture, price actions from 1.4689 medium term top are seen as a correction pattern. Fall from 1.3793 is seen as the third leg and should target 50% retracement of 0.9406 to 1.4869 at 1.2048. At this point, we'd look for strong support from there to contain downside and bring rebound. However, firm break there will target 100% projection of 1.4689 to 1.2460 from 1.3793 at 1.1564.
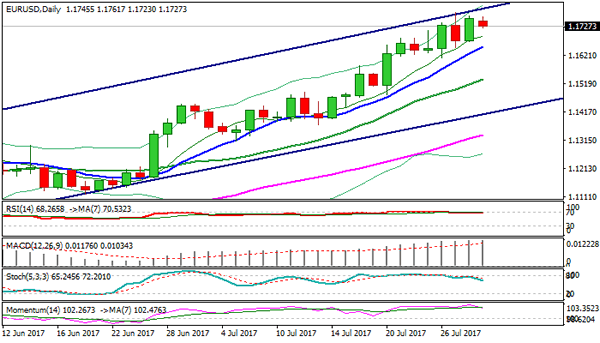
Technical Outlook: EURUSD – Bulls May Take A Breather On Overbought Studies But Bias Remains Bullish
The Euro holds firm and consolidating under fresh high t 1.1779 (the highest since Jan 2015 and near the upper boundary of bull-channel) in early Monday's trading.
Strong bullish signal has been generated on weekly close above pivotal barrier at 1.1735 (Fibo 38.2% of 1.3992/1.0340 descend), as the pair ended the third consecutive week positively and is on track for the fifth straight bullish month on steep recovery rally from 1.0500 zone higher base.
The rally approached another strong barrier at 1.1786 (weekly 200SMA), break of which is needed to confirm bullish continuation.
The pair is currently riding on the third wave of five-wave cycle from 1.0820) which could extend to its Fibo expansion levels at 1.1877 (FE 161.8%) and 1.1945 (FE 176.4%), on the way towards target at psychological 1.2000 barrier, also monthly Ichimoku cloud base.
Meantime, corrective pullback on overbought studies is seen as likely near-term scenario. Daily RSI and slow stochastic emerged from overbought territory and support the notion.
Rising 10SMA offers support at 1.1653, followed by daily Tenkan-sen/4-hr cloud base at 1.1630, where dips should find footstep. Extended pullback should be contained at 1.1530 zone (Fibo 38.2% of 1.1188/1.1776, reinforced by rising 20SMA) to keep bulls intact.
Res: 1.1776, 1.1800, 1.1877, 1.1945
Sup: 1.1700, 1.1653, 1.1630, 1.1612
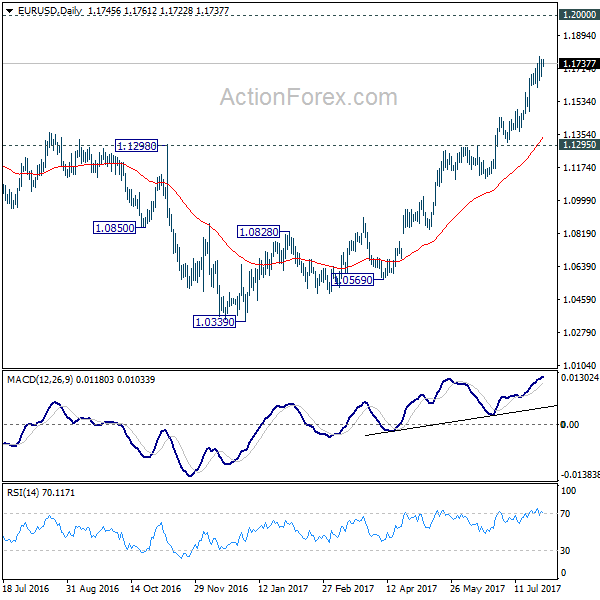
EUR/USD Daily Outlook
Daily Pivots: (S1) 1.1690; (P) 1.1726 (R1) 1.1783; More...
With 11.612 minor support intact, further rise is expected in EUR/USD at this point. Whole rise from 1.0339 low is still in progress and should target 1.2 handle next. Nonetheless, considering bearish divergence condition in 4 hour MACD, break of 1.1612 will indicate short term topping and bring lengthier consolidation first.
In the bigger picture, an important bottom was formed at 1.0339 on bullish convergence condition in weekly MACD. Sustained break of 55 month EMA (now at 1.1760) will pave the way to key fibonacci level at 38.2% retracement of 1.6039 (2008 high) to 1.0339 (2017 low) at 1.2516. While rise from 1.0339 is strong, there is no confirmation that it's developing into a long term up trend yet. Hence, we'll be cautious on strong resistance from 1.2516 to limit upside. But for now, medium term outlook will remain bullish as long as 1.1295 support holds, in case of pull back.
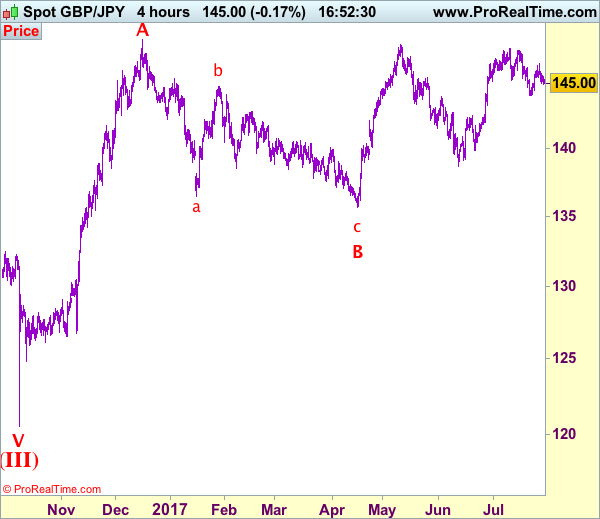
Trade Idea: GBP/JPY – Stand aside
GBP/JPY - 145.10
Recent wave: Medium term low formed at 120.50 and (A)-(B)-(C) major correction has commenced with (A) leg ended at 148.45, hence wave (B) is unfolding for retreat to 131.00-10.
Trend: Near term up
New strategy :
Stand aside
Position: -
Target: -
Stop:-
Sterling’s retreat after last week’s rise to 146.55 has retained our view that further consolidation would be seen and weakness to 144.80-85 cannot be ruled out, however, below support at 144.45-50 is needed to signal the rebound from 144.00-05 has ended, bring test of this level, break there would add credence to our view that a temporary top has been formed at 147.75 earlier this month, bring retracement of recent upmove to 143.50, then towards support at 143.30.
On the upside, above 145.80 would bring another test of said resistance at 146.55, break there would signal low has been formed at 144.05 and bring a stronger rebound to 146.90-00 and possibly towards 147.30. As near term outlook is still mixed, would be prudent to stand aside in the meantime.
Our preferred count is that larger degree wave V with circle is unfolding from 251.12 with wave (I) 219.34, (II): 241.38 and wave (III) is subdivided into 1: 192.60, 2: 215.89 (23 Jul 2008) and wave 3 ended at 118.87 earlier in 2009. The correction from there to 162.60 is wave 4 which itself is a double three and is labeled as first a-b-c ended at 151.53, followed by wave x at 139.03, 2nd a ended at 162.60, 2nd b at 146.75 and 2nd c leg of wave 4 ended at 163.00. Therefore, the decline from 163.00 to 116.85 is now treated as wave 5 which also marked the end of larger degree wave (III), hence wave (IV) major correction has commenced for retracement of the wave (III) from 241.38 and upside target at 183.95-00 (50% Fibonacci retracement of the wave (II) from 241.38) had been met, a drop below 160.00 would suggest wave (IV) has ended at 195.85, bring decline in wave (V) for initial weakness to 130 (already met) and 120.
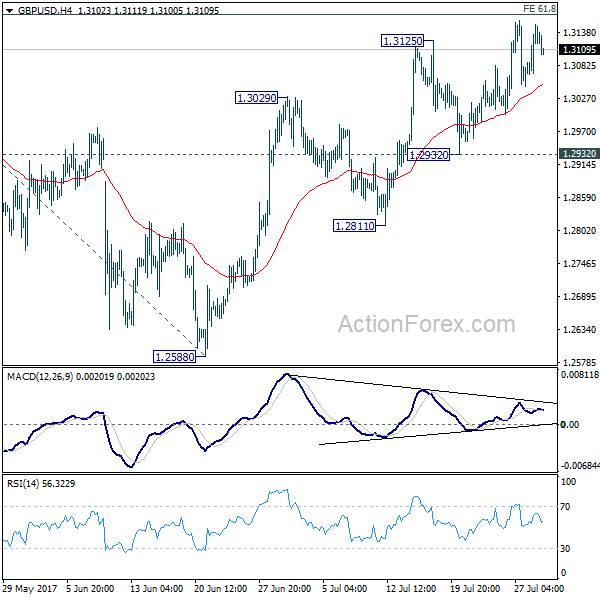
GBP/USD Daily Outlook
Daily Pivots: (S1) 1.3077; (P) 1.3115; (R1) 1.3168; More...
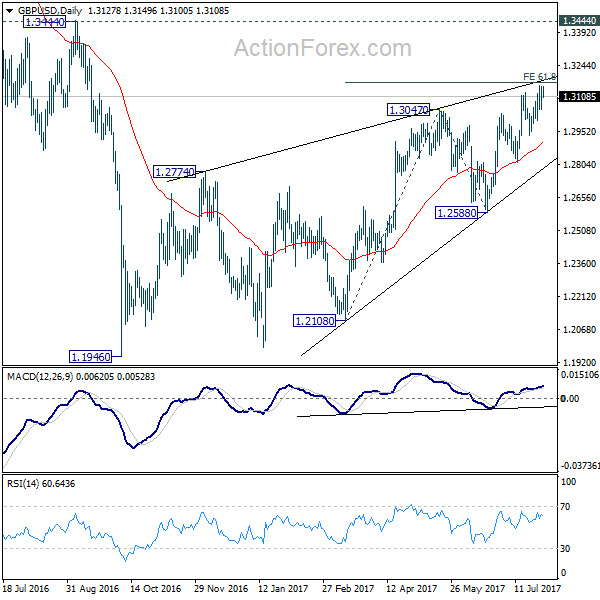
No change in GBP/USD's outlook. Price actions from 1.1946 are seen as a corrective pattern. Considering bearish divergence condition in 4 hour MACD, we'd stay cautious on strong resistance from 61.8% projection of 1.2108 to 1.3047 from 1.2588 at 1.3168 to limit upside. Break of 1.2932 support will be the first sign of reversal and will turn bias to the downside to target 1.2588 key support next. Though, sustained break of 1.3168 will bring further rise towards 1.3444 before completing the correction.
In the bigger picture, overall, price actions from 1.1946 medium term low are seen as a corrective pattern that is still in progress. While further upside is expected, larger outlook remains bearish as long as 1.3444 key resistance holds. Down trend from 1.7190 (2014 high) is expected to resume later after the correction completes. And break of 1.2588 will indicate that such down trend is resuming.