Sample Category Title
USD/CHF Daily Outlook
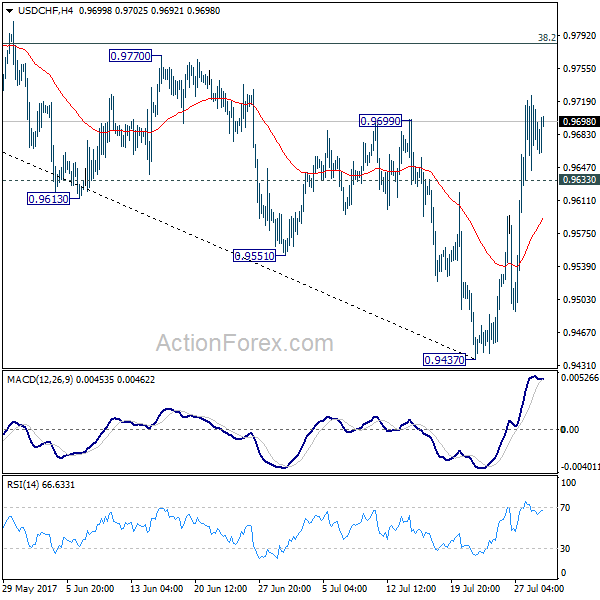
Daily Pivots: (S1) 0.9637; (P) 0.9682; (R1) 0.9730; More...
With 0.9633 minor support intact, intraday bias in USD/CHF remains on the upside for further rise. Prior break of 0.9699 resistance suggests near term reversal after defending 0.9443 key support. Further rally should be seen to 38.2% retracement of 1.0342 to 0.9437 at 0.9783 first. Break will target channel resistance (now at 0.9899). On the downside, below 0.9633 minor support will turn intraday bias neutral and bring consolidations first.
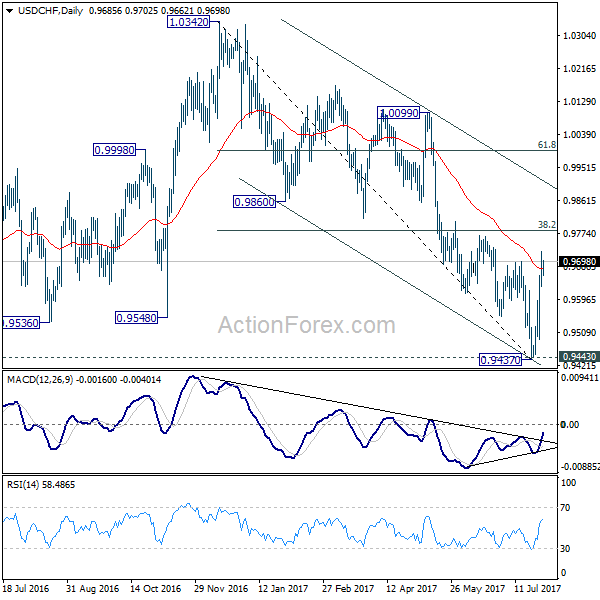
In the bigger picture, current development argues that USD/CHF has successfully defended 0.9443 key support level. And long term range trading in 0.9443/1.0342 is extending with another rise. At this point, there is no sign of an up trend yet. Hence, while further rise is expected in USD/CHF, we'll start to be cautious on loss of momentum above 61.8% retracement of 1.0342 to 0.9437 at 0.9996.
Trade Idea: EUR/JPY – Stand aside
EUR/JPY - 129.91
Recent wave: wave v of (C) ended at 94.12 and major correction in wave A has ended at 149.79
Trend: Near term up
New strategy :
Stand aside
Position: -
Target: -
Stop:-
As the single currency has retreated after faltering below indicated resistance at 130.61 late last week, retaining our view that further consolidation below recent high at 130.77 would be seen and pullback to 129.45-50 is likely, however, reckon downside would be limited to 129.20-25 and 128.49-57 support should hold, bring another rise later.
On the upside, above 130.61 would bring retest of said resistance at 130.77 but break there is needed to confirm recent upmove has resumed and bring further gain to 131.00-10, above there would encourage for headway to 131.50, however, loss of upward momentum should prevent sharp move beyond latter level and reckon 132.00 would hold from here, risk from there is seen for a retreat later.
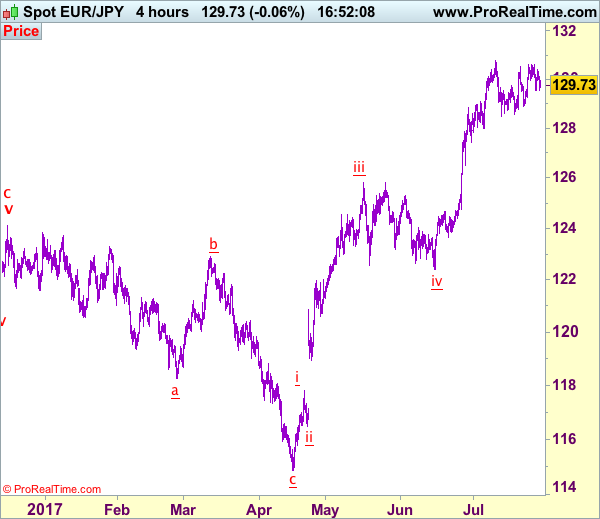
Our latest preferred count is that wave (ii) is ABC-X-ABC which ended at 123.33 and wave (iii) is unfolding with wave iii ended at 100.77, followed by wave iv at 111.57 and wave v as well as the wave (iii) has ended at 97.04, followed by wave (iv) at 111.43 and wave (v) has ended at 94.12 which is also the end of the larger degree v, this also implied the major wave (C) has also ended there, hence major correction has commenced from there with (A) leg unfolding in its lower degree wave c which has possibly ended at 145.69. Under this count, A-B-C wave (B) has commenced with A leg ended at 136.23, wave B at 143.79 and wave C has possibly ended at 149.79.
Our larger degree count is that the decline from 139.26 is wave (C) and is sub-divided into a diagonal triangle i-ii-iii-iv-v with wave i - 105.44, wave ii- 123.33, wave iii - 97.03, wave iv - 111.43, followed by the final wave v as well as the end of wave (C) at 94.12, this also mark the bottom of larger degree wave B. Under this count, major rise in wave C has commenced as an impulsive wave with minor wave III ended at 145.69, wave V is still in progress for further gain to 150.00. Having said that, this so-called wave V could well be the first leg of larger degree 5-waver wave C and this wave C should bring at least a retest of wave A top at 169.97 (July 2008).
EUR/USD Analysis: Trades Around 1.1731
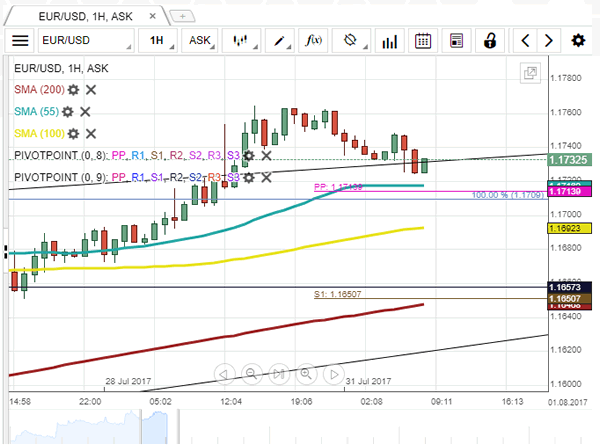
Beginning of new trading week the currency rate started above multiple technical indicators, such as the 100% Fibonacci retracement level, the updated weekly PP and the 55-hour SMA at 1.1716. To certain extent, this is a result of announcement of the US Federal Funds Rate and Advance GDP last week. Due to the fact that the road downstairs is blocked by the above combined support level, the pair has no other choice that continue to climb towards the updated weekly R1 located at the 1.1815 level. Such scenario falls in line with the rising wedge theory, whose lower support line moves along the 55- and 100-hour SMAs. If the rate reaches the above resistance level, it might give an impulse strong enough to exit the existing formation and approach the bottom boundary of the channel.
GBP/USD Analysis: Tends To Reach Monthly R1
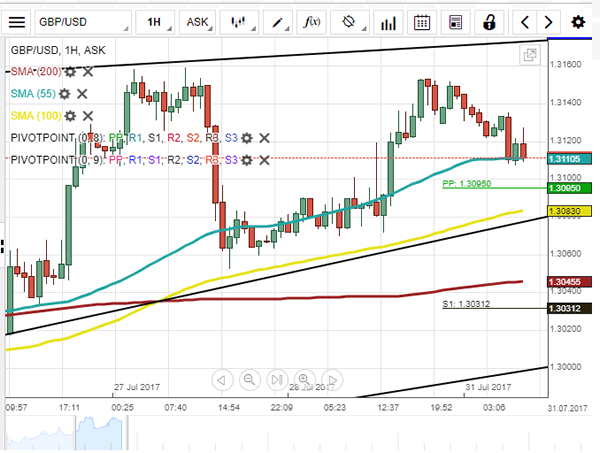
The currency exchange rate continues to gradually climb upstairs in a rising wedge pattern. More specifically, the first week of August the pair started in a limbo between the upper trend-line from the top and a combination of the 20- and 55-hour SMAs as well as the weekly PP from the bottom. In the upcoming hours this barrier should become additionally strengthened by the approaching 100-hour SMA. For this reason, the rate is expected not to fall below the 1.3095 level. Since there are also no important data releases today, the pair should continue to move towards the pattern's northern boundary. William's fractals suggest that the surge might be stopped already near the 1.3160 mark, which, in turn, would lead to formation of a short-term ascending triangle.
USD/JPY Analysis: Leaves Symmetrical Triangle
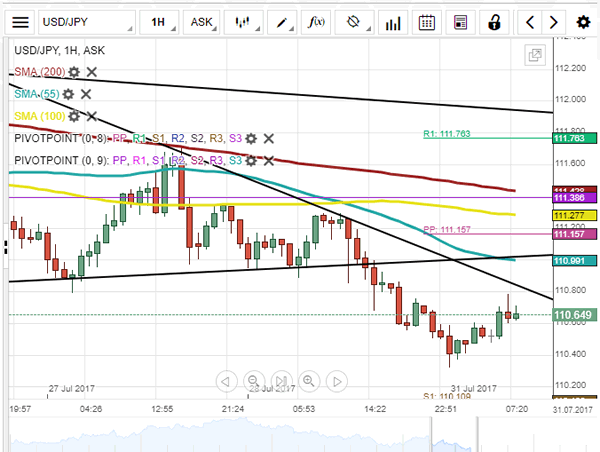
In accordance with expectations, boundaries of a symmetrical triangle proved to be not strong enough to confine the falling Greenback shortly after announcement of the US Advance GDP. However, the fact that the drop was neutralized already by closest support level set up by the weekly S1 at 110.48 indicates that it was not severe. That, in turn, allows assuming that the pair might successfully reach the combined resistance level formed by the 55-hour SMA and the updated weekly PP at 111.16. Given that the further road upstairs is blocked by the 100- and 200-hour SMAs as well as the monthly PP at 111.38, suggests the currency rate is going to make a rebound and begin to move to the south in line with the general downtrend.
XAU/USD Analysis: Surges To 1,270.93
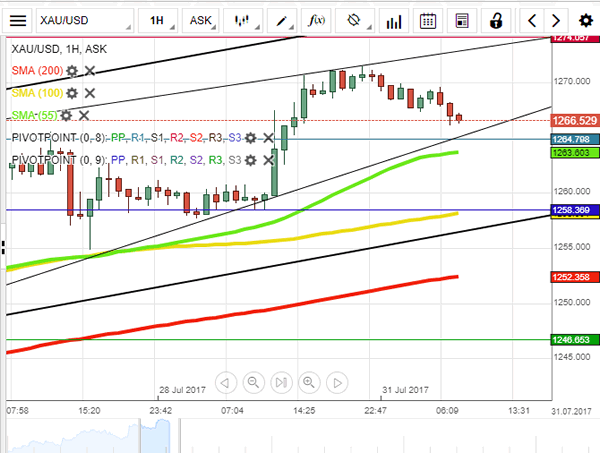
An announcement of the US Advance GDP last Friday resulted in a 0.76% increase of the yellow metal price. Nevertheless, the impulse given by this fundamental event in conjunction with the monthly PP at 1,258.37 was not enough to allow the rate to reach the upper trend-line of an ascending channel. In the beginning of Monday's trading session it made a rebound near the 1,270.93 level and started to move towards the updated weekly PP at 1,281.80, which is additionally secured by the 55-hour SMA. In order to stay in the channel, the pair needs to reach its southern boundary. If it fails to do so and rebounds from the above support level, this might be a sign of a formation of a rising wedge.
Trade Idea: AUD/USD – Buy at 0.7870 or sell at 0.8030
AUD/USD – 0.7973
Recent wave: Wave 5 ended at 1.1081 and major correction has commenced for fall to 0.7000 and then towards 0.6500-10
Trend: Near term up
Original strategy :
Buy at 0.7880, Target: 0.8080, Stop: 0.7820
O.C.O.
Sell at 0.8020, Target: 0.7880, Stop: 0.8080
Position: -
Target: -
Stop: -
New strategy :
Buy at 0.7880, Target: 0.8080, Stop: 0.7820
O.C.O.
Sell at 0.8030, Target: 0.7880, Stop: 0.8090
Position: -
Target: -
Stop:-
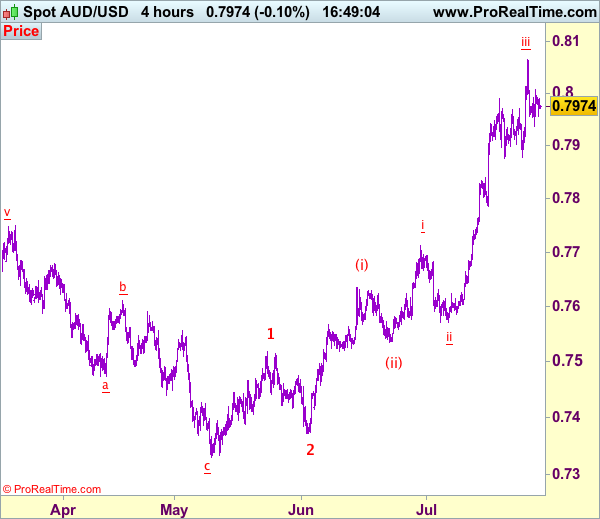
Aussie’s retreat after last week’s rally to 0.8066 suggests the wave iii top is possibly formed there and consolidation with mild downside bias is seen for correction in wave iv, hence weakness to 0.7900 is likely, however, reckon previous support at 0.7875-78 would hold and renewed buying interest should emerge there, bring another rise later. Above said resistance at 0.8066 would signal recent upmove is still in progress for headway to 0.8100, then 0.8140-50 but overbought condition should limit upside to 0.8190-00, bring retreat later. We are keeping our latest bullish count that recent impulsive waves is unfolding as (1 2, (i)(ii), i ii) and may extend headway to aforesaid upside targets.
In view of this, whilst we are looking to buy aussie on subsequent pullback, we would turn short on recovery as 0.8020-30 should limit upside. A sustained breach below support at 0.7875 would defer and risk correction to 0.7810-20, however, still reckon downside would be limited to 0.7786 and price should stay well above wave i top at 0.7712.
On the 4-hour chart, the move from 0.8066 is the wave 5 with i: 0.8860, ii: 0.8315, wave iii is an extended move ended at 1.0183, iv: 0.9706 and wave v has ended at 1.1081 (also the top of entire wave 5). The subsequent selloff is the major correction which is unfolding as ABC-X-ABC and 2nd A leg has ended at 0.8848, followed by a-b-c wave B which ended at 0.9758, hence, 2nd C wave is now in progress and indicated downside target at 0.7000 and 0.6950 had been met, so further fall to 0.6710-20 cannot be ruled out.
USD/JPY Daily Outlook
Daily Pivots: (S1) 110.36; (P) 110.84; (R1) 111.14; More...
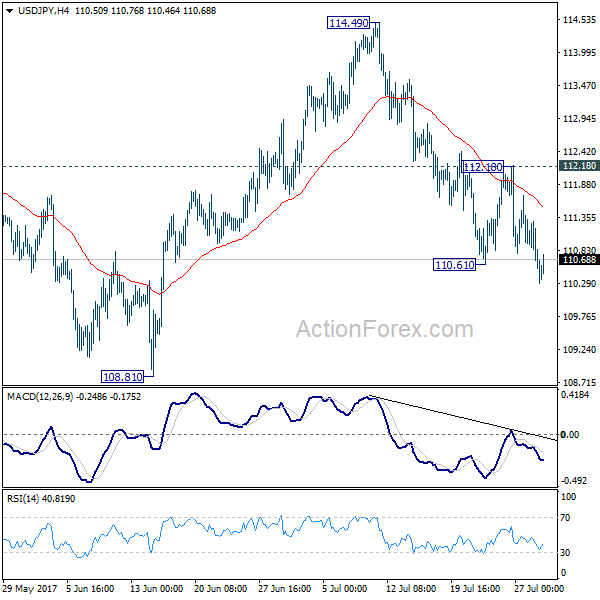
USD/JPY recovers mildly today but stays well below 112.18 resistance. Intraday bias remains on the downside for the moment. Current decline from 114.49 should extend to 108.81 support first. Break there will resume whole correction from 118.65 and target 61.8% retracement of 98.97 to 118.65 at 106.48. Nonetheless, break of 112.18 resistance will dampen this bearish view and turn focus back to 114.49 resistance instead.
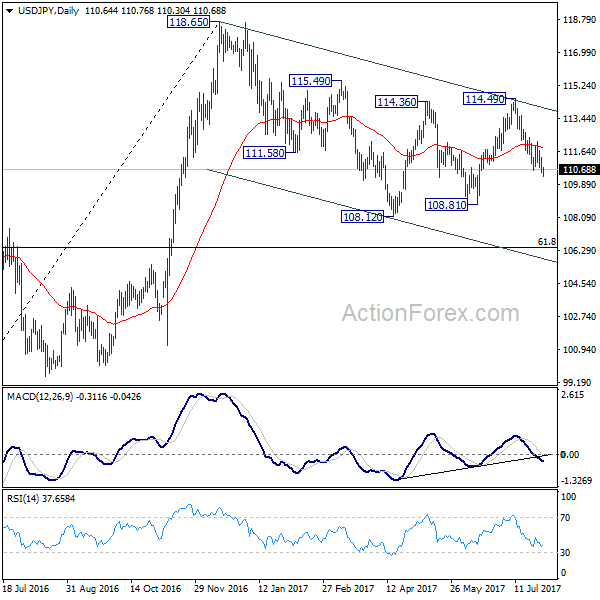
In the bigger picture, the corrective structure of the fall from 118.65 suggests that rise from 98.97 is not completed yet. Break of 118.65 will target a test on 125.85 high. At this point, it's uncertain whether rise from 98.97 is resuming the long term up trend from 75.56, or it's a leg in the consolidation from 125.85. Hence, we'll be cautious on topping as it approaches 125.85. If fall from 118.65 extends lower, down side should be contained by 61.8% retracement of 98.97 to 118.65 at 106.48 and bring rebound.
Political Uncertainty Limits Dollar’s Rebound, Busy Week ahead With RBA, BoE and NFP
Dollar recovers mildly today but momentum has been weak. There is no change in it's general down trend against Euro, Yen and Sterling. And, not the mention the greenback's weakness against Canadian and Aussie. Political uncertainty in US is one of the key factors in limiting any rebound attempt in the greenback. Fed fund futures are now pricing in less than 50% chance of another rate hike by end of the year. And indeed, markets are starting to question that even if Fed does hike, the sluggish inflation outlook will keep it standing pat next year. The drama in the White House seems never-ending with US President Donald Trump replacing his chief of staff Reince Priebus last Friday. Retired General John Kelly was installed in the place. Some analysts noted that could be a turning point for Trump as he's now shaking up his top team.
Russia orders 755 US diplomats to leave
Meanwhile, Russian President Vladimir Putin said on Sunday that he ordered US to cut diplomatic staff in the country. Putin said that was a response to the "illegal restrictions" imposed by US. That came days after US Congress passed a new round of sanctions for punishing Russia for interfering in last year's election and military agrees in Ukraine and Syria. It's initially reported that Russia asked 755 US diplomats to go. And after that, the total number of American diplomats in Russia will be brought down to 455, same as Russian diplomats in US.
Non-farm payroll not likely to help Dollar
There are a number of important economic data from US this week, including ISM indices and non-farm payroll. While the data will be watched closely as usual, we believe it's unlikely to revive the expectation of faster Fed tightening even if it posts strong upside surprises. The key to Fed's policy will still lie on the implementation of Trump's fiscal policies and tax reforms. Without that, markets will continue to doubt whether the US economy can withstand another more rate hikes. On the other hand, we could very likely see another round of selloff in the greenback if NFP disappoints.
ECB Lautenschlaeger: It's important to prepare for the exit in good time
In Eurozone, ECB governing council member Sabine Lautenschlaeger said in a newspaper remarks that "the expansionary monetary policy has both advantages and side effects. As time passes, the positive effects get weaker and the risks increase." And, she urged that "it's important to prepare for the exit in good time." But she noted that "what's crucial in that context is a stable trend in the rate of inflation towards our objective of just under 2 percent. It's not quite there yet."
Released today...
Official China PMI manufacturing dropped to 51.4 in July, down from 51.7 and missed expectation of 51.5. Official non-manufacturing PMI dropped to 54.5, down from 54.9. Japan industrial production rose 1.6% mom in June, housing starts rose 1.7% yoy. New Zealand building permits dropped -1.0% mom in June. Australia TD securities inflation rose 0.1% mom in July.
In European session, German retail sales rose 1.1% mom in June. UK will release mortgage approvals an M4 money supply. Eurozone CPI will be a key focus and unemployment rate will also be featured. Canada will release IPPI and RMPI later in the day while US will release pending home sales.
RBA and BoE watched closely ahead too
While there are a number of key events ahead, RBA rate decision will be the first one to watch. The RBA meeting due tomorrow would bring no change in the monetary policy. However, the central bank's "neutral rate" rhetoric gave Aussie a boost. At the July meeting minutes, RBA noted that neutral nominal cash rate is currently at around 3.5%, "given that medium-term inflation expectations were well anchored around 2.5%, although there is significant uncertainty around this estimate". We would like to see if policymakers do any tweak or elaboration on such reference this week. RBA's Monetary Policy Statement due on Friday would provide update economic forecasts.
BoE Super Thursday will be another key focus. It would be of great interest to see how policymakers vote for the policy, after the 5-3 split (Ian McCafferty, Kristin Forbes and Michael Saunders voting for a rise) in June. The dilemma facing the UK is overshooting inflation on one side and lackluster economic growth together with great uncertainty in Brexit negotiation on the other side. The July inflation report show moderation on the price level the headline reading stayed above the BoE's 2% target. UK's 2Q17 GDP grew 0.3% with the first half growth regarded as "notable slowdown" by the government. We believe the Bank rate would stay unchanged at 0.25%. BoE's quarterly inflation report would also be released alongside the meeting minutes.
Here are some more highlights for the week ahead:
- Tuesday: RBA rate decision; China Caixin PMI manufacturing; Eurozone GDP, PMI manufacturing revisions; UK PMI manufacturing; US personal income and spending, ISM manufacturing
- Wednesday: New Zealand employment; Australia building approvals, Japan consumer confidence; Swiss retail sales, SVME PMI; Eurozone PPI; US ADP employment
- Thursday: Australia trade balance; Eurozone retail sales, PMI services revision, ECB bulletin; UK PMI services, BoE rate decision; US jobless claims, ISM services, factory orders
- Friday: Australia retail sales; Japan labor cash earnings; German factory orders; Canada trade balance, employment, Ivey PMI; US non-farm payrolls, trade balance
USD/JPY Daily Outlook
Daily Pivots: (S1) 110.36; (P) 110.84; (R1) 111.14; More...
USD/JPY recovers mildly today but stays well below 112.18 resistance. Intraday bias remains on the downside for the moment. Current decline from 114.49 should extend to 108.81 support first. Break there will resume whole correction from 118.65 and target 61.8% retracement of 98.97 to 118.65 at 106.48. Nonetheless, break of 112.18 resistance will dampen this bearish view and turn focus back to 114.49 resistance instead.
In the bigger picture, the corrective structure of the fall from 118.65 suggests that rise from 98.97 is not completed yet. Break of 118.65 will target a test on 125.85 high. At this point, it's uncertain whether rise from 98.97 is resuming the long term up trend from 75.56, or it's a leg in the consolidation from 125.85. Hence, we'll be cautious on topping as it approaches 125.85. If fall from 118.65 extends lower, down side should be contained by 61.8% retracement of 98.97 to 118.65 at 106.48 and bring rebound.
Economic Indicators Update
| GMT | Ccy | Events | Actual | Forecast | Previous | Revised |
|---|---|---|---|---|---|---|
| 22:45 | NZD | Building Permits M/M Jun | -1.00% | 7.00% | 6.90% | |
| 23:50 | JPY | Industrial Production M/M Jun P | 1.60% | 1.50% | -3.60% | |
| 1:00 | AUD | TD Securities Inflation M/M Jul | 0.10% | 0.10% | ||
| 1:00 | CNY | Manufacturing PMI Jul | 51.4 | 51.5 | 51.7 | |
| 1:00 | CNY | Non-manufacturing PMI Jul | 54.5 | 54.9 | ||
| 5:00 | JPY | Housing Starts Y/Y Jun | 1.70% | 0.10% | -0.30% | |
| 6:00 | EUR | German Retail Sales M/M Jun | 1.10% | 0.20% | 0.50% | |
| 8:30 | GBP | Mortgage Approvals Jun | 65K | 65K | ||
| 8:30 | GBP | M4 Money Supply M/M Jun | 0.20% | -0.10% | ||
| 9:00 | EUR | Eurozone Unemployment Rate Jun | 9.20% | 9.30% | ||
| 9:00 | EUR | Eurozone CPI Estimate Y/Y Jul | 1.30% | 1.30% | ||
| 9:00 | EUR | Eurozone CPI - Core Y/Y Jul A | 1.10% | 1.10% | ||
| 12:30 | CAD | Industrial Product Price M/M Jun | -0.20% | |||
| 12:30 | CAD | Raw Materials Price Index M/M Jun | -1.80% | |||
| 14:00 | USD | Pending Home Sales M/M Jun | 1.00% | -0.80% |
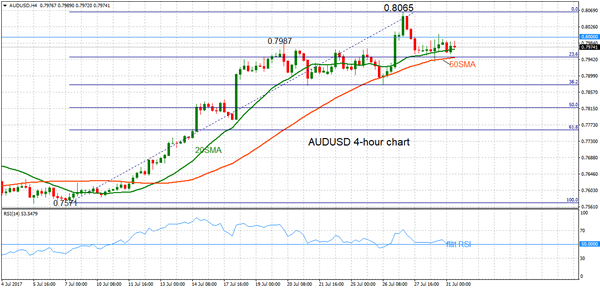
AUDUSD Shifts To Neutral After Rally To 2-Year High
AUDUSD has a neutral bias after pausing a rally that took the pair to a high of 0.8065 on July 27. This is the highest level since May 2015. The underlying market structure is bullish after a sharp rise from the July 7 low of 0.7571. Looking at the 4-hour chart, upside momentum has faded as indicated by the flat RSI. Consequently, AUDUSD is trading sideways within a range.
The key psychological level at 0.8000 is now a strong resistance level broadly holding so far even though it was pierced last week. AUDUSD closed below 0.8000 on July 28. Support is provided by the 50-period moving average (MA). This is close to a Fibonacci level at 0.7947 (23.6% retracement of the upleg from 0.7571 to 0.8065). Further support is provided by subsequent Fibonacci levels at 0.7875, 0.7816 (July 26 low) and 0.7759.
Prices need to rise above the key 0.8000 level to move out of the range and weaken downside pressure. From this level, AUDUSD would see a re-test of the 0.8065 high and a break of this would see a resumption of the uptrend.
The positively aligned moving averages are supporting a bullish outlook in the short-term. There was a bullish crossover of the 20-period MA with the 50-period one on July 12.
There has been no confirmation of a trend reversal yet and the current consolidation pattern could be a temporary pause before the uptrend resumes. For now, the bias remains neutral on the 4-hour chart, with high odds of a shift to bullish if there is a daily close above 0.8000.