Sample Category Title
Daily Technical Analysis: GBPUSD Uptrend Continuation If The Price Stays Above 1.3060
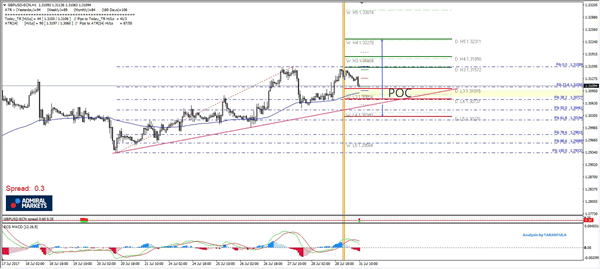
The GBP/USD is in uptrend and we can see the POC zone clearly below the price. The POC 1.3075-1.3100 might look a bit stretched but that happens due to many individual confluence points that are found within the zone – W L3, ATR pivot, D L3, trend line, EMA89, 38.2 fib + ATR (14) has slightly increased. If we see a retracement in the zone, the price might bounce towards 1.3157 and 1.3180. Only above 1.3180 we will see another bullish wave towards 1.3230. As long as the price stays above 1.3060 bulls will have the upper hand, else below 1.3060, short term stops might be triggered so 1.3025 will be possible.
W L3 - Weekly Camarilla Pivot (Weekly Interim Support)
W H3 - Weekly Camarilla Pivot (Weekly Interim Resistance)
W H4 - Weekly Camarilla Pivot (Strong Weekly Resistance)
D H4 - Daily Camarilla Pivot (Very Strong Daily Resistance)
D L3 – Daily Camarilla Pivot (Daily Support)
D L4 – Daily H4 Camarilla (Very Strong Daily Support)
POC - Point Of Confluence (The zone where we expect price to react aka entry zone)
EUR/USD Candlesticks and Ichimoku Analysis
Weekly
• Last Candlesticks pattern: Shooting star
• Time of formation: 03 May 2016
• Trend bias: Down
Daily
• Last Candlesticks pattern: Shooting star
• Time of formation: 3 May 2016
• Trend bias: Sideways
EUR/USD – 1.1648
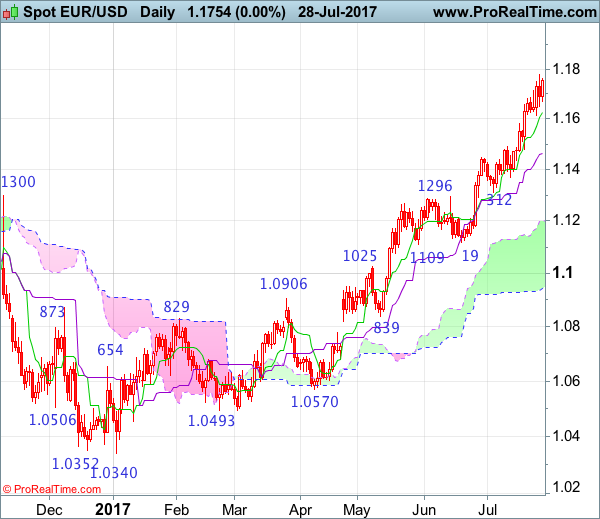
The single currency only eased to 1.1613 before rising again, adding credence to our bullish view that recent upmove is still in progress and price already exceeded indicated upside targets at previous chart resistance at 1.1714, bullishness remains for medium term upmove to extend further gain to 1.1800-10, break there would encourage for headway to 1.1870-80 but near term overbought condition should limit upside and price should falter below 1.1900-10, bring retreat later.
On the downside, whilst initial pullback to 1.1650 and possibly the Tenkan-Sen (now at 1.1628) cannot be ruled out, reckon 1.1583 (previous resistance turned support) would limit downside and bring another upmove to aforesaid upside targets. Below 1.1530-35 would suggest a temporary top is possibly formed and risk test of the Kijun-Sen (now at 1.1475) but a daily close below there is needed to add credence to this view, bring correction to 1.1400 and possibly test of support at 1.1370.
Recommendation: Buy at 1.1590 for 1.1790 with stop below 1.1490.
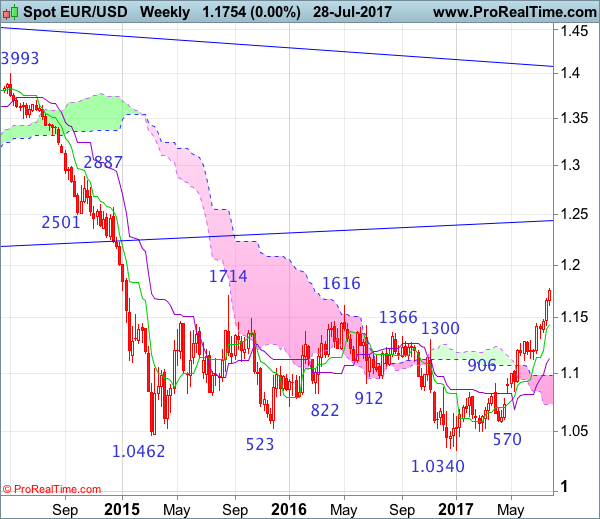
On the weekly chart, as euro has eased after meeting resistance at 1.1777 last week, suggesting minor consolidation would be seen and pullback to 1.1650 and possibly towards support at 1.1613 cannot be ruled out, however, previous resistance at 1.1583 should limit downside and bring another rise later, above said resistance at 1.1777 would extend gain to 1.1800-10, then 1.1870-80, having said that, near term overbought condition should limit upside to 1.1940-50 and price should falter below 1.2000, risk from there is seen for a retreat later.
On the downside, although pullback to 1.1650 and then 1.1613 is likely, reckon 1.1583 (previous resistance turned support) would contain downside and bring another rise later. Below 1.1490-00 would defer and risk test of the Tenkan-Sen (now at 1.1448) but a weekly close below there is needed to suggest a temporary top is possibly formed, bring correction to support at 1.1370, break there would provide confirmation and extend weakness towards 1.1312 support.
AU Inflation Hits 2.7% | RBA In Focus | GBPAUD
The monthly read of CPI suggests a rosier outlook than the official quarterly read, although at 0.1% MoM this too may soften over the coming months. The RBA is in focus tomorrow to see if a fresh round of jawboning ensues.
Inflation data for Q2 was met with some scepticism, although we prefer to look at the brighter side of it. Yes, broad CPI softened and missed expectations yet the trimmed and weighted mean remained steady and hot the consensus. It is these latter CPI reads the RBA takes more notice of and as they have stabilised at record lows it does raise the potential for a base to occur.
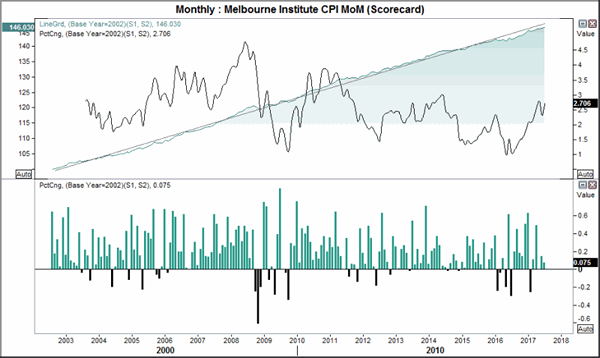
Today the Melbourne Institute released their monthly inflation read which estimates CPI to be at 2.7% YoY and 0.1% MoM. This is the third consecutive month below 0.2% which suggests the YoY rate will soften in due course unless the underlying index spikes higher.
Private sector credit increased by 0.5% MoM, its highest level since December which suggests support for growth and inflation. It is making headway after declining to just 0.2% in January, although seasonality is likely at play here.
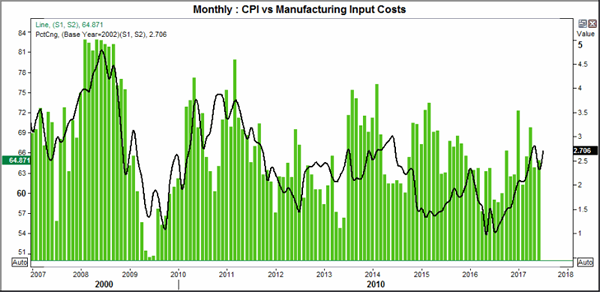
Early tomorrow AiG release their manufacturing PMIs. Currently at 55, the index sits above the 1yr average and the sector has enjoyed 9 consecutive months of expansion. We will keep an eye on the input costs as this tends to track CPI relatively well. So, a rise of input costs assumes this to be passed onto the consumer and therefor provide cost-push inflation.
Private sector credit increased by 0.5% MoM, its highest level since December which suggests support for growth and inflation. It is making headway after declining to just 0.2% in January, although seasonality is likely at play here.
Early tomorrow AiG release their manufacturing PMIs. Currently at 55, the index sits above the 1yr average and the sector has enjoyed 9 consecutive months of expansion. We will keep an eye on the input costs as this tends to track CPI relatively well. So, a rise of input costs assumes this to be passed onto the consumer and therefor provide cost-push inflation.
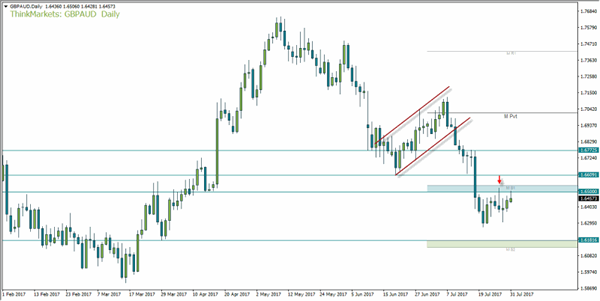
GBPAUD remains beneath the monthly S1 and 1.65 resistance zone. The upper wick of Wednesdays' bearish pinbar remains unchallenged, so we are seeking signs of weakness on H1 and H4 to consider a bearish swing trade. If we are to see prices move higher from here we can still consider fading below 1.66. It's possible we may see an ABC correction terminate here before losses resume.
As this is the last trading day of the month the pivots will be recalculated. So we can finetune potential targets from tomorrow, although the 1.62 area is still viable support as it is just above the 30th March low.
USD/JPY Candlesticks and Ichimoku Analysis
Weekly
• Last Candlesticks pattern: Marubozu
• Time of formation: 14 Nov 2016
• Trend bias: Down
Daily
• Last Candlesticks pattern: Shooting star
• Time of formation: 15 Feb 2017
• Trend bias: Down
USD/JPY – 110.65
The greenback did meet renewed selling interest at 112.20 last week (we recommended to sell dollar at 112.00 and a short position was entered) and has fallen again since, adding credence to ur bearish view that decline from 114.50 is still in progress and downside bias remains for this move to extend weakness to 110.00, having said that, as broad outlook remains consolidative, reckon downside would be limited to 109.40 and said support at 108.82 should remain intact.
On the upside, whilst initial recovery to the Tenkan-Sen (now at 111.37) cannot be ruled out, reckon upside would be limited and resistance at 111.71 would hold, bring another decline later. A daily close above said resistance at 111.71 would defer and risk test of 112.20 but break there is needed to signal the aforesaid decline from 114.50 has ended, bring a stronger rebound to 112.85-90 first.
Recommendation : Hold short entered at 112.00 for 110.00 with stop lowered to 111.75.

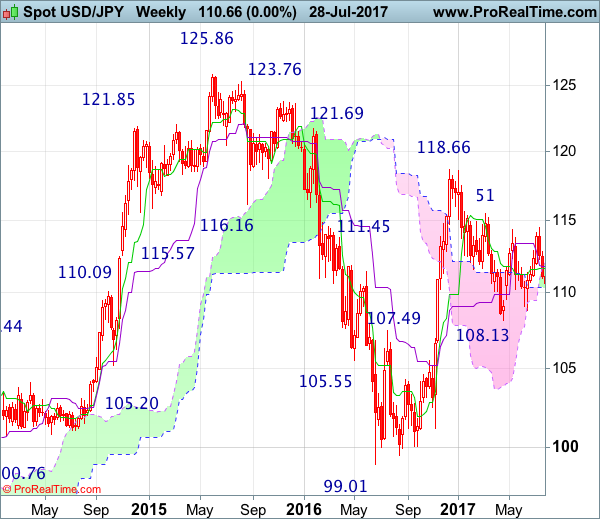
On the weekly chart, as dollar has remained under pressure after brief bounce to 112.20 last week, adding credence to our view that top has been formed at 114.50 and consolidation with downside bias remains for weakness to 110.00, then 109.40, however, reckon 108.82-84 (previous support as well as current level of the lower Kumo) would limit downside and price should stay well above support at 108.13, bring recovery later.
On the upside, although recovery to 111.10-20 cannot be ruled out, reckon the Tenkan-Sen (now at 111.66) would limit upside and bring another decline later. Only above said resistance at 112.20 would signal the retreat from 114.50 has possibly ended, bring a stronger rebound to 112.42, then towards 113.00, however, reckon upside would be limited to 113.55-60 and price should falter well below said resistance at 114.50. Only a break above 114.50 would signal the rebound from 108.13 is still in progress for gain towards resistance at 115.51 but a weekly close above there is needed to signal the fall from 118.66 top has ended at 108.13, then headway to 116.00-10 would follow but resistance at 117.53 should hold from here.
Top World Economies Expand, But Arising Geopolitical Risks Take Stage In Forex Markets
The US dollar gained during the Asian session, with the dollar index up 0.20% to last trade at 93.44. The session was busy with ample of data from Asian economies signaling economic expansion. The euro and sterling declined against the US currency. Oil prices rose while gold gave up on some of Friday's significant gains.
Data signalling the latest economic activity in China was the main news of the day. While activity in the world's second largest economy continued to expand, as the official PMI remained above the 50-point mark, the pace of growth slowed in July. At 51.4, the official manufacturing PMI narrowly missed estimates of 51.6 and was below the prior month's 51.7. However, due to expanding government investment projects the construction industry boomed, lifting investors' confidence. The construction sector remained robust with the PMI reading showing a pickup to 62.5 from 61.4 in June. This further spurred demand for steel, cement and other building materials.
The news out of China came as investors were trying to gauge global growth with US second quarter GDP showing steady expansion at 2.6% according to data released on Friday and Japan's monthly industrial production rebounding from a 3.6% decline to a 1.6% gain in June, based on the preliminary figures released earlier today. Dollar/yen was last trading at 110.68.
While the world's top three economies are showing positive momentum, the geopolitical risks have induced investor worries again. Russia has ordered the US to withdraw a large percentage of its diplomats that are currently serving in Russia, following the new sanctions on Russia that US Congress approved last week. Further to this, North Korea tested another intercontinental ballistic missile for the second time in weeks.
New Zealand winter months took a toll on business confidence there with sentiment cooling down in July to 19.4% from 24.8% in June. Rising construction costs and labor skill shortages contributed to lower optimism, but recovery in dairy prices provided some support. Tempered business sentiment is usual during winter months in New Zealand hence the country's currency didn't take much notice of the drop in sentiment. Kiwi/dollar rose slightly following the data release, but traded lower around the 0.7499 mark in the late Asian session to be broadly flat on the day. The labor report due on Wednesday could strengthen the kiwi against its US counterpart should the report show tightening employment activity.
While sales of new homes in Australia plunged last month to the lowest since 2013, the aussie rose against the greenback following the news. New home sales fell 6.9% in June from May, reversing two months of gains. However, this release was not of interest to forex traders as China PMI data was published at the same time, which pushed the aussie up. Aussie/greenback was last slightly up at 0.7978 ahead of the European session.
The euro was slightly weaker against the greenback during the Asian session to last trade at $1.1733. Traders will be closely monitoring the release of the flash CPI figure for July for the eurozone, today at 9:00 GMT.
Sterling was also under some pressure against the greenback today, with pound/dollar last trading at 1.3110.
Looking at commodities, oil prices gained, hitting a two-month high on a tighter US market and possible sanctions against Venezuela. WTI was last trading at $49.88 a barrel while Brent was at $52.76. Gold on the other hand declined during the session to last trade at $1,266.80 an ounce.
USDJPY Shifts To Bearish After Break Below 50-Day Moving Average
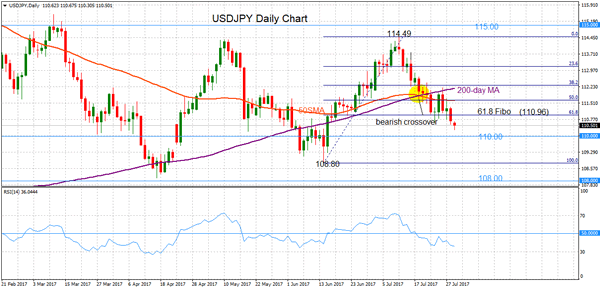
USDJPY shifted to a more bearish bias after falling below the 50-day moving average. The market is also trading below the 61.8% Fibonacci retracement level of the upleg from 108.80 to 114.49 (June 14 to July 11 rise) – this corresponds to the 110.96 level.
Risk remains to the downside in the short-term as the RSI is below 50 and sloping downwards. Meanwhile, the 50-day MA crossed below the 200-day MA on July 18, giving a bearish signal.
The immediate target to the downside is at the psychological level of 110.00. A break below this support level would target the June 14 low of 108.80, resulting in a complete reversal of the uptrend that took place from this 108.80 low to the 114.49 high. Such a move would open the way to the April 17 low of 108.12. From here, the bearish bias would strengthen.
To the upside, the previous support-turned-resistance and Fibonacci level at 110.96 would act as a barrier to any bounces higher. A break above the 50% Fibonacci and 50-day MA at 111.63 would weaken the bearish bias and target 112.30 and 113.13 before reaching the 114.49 high.
The short-term bearish phase remains strong below the 50-day and 200-day MA. The medium-term picture remains neutral unless there is a breakout above 115.00 or below 108.00.
CBR Keeps Rates Unchanged, Unconvincingly
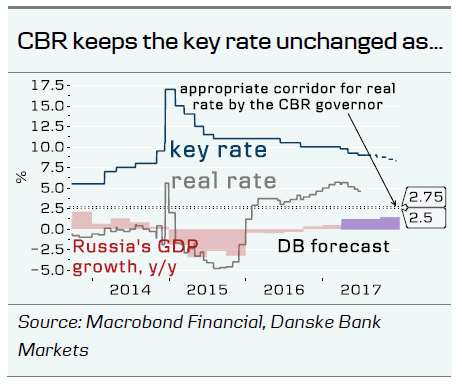
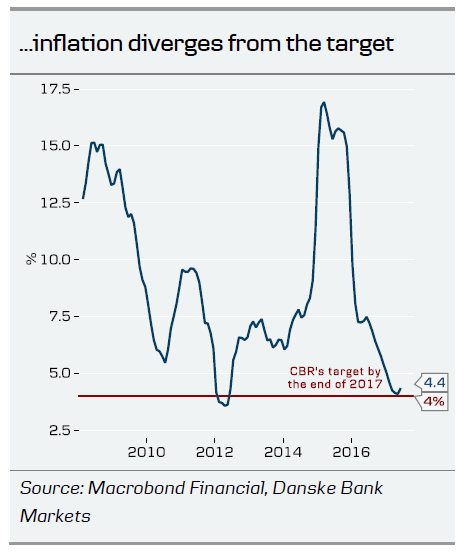
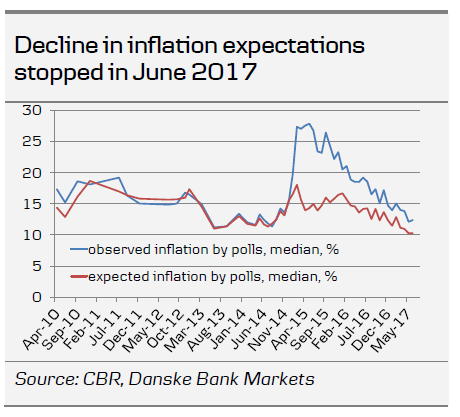
- Russia's central bank (CBR) kept its key rate unchanged at 9.00% on 28 July, as new geopolitical risks have emerged, inflation has diverged from the CBR's target and the decline in inflation expectations has halted.
- We expect the CBR to cut to 8.25% by the end of 2017 (8.00% previously), given no geopolitical 'black swans' or crude price crush.
- Russia's economy continues to deliver positive surprises despite moderately tight monetary policy.
Assessment and outlook
The CBR kept its key rate unchanged at 9.00% on 28 July. Bloomberg consensus has shifted towards 'unchanged' over the past two weeks, while we continued to be in the minority expecting a 25bp cut. However, in CBR Rate Decision Preview: We pencil in a cautious cut, 24 July, we did not exclude the central bank becoming overcautious and keeping rates on hold.
Reading the CBR's latest statement on the decision, its tone is not convincing enough on why it left rates unchanged. As the CBR had reiterated that the recent rise in inflation and its effects are seasonal and temporary, we link today's decision primarily to the risk of a further deterioration in the geopolitical environment surrounding Russia, including the recent approval by both houses of the US Parliament of a new heavily anti-Russia bill, Germany calling for new anti-Russia sanctions on the recent delivery of turbines to Crimea and today's tit-for-tat response by Russia's Ministry of Foreign Affairs.
Main assumptions behind today's decision
'Inflation remains close to the target'. Annual inflation increased to 4.4% y/y in June, up from 4.1% y/y in May, on an increase in fruit and vegetable prices. Yet, we do not find convincing the inflation argument for keeping rates unchanged, as the CBR said it sees no material risks from prices that are up on seasonal factors, causing a halt in the decline in inflation expectations.
'Interest rates on loans have declined but their level supports moderate demand for borrowing'. We conclude this is another assumption that supports more dovish monetary policy than today's rate decision.
'The economic activity is rebounding'. This factor gives the CBR room for its caution, as Russia's economy continues to surprise positively despite moderately tight monetary policy.
Elevated geopolitical risks and exchange rate dynamics 'may have negative implications for inflation expectations'. In our view, this is the most important point behind today's decision, even if the CBR lists it far below other reasons in its statement.
We expect the CBR to cut the key rate by 25bp at its monetary policy meeting on 15 September 2017, while sudden geopolitical deterioration and an oil price fall are major risks for our dovish call. Given the slight change in the CBR's easing path, we raise our key rate projection for the end of 2017 to 8.25%, from 8.00% previously.
Economy recovers despite high rates
We do not believe the slowdown in the monetary easing path is affecting Russian economic growth in H2 17. Russia's GDP growth accelerated from 0.5% y/y in Q1 17 to 2.7% y/y in Q2 17, according to Russia's economy minister Maxim Oreshkin. In H1 17, GDP growth climbed to 1.6% y/y and the minister said the current trend implies upside risk to the ministry's current estimate of 2% y/y for 2017. This is a very preliminary estimate, which we expect Russia's statistic service Rosstat to revise many times.
The Ministry for Economic Development (Minecon's) recent statement sounds positively surprising to us. Yet, there are reasons behind the statement: the average crude price was 8% higher in Q2 17 than in Q2 16, industrial production growth has been steady due to changes in economic structures, rates have been falling on lower inflation and private consumers saw a recovery.
Our 2017 GDP forecast has stayed unchanged for a record period, since spring 2016, at 1.2% y/y. In our view, there is currently clear upside risk to our forecast, especially if the current geopolitical woes do not bring new 'black swans' to Russia's macro economy. We expect GDP to grow by 1.2% y/y in 2017 and 1.4% y/y in 2018.
RUB welcomes hawkish hold
The RUB reacted positively to the CBR's decision despite the consensus view on the rate, as yesterday we saw market pricing starting to lean towards a possible cut in weekly inflation, falling to zero, and crude price rising. We keep our moderately bullish stance on the RUB in the long term, supported by carry and rising oil price, expecting the USD/RUB to hit 57.10 in 6M and 55.00 in 12M.
Given the change in the CBR's path, Russia's local debt – OFZs – reacted slightly negatively to the decision. Yet, we expect a recovery as dovish surprises from the CBR are still possible in the autumn. However, OFZ demand may stall if new anti-Russia sanctions are signed by President Trump in coming weeks.
USD/CAD: Canadian GDP M/M
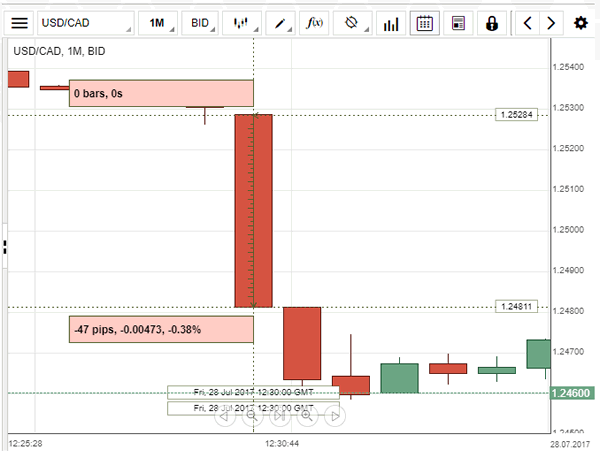
The USD/CAD currency pair dropped significantly, as the Canadian monthly GDP tripled forecasts in May. Right after the data release, the Loonie appreciated against the US Dollar by 47 base points, or 0.38%, to 1.2481. Moreover, the strength of the commodity-sensitive Canadian Dollar was additionally fuelled by higher oil prices. Statistics Canada reported on Friday that the country's real gross domestic product rose for the seventh month in succession, marking a 0.6% increase in May. The report showed expansion in 14 out of 20 sectors, with the strongest gains in goods-producing industries, which rose 1.6% for the month, supported by gas and oil extraction, mining and quarrying.
Trade Idea : USD/CHF – Buy at 0.9600
USD/CHF - 0.9685
Most recent candlesticks pattern : N/A
Trend : Near term down
Tenkan-Sen level : 0.9679
Kijun-Sen level : 0.9686
Ichimoku cloud top : 0.9644
Ichimoku cloud bottom : 0.9606
Original strategy :
Buy at 0.9600, Target: 0.9700, Stop: 0.9565
Position : -
Target : -
Stop : -
New strategy :
Buy at 0.9600, Target: 0.9700, Stop: 0.9565
Position : -
Target : -
Stop : -
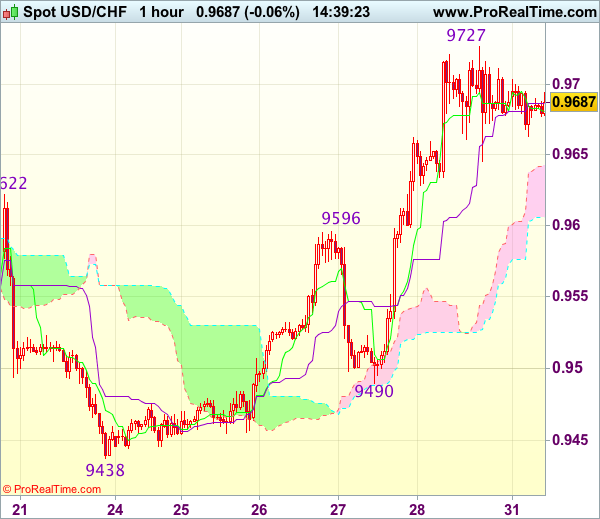
The greenback has traded narrowly after surging to as high as 0.9727 late last week, suggesting further consolidation below this level would be seen and initial downside risk remains for pullback to 0.9640-45, however, previous resistance at 0.9596 should turn into support and contain downside, bring another rise later, above said resistance at 0.9727 would extend recent rise to 0.9750-60, then 0.9780 but reckon 0.9800 would hold from here.
In view of this, would not chase this rise here and would be prudent to buy dollar on pullback as previous resistance at 0.9596 should turn into support and contain dollar’s downside. Below 0.9570 would defer and suggest a temporary top is formed instead, bring correction to 0.9560-70 and possibly 0.9540 but price should stay well above support at 0.9490, bring another rise later.
USDJPY: US Advance GDP Q/Q
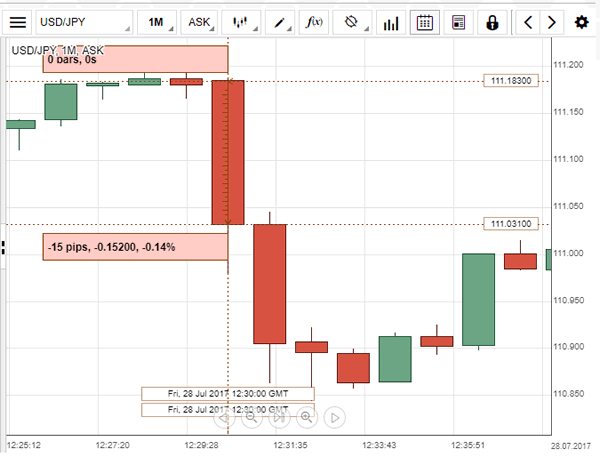
The US Dollar did not manage to appreciate against the Japanese Yen at the moment the data on the US advance GDP was released. The pair posted a 0.13% decline to hit the 111.03 mark and then went even slightly lower, though still managed to retreat slightly, with the exchange rate hovering around 111.00 for the day. The US Bureau of Economic Analysis reported on Friday the first release of the country's GDP for the second quarter rose at an annualised pace of 2.6% from the downwardly-revised reading of 1.2% in the prior quarter, in line with economists' projections. Still, despite the generally positive trend, Friday's data is overall unlikely to bolster any major shift in sentiment on the US economic performance.