
Sample Category Title
BITCOIN Sideways Price Action.
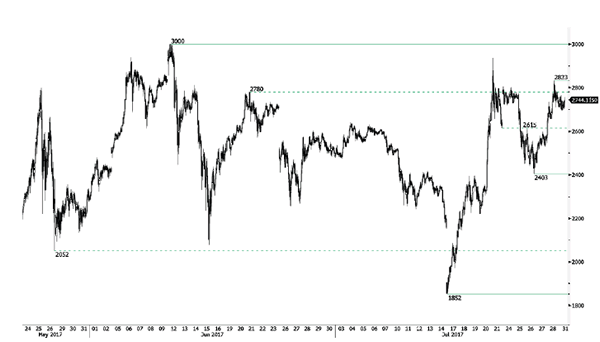
Bitcoin's volatility has declined. Strong resistance can be found at 3000 (12/06/2017 high) and hourly support lies at 2403 (26/07/2017 low). Further retracement are expected. For the time being, the cryptocurrency keeps on trading between 2700 and 2800
In the long-term, the digital currency has had an exponential growth. There are decent likelihood that the asset will consolidate above $1500. Long-term support is given at $1464 (04/05/2017 low).
EUR/CHF Consolidating Around 1.14
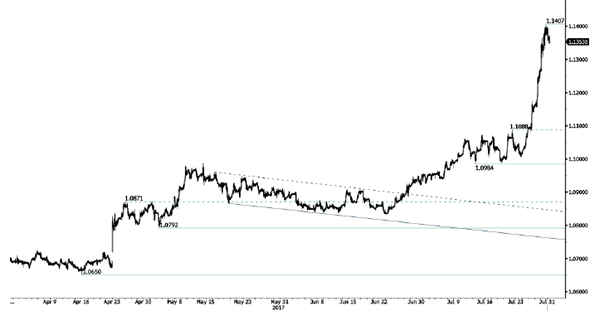
EUR/CHF's buying pressures are very important and is trading below 1.14. Hourly support is located at a distance at 1.0984 (13/07/2017 low). Road is wide-open for further strengthening.
In the longer term, the technical structure is mixed. Resistance can be found at 1.1200 (04/02/2015 high). Yet,the ECB's QE programme is likely to cause persistent selling pressures on the euro, which should weigh on EUR/CHF. Supports can be found at 1.0184 (28/01/2015 low) and 1.0082 (27/01/2015 low)
EUR/GBP Selling Pressures Are Weak
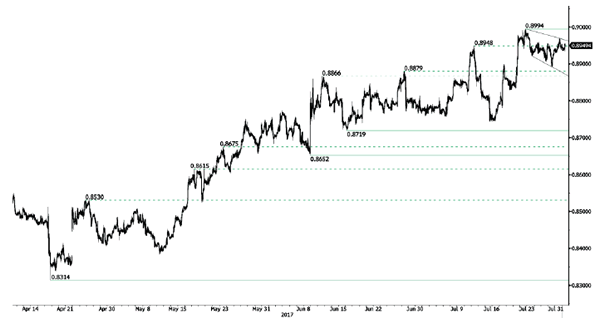
EUR/GBP is trading around its highest levels of the year. The pair is consolidating. Hourly support is given at a distance at 0.8742 (16/06/2017 low). Downside risks are nonetheless important.
In the long-term, the pair has largely recovered from recent lows in 2015. The technical structure suggests a growing upside momentum. The pair is trading above from its 200 DMA. Strong resistance can be found at 0.9500 psychological level.
AUD/USD Stalling Below 0.8000.
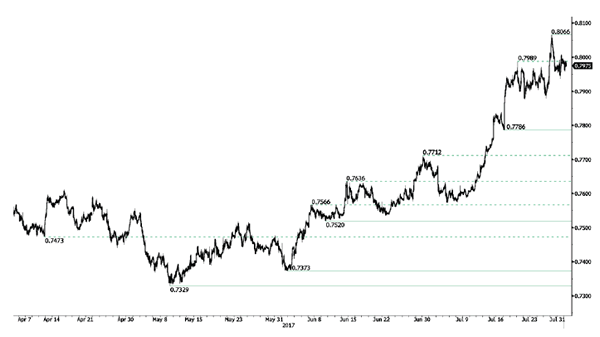
AUD/USD's technical structure has finally not reversed. Hourly resistance is now given at 0.8066 (27/07/2017 high). Hourly support given at 0.7875 (21/07/2017 low). Expected to show continued upside pressures.
In the long-term, we are waiting for further signs that the current downtrend is ending. Key supports stand at 0.6009 (31/10/2008 low) . A break of the key resistance at 0.8295 (15/01/2015 high) is needed to invalidate our long-term bearish view.
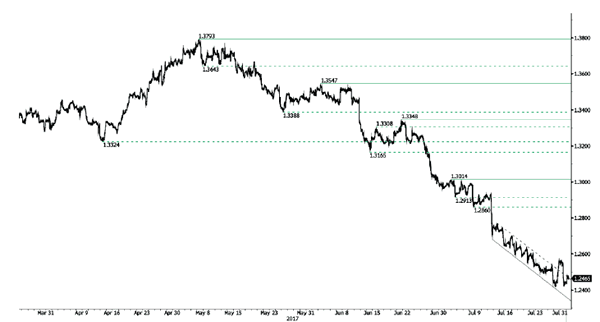
USD/CAD Consolidating Below 1.2400.
USD/CAD 's bearish momentum is showing ending signals. The pair remains nonetheless in a strong bearish momentum. Hourly resistance is given at 1.2544 (26/07/2017). Expected to show further consolidation above 1.2400.
In the longer term, the pair has broken longterm support that can be found at 1.2461 (16/03/2015 low) before bouncing back. Strong resistance is given at 1.4690 (22/01/2016 high). The pair should head further lower.
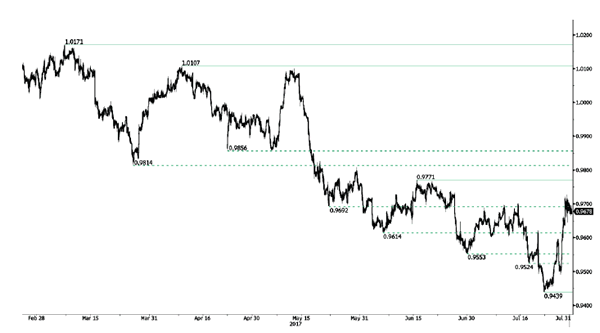
USD/CHF Consolidating Before A Likely Another Leg Higher
USD/CHF is pausing. Hourly support can be found at 0.9439 (21/07/2017 high). Strong resistance is given at 0.9771 (15/06/2017 high) is on target. Expected to to show further strengthening.
In the long-term, the pair is still trading in range since 2011 despite some turmoil when the SNB unpegged the CHF. Key support can be found 0.8986 (30/01/2015 low). The technical structure favours nonetheless a long term bullish bias since the unpeg in January 2015.
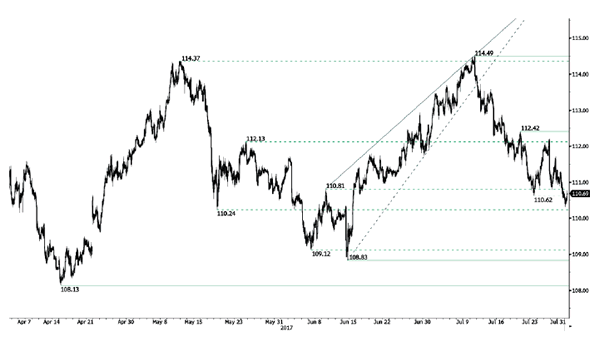
USD/JPY Continued Weakness
USD/JPY's bearish momentum continues. Hourly support given at 110.62 (24/06/2016 low) has been broken. Stronger support is located at a distance at 108.83 (17/04/2017 low). Expected to show further downside pressurs.
We favor a long-term bearish bias. Support is now given at 96.57 (10/08/2013 low). A gradual rise towards the major resistance at 135.15 (01/02/2002 high) seems absolutely unlikely. Expected to decline further support at 93.79 (13/06/2013 low).
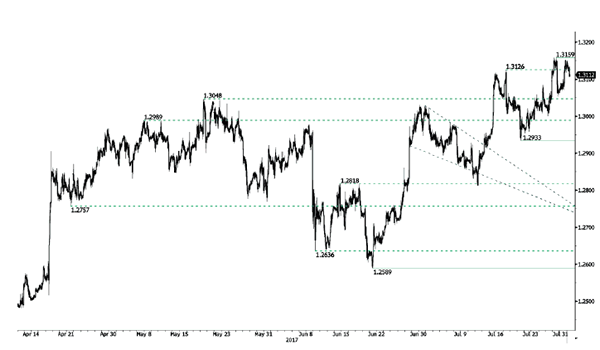
GBP/USD Momentum Is Fading Around Strong Resistance Area
GBP/USD still lies within a bullish trend. Hourly resistance is given at 1.3159 (27/07/2017 high). Hourly support is given at 1.2933 (20/07/2017 low). Expected to show renewed monitoring of resistance below 1.3200.
The long-term technical pattern is even more negative since the Brexit vote has paved the way for further decline. Long-term support given at 1.0520 (01/03/85) represents a decent target. Long-term resistance is given at 1.5018 (24/06/2015) and would indicate a long-term reversal in the negative trend. Yet, it is very unlikely at the moment.
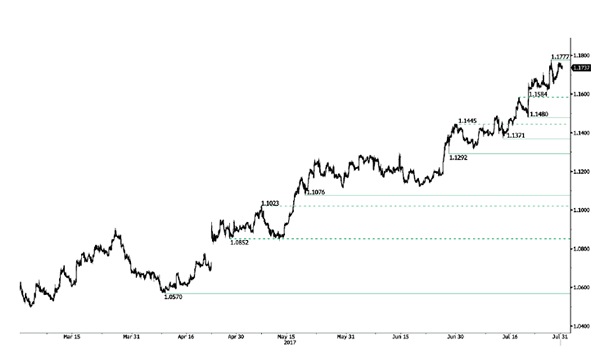
EUR/USD Heading Higher
EUR/USD bullish pressures continue. Hourly resistance is given at 1.1777 (25/07/2017 high). Hourly support can be found at 1.1613 (26/07/2017 high). Stronger support lies at 1.1292 (28/06/2017 low). Expected to show continued bullish pressures.
In the longer term, the momentum is now turning largely positive. We favour a continued bullish bias. Key resistance is now holding at 1.1871 (24/08/2015 high)t while strong support lies at 1.0341 (03/01/2017 low).
USD Bounces Back, SNB’s Profits Melt Like Snow In The Sun
SNB's profit plummet due to FX losses
The Swiss National Bank reported a profit of CHF 1.2 billion for the first half of 2017, compared to CHF 7.9 billion for the first quarter. The sharp appreciation of the Swiss franc against most of its peers, mostly the US dollar, ate up the profits from shares and bonds investments. The Swissie rose 5.9% against the USD, 2.4% against the CAD and 2.1% against the JPY.
The SNB recorded a loss of CHF 3.6 billion on interest-bearing paper and instruments amid surging bond yields. On the other hand, equity securities and instruments contributed CHF 9.4 billion to the net result. Exchange rate-related losses reached CHF 11.8 billion. Negative interest rates charged by the SNB yielded a gain of CHF 970 billion.
Foreign currency investments rose to 728 billion as of June 30th from CHF 714 billion three months ago and 700bn six months ago, highlighting clearly that the SNB is committed to defend the Swiss franc.
As the SNB declared on Monday: “…financial result depends largely on developments in the gold, foreign exchange and capital markets. Strong fluctuations are therefore to be expected, and only provisional conclusions are possible as regards the annual result”. Therefore it is hard to draw any relevant forecast regarding the year-end results, especially since those results do not reflect the sharp depreciation of the Swissie against the euro of the last few days.
Last week, the CHF fell as much as much as 3.60% against the euro sending the EUR/CHF pair to 1.14. We see this sharp appreciation as a catch-up session for the Swissie. Despite a broad-based appreciation of the euro, the Swiss franc held ground, which led directly to a sustain appreciation of the CHF against the USD. However at some point EUR/CHF could stay completely immune to the euro appreciation, after all the end of the ECB's ultra-loose monetary policy will impact the EU/CH interest rate differential. Therefore this is more a healthy adjustment, rather than the end of the CHF overvaluation. The EUR/CHF still has some legs but we doubt the pair will pass the 1.20 threshold. The 1.15 looks like to be a good equilibrium given the fact the EUR rally is losing steam.
Australia: RBA to wait & see
Tomorrow morning, the Reserve Bank of Australia's cash rate is set to remain on hold at 1.5% despite the Aussie is on a bullish trend since mid-May. The Aussie can be traded at almost $0.80. It is worth noting that the Australian currency has gained more than 11% this year.
We believe that it is likely that the Aussie breaks above $0.80 given global fundamentals. In particular, the greenback keeps on getting weaker (Trump's inability to deliver and Fed back towards patience). China's growth (Australian main trade partner) is better and has known a third positive quarter in a row.
Earlier this month, the RBA mentioned that “a strengthening exchange rate” would definitely render difficult the central bank's mission as Australia relies mostly on exports (iron ore). Australia's GDP target of 2.25% for June 2019 looks nonetheless difficult to attain. Right now, the GDP lies at 1.7% y/y and the continue rise of the Australian dollar would likely force the RBA to slash their forecasts.
We do not believe the AUD strengthening is sustainable over the medium-term even though it implies higher commodity prices but exports and other sectors of the Australian economy could suffer. A pullback is now getting more likely.