

Sample Category Title
Trade Idea: USD/CAD – Sell at 1.2690
USD/CAD - 1.2493
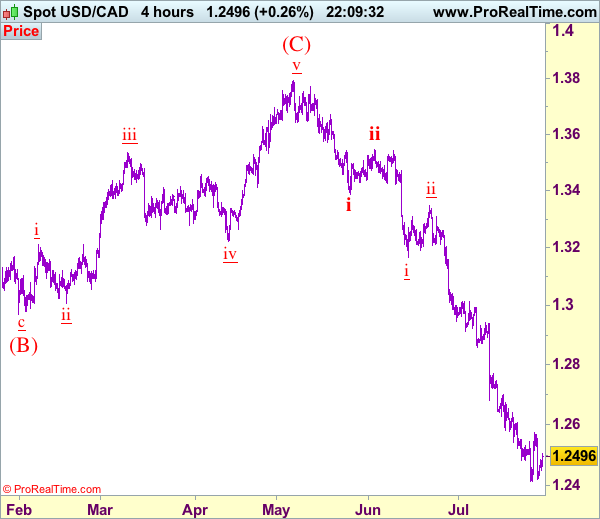
Recent wave: Only wave v of c has ended at 0.9407 and wave C of major A-B-C correction is underway with wave iii ended at 1.4690, wave v of C may bring one more marginal rise probably in 2018
Trend: Down
Original strategy :
Sell at 1.2690, Target: 1.2490, Stop: 1.2750
Position: -
Target: -
Stop: -
New strategy :
Sell at 1.2690, Target: 1.2400, Stop: 1.2750
Position: -
Target: -
Stop:-
As the greenback has recovered after holding above last week’s low at 1.2414, retaining our view that further consolidation would take place and another corrective bounce too 1.2575-80 is likely, above there would bring retracement of recent decline to 1.2640-50 but reckon 1.2700-05 would limit upside and bring another decline later, below said support at 1.2414 would signal downtrend has resumed and extend weakness to 1.2400, then towards 1.2350-60, however, oversold condition should prevent sharp fall below 1.2330 and reckon 1.2300 would hold, risk from there is seen for a rebound later. We are keeping our count that wave v as well as wave (C) ended at 1.3794 and impulsive wave (i ii, i ii) is now unfolding with minor wave iii still in progress, hence bearishness remains for this fall to extend weakness to aforesaid downside targets.
In view of this, would not chase this fall here and would be prudent to sell the pair again on recovery as 1.2690-95 should limit upside. Above 1.2745-50 would defer and risk a stronger rebound to 1.2800-10 but only break of latter level would signal a temporary low is formed instead, bring retracement of recent decline to 1.2850, then 1.2900, however, price should falter below 1.3000 and the greenback shall head south again from there.
To recap, wave B from 1.3066 is unfolding as an a-b-c and is sub-divided as a: 1.2192, b: 1.2716 and wave c is a 5-waver with i: 1.1983, ii: 1.2506, extended wave iii with minor iii at 1.0206, wave iv ended at 1.0781 and wave v as well as wave iii has ended at 0.9931, hence the subsequent choppy trading is the wave iv which is unfolding as (a)-(b)-(c) with (a) leg of iv ended at 1.0854, followed by (b) leg at 1.0108 and (c) leg as well as the wave iv ended at 1.0674. The wave v is sub-divided by minor wave (i): 0.9980, (ii): 1.0374, (iii): 0.9446, (iv): 0.9913 and (v) as well as v has possibly ended at 0.9407, therefore, consolidation with upside bias is seen for major correction, indicated target at 1.3700 and 1.4000 had been met and further gain to 1.4700 would be seen later.
China Summer Recap – Resilient Growth and Rising Tensions with US
Chinese growth resilience
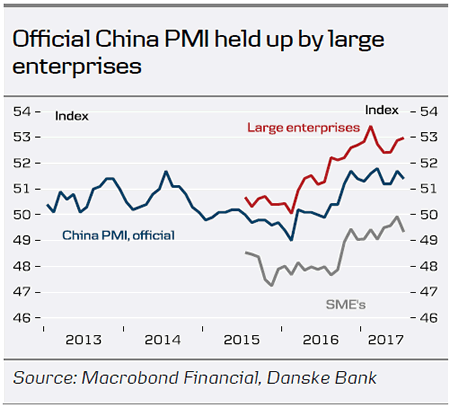
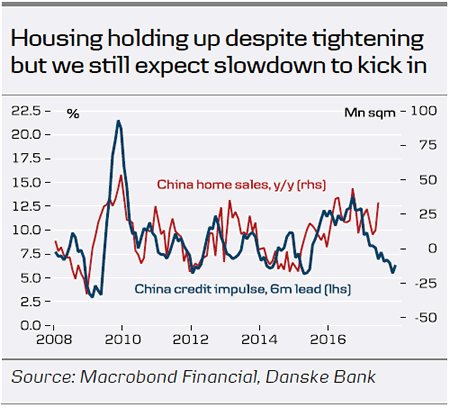
China has proven more resilient than expected over the past couple of months. The housing market is holding up still despite tightening measures and PMI manufacturing suggests that growth may have rebounded a bit again towards the end of Q2. The official PMI manufacturing figure for July, published today, fell slightly to 51.4 (consensus) from 51.7 in June. However, despite being below consensus, the level is still in line with fairly robust activity (see chart).
Another sign of rebounding Chinese activity lately is a turnaround in commodity prices. After trading moderately lower during spring, metal prices have moved higher in June and July to a new high for this year. Oil prices have also pushed higher from USD45 per barrel in mid-June to just below USD53 per barrel.
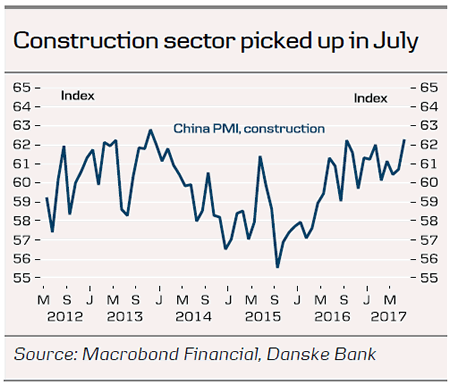
What is behind the resilience? Most of our leading indicators had pointed to a Chinese slowdown, so what is behind the rebound? One explanation may be a lift to infrastructure and construction projects ahead of the 19th National Congress of the Communist Party of China, taking place this autumn. It is striking in the PMI data for the past few months that it is the large enterprises that have rebounded, while PMIs for small and medium-sized companies have weakened. The latter are more exposed to the shadow banking sector, which has seen significant regulatory tightening this year. Large enterprises are typically exposed to heavy industry with exposure to infrastructure and construction. PMI for construction was strong in July.
Looking ahead, we continue to look for softer Chinese activity, as credit has been tightened and projects to boost growth ahead of the congress will fade again. We expect the housing market to slow soon in response to the tightening measures. However, the downside risks to Chinese growth have diminished over the past one to two months.
Stocks robust, USD/CNY lower
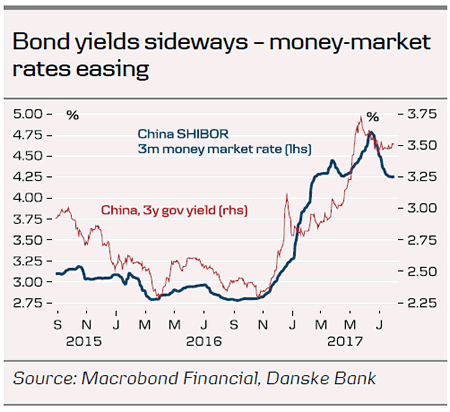
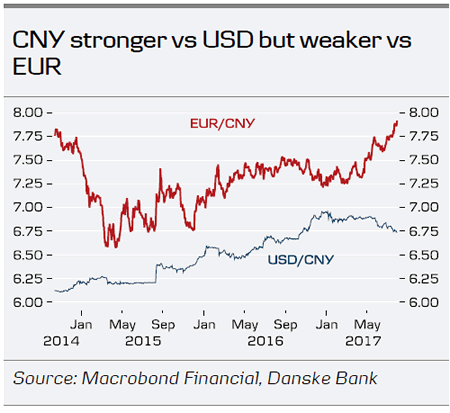
In Chinese financial markets, stocks have continued to perform, while the CNY has strengthened further against the USD. However, the latter is more a reflection of USD weakness than of CNY strength. Still, with USD/CNY moving down to 6.73, our 12M forecast for USD/CNY of 7.1 looks increasingly too high. We intend to review this when we next revise our forecasts in mid-August. While CNY is stronger than expected versus the USD, it continues to weaken against EUR and EUR/JPY has moved higher to 7.89. We continue to recommend hedging of CNY receivables as we look for a further increase in EUR/CNY. Bond yields in China have been quite stable lately. The financial stress in bond markets seen in May is no longer in place, as the authorities have eased liquidity leading to lower 3M money-market rates.
Crisis intensify with North Korea
On the geopolitical front, tensions with North Korea continue to rise after it did a second test of an intercontinental ballistic missile (ICBM) on Friday 29 July. It followed a similar test on 4 July. However, according to western experts, the latest ICBM could reach Los Angeles, whereas the missile tested on 4 July had Alaska within its scope if fired at a lower angle. The test is another sign that North Korea is advancing much faster than expected when it comes to technology that can reach the US with a nuclear warhead - a clearly stated goal of the North Korean regime.
US President Donald Trump said in a statement that 'By threatening the world, these weapons and tests further isolate North Korea, weaken its economy and deprive its people...The United States will take all necessary steps to ensure the security of the American homeland and protect our allies in the region.' The US has also displayed military firepower by flying two supersonic B-1 bombers over the Korean Peninsula as part of a joint exercise with Japan and South Korea and performed successful missile defence tests over the Pacific Ocean.
A military solution comes with very high risk but at the same time, the US is likely to lose credibility if it keeps saying it will take all necessary steps while not responding. This makes the situation very uncertain and unpredictable. For now, there are no signs the North Korea's leader is backing down from his nuclear ambitions, despite the increasing threat from the US.
Tensions in US-China relations - watch out for US measures
The crisis is also worsening the relationship between China and the US. Trump tweeted after the latest test 'I am very disappointed in China. Our foolish past leaders have allowed them to make hundreds of billions of dollars a year in trade, yet...they do NOTHING for us with North Korea, just talk. We will no longer allow this to continue. China could easily solve this problem.' Following a period of more friendliness between the two leaders, the tone from Trump towards China has sharpened significantly recently. As late as 20 June, Trump tweeted that he appreciated the efforts by China and said '...at least I know China tried!'. In another sharp critique of China following the missile test, US ambassador to the United Nations Nikkie Haley said the US would not seek an emergency meeting of the UN Security Council, as it would be pointless as long as China will not commit to increasing the pressure on North Korea's leader Kim Jong Un.
On the trade front, Trump has still not introduced any protectionist measures. In late June, he clearly indicated that tariffs and/or quotas were coming on steel but so far no action has been taken. In an interview in The Wall Street Journal recently, he suggested the decision on steel would come fairly soon but suggested it was not urgent. However, according to Politico.com, Trump is working on a plan to 'punish China', that may be enacted as early this week. Any action aimed directly at China would be taken very seriously in Beijing and would be likely to lead to retaliation on, for example, trade.
Trade Idea Update: USD/CHF – Buy at 0.9600
USD/CHF - 0.9693
Original strategy :
Buy at 0.9600, Target: 0.9700, Stop: 0.9565
Position : -
Target : -
Stop : -
New strategy :
Buy at 0.9600, Target: 0.9700, Stop: 0.9565
Position : -
Target : -
Stop : -
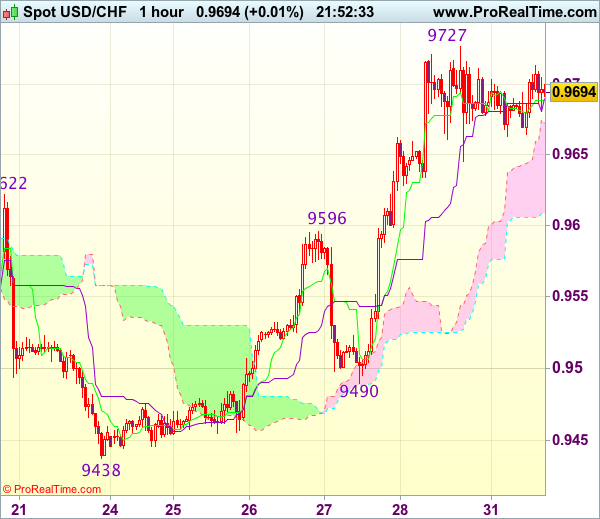
The greenback has traded narrowly after surging to as high as 0.9727 late last week, suggesting further consolidation below this level would be seen and initial downside risk remains for pullback to 0.9640-45, however, previous resistance at 0.9596 should turn into support and contain downside, bring another rise later, above said resistance at 0.9727 would extend recent rise to 0.9750-60, then 0.9780 but reckon 0.9800 would hold from here.
In view of this, would not chase this rise here and would be prudent to buy dollar on pullback as previous resistance at 0.9596 should turn into support and contain dollar’s downside. Below 0.9570 would defer and suggest a temporary top is formed instead, bring correction to 0.9560-70 and possibly 0.9540 but price should stay well above support at 0.9490, bring another rise later.
Trade Idea Update: GBP/USD – Stand aside
GBP/USD - 1.3130
New strategy :
Stand aside
Position : -
Target : -
Stop : -
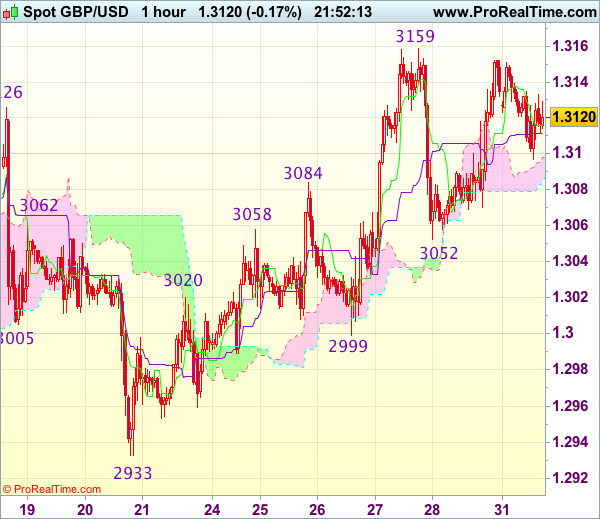
Despite rising to 1.3152 on Friday, as cable has retreated after faltering below indicated resistance at 1.3159 (last week’s high), retaining our view that further consolidation below this level would be seen and pullback to the lower Kumo (now at 1.3079) cannot be ruled out, however, reckon support at 1.3052 would hold, bring further sideways trading. Only a drop below tis support would signal a temporary top has been formed, bring retracement of recent upmove to 1.3030, then towards support at 1.2999 which is expected to hold from here.
On the upside, above said resistance at 1.3152-59 would revive bullishness and signal recent upmove has resumed and extend further gain to 1.3185-90 and then 1.3210-20, however, loss of upward momentum should prevent sharp move beyond 1.3240-50, bring another retreat later.
Trade Idea Update: EUR/USD – Stand aside
EUR/USD - 1.1748
New strategy :
Stand aside
Position : -
Target : -
Stop : -
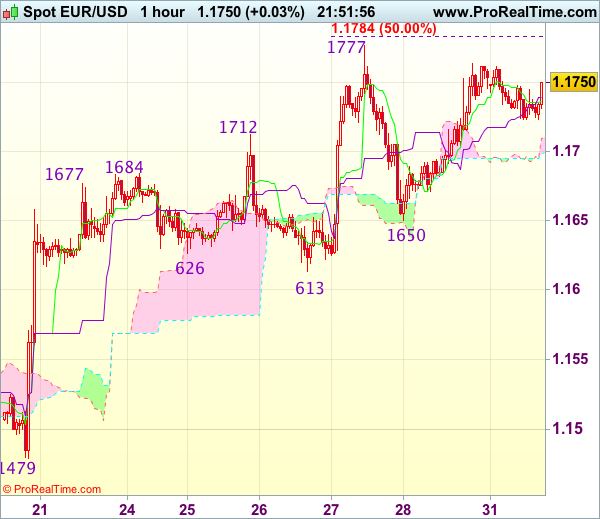
Although the single currency staged a strong rebound after finding support at 1.1650, a break of last week’s high at 1.1777 is needed to signal recent upmove has resumed and extend gain to 1.1784-85 (50% projection of 1.1370-1.1712 measuring from 1.1613). then 1.1800 but loss of near term upward momentum should prevent sharp move beyond 1.1820-25 (61.8% projection), risk from there has increased for a retreat later.
In view of this, would not chase this rise here and would be prudent to stand aside for now. Below 1.1690-95 would bring test of said support at 1.1650 but break there is needed to signal a temporary top is possibly formed, bring further weakness towards support at 1.1613, having said that, price should stay well above previous resistance at 1.1583 (now support), bring another rise later.
Elliott Wave Analysis: AUDNZD Trading In A Temporary Correction; More Weakness In View
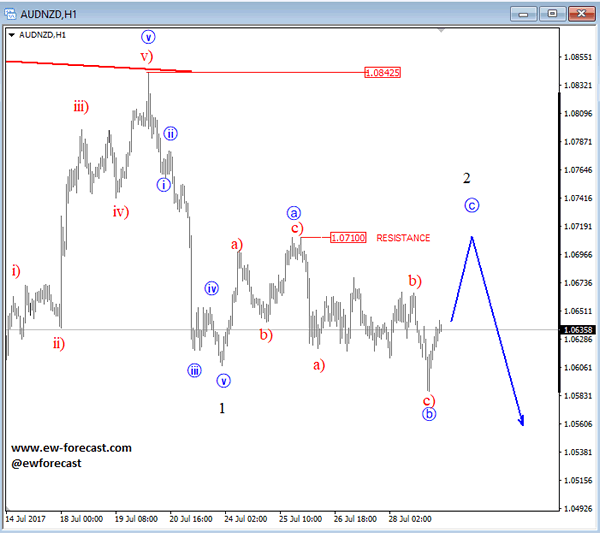
AUDNZD is trading quite choppy and slow since last week of July, which gives us an indication that price may be unfolding a corrective wave. As we can see we expect wave 2 to unfold, ideally as a flat correction. A pattern that consist out of a 3-3-5 structure. As we can see on the chart, sub-waves a and b are completed, which means only wave c to the upside is needed for the completion of the pattern. Ideally more gains will step in on the pair and take price higher towards the 1.0710 resistance area, from where a turning point lower will later come in play.
AUDNZD, 1H
Trade Idea Update: USD/JPY – Stand aside
USD/JPY - 110.54
New strategy :
Stand aside
Position : -
Target : -
Stop : -
The greenback finally resumed recent decline as the pair broke below indicated previous support at 110.62, adding credence to our bearishness, however, as dollar has recovered from 110.31, suggesting minor consolidation above this level would be seen and test of the Kijun-Sen (now at 110.80) cannot be ruled out but upside should be limited to 111.00-05 and resistance at 111.29 should hold, bring another selloff.
In view of this, would not chase this fall here and would be prudent to stand aside for now. Below said support at 110.31 would extend recent decline to 110.00-05 but near term oversold condition should limit downside to 109.75-80 and 109.50 would hold from here, risk from there is seen for a rebound later.

Euro Eyes Upside Break above 1.1765 Vs US Dollar
Key Highlights
- The Euro gained a lot of traction this past week and moved above 1.1750 against the US Dollar.
- There is a major contracting triangle pattern with support at 1.1720 forming on the 4-hours chart of EUR/USD.
- Today in the Euro Zone, the German Retail Sales for June 2017 was released, which posted an increase of 1.1% (MoM).
- Today in the US, the Pending Home Sales figure for June 2017 will be released, which is forecasted to increase by 1% (MoM).
EURUSD Technical Analysis
There were good gains in the Euro as the shared currency traded above 1.1750 vs the US Dollar. The EUR/USD is placed well above 1.1700 and currently approaching a short-term break.
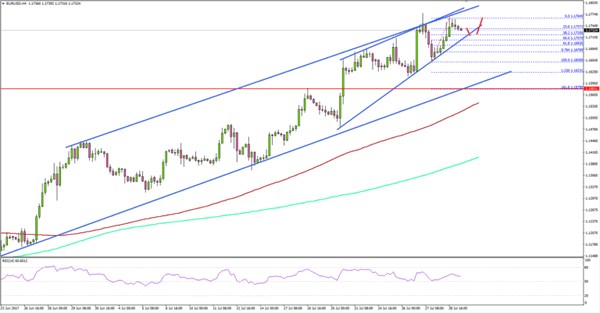
Looking at the 4-hours chart, there is a major contracting triangle pattern forming with support at 1.1720. On the upside, the triangle resistance is near 1.1770, which is a confluence of two connecting trend lines.
On the downside, the triangle support at 1.1720 coincides with the 38.2% Fib retracement level of the last wave from the 1.1650 low to 1.1764 high. As long as the pair is above the 1.1720-00 support, there is a chance of it moving past 1.1770.
On the flip side, a break below 1.1700 could take the pair towards the last swing low of 1.1650. The overall trend is positive above 1.1700 for EUR/USD, as the 100 SMA is moving nicely higher along with the RSI (H4).
German Retail Sales
Today in the Euro Zone, the German Retail Sales for June 2017 was released by the Statistisches Bundesamt Deutschland. The market forecast was an increase of 0.2% compared with the previous month.
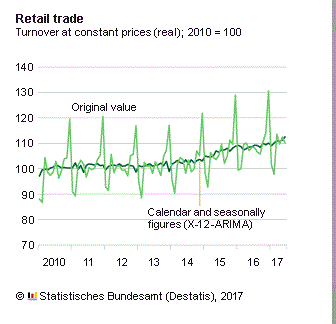
The actual result was better, as there was an increase of 1.1% in sales. Looking at the yearly change, there was an increase of 1.5%, which was less than the forecast of 2.7% and the last rise 4.9% (revised).
The report added that:
According to provisional data turnover in retail trade in June 2017 was in real terms 1.5% and in nominal terms 3.1% larger than that in June 2016. The number of days open for sale was 25 in June 2017 and 26 in June 2016.
Overall, the EUR/USD pair remains supported for more gains as long as the 1.1700 support is intact.
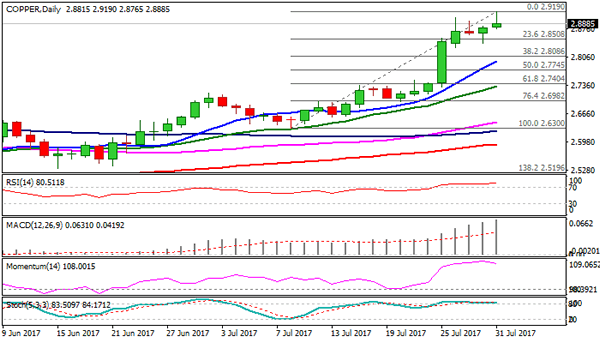
Copper Posted Fresh 26-month High
Copper posted fresh 26-month high on Monday, signaling bearish continuation after brief consolidation on Thu/Fri.
Contract for September delivery hit new high at $2.9190, but was so far unable to hold gains, as strongly overbought daily studies continue to warn of correction. However, indicators on daily chart are heading higher or in sideways mode and so far missing to generate stronger bearish signal.
Today's low at 2.8765 marks initial support, followed by 2.8508 (Fibo 23.6% of 2.6300/2.9190 and more significant Friday's spike low at 2.8400, which marks the first pivot.
Break here is needed for stronger bearish signal and extension towards next pivotal support at 2.8086 (Fibo 38.2%).
At the upside, next target lies at 2.9248 (FE 161.8% of the wave C from 2.6300, the third wave of five-wave cycle from 2.5385 (21 June trough), with the wave capable of travelling to its FE 176.4% at 2.9514.
From the fundamental side, weak dollar and positive outlook for the economy of the world's biggest copper consumer – China, keep copper price supported for further advance
Res: 2.9040; 2.9190; 2.9248; 2.9310
Sup: 2.8765; 2.8610; 2.8508; 2.8400
CAC Quiet as Eurozone CPI Estimate Matches Forecast
In the Monday session, the CAC index is almost unchanged. Currently the index is at 5,132.50, up 0.06% on the day. On the release front, Eurozone CPI Flash Estimate remained unchanged at 1.3% in July, matching the estimate. The Eurozone unemployment rate dropped to 9.1% in June, down from 9.3% a month earlier. On Tuesday, the eurozone releases Preliminary Flash GDP, with an estimate of 0.6%.
The CAC recorded slight losses on Friday, as French indicators were mixed. Consumer spending came in at -0.8%, missing the estimate of -0.3%. On the inflation front, Preliminary CPI declined 0.3%, just above the forecast of -0.4%. This marked the indicator's weakest reading since January. There was better news from Flash GDP for Q2, which improved with a gain of 0.5%, matching the forecast. This was the strongest quarter of growth since Q1 in 2016.
A stronger eurozone economy has seen unemployment levels drop, as the June rate of 9.1% marks the lowest level since 2009. However, major eurozone members such as France, Italy and Spain continue to grapple with high unemployment, with the notable exception being Germany. In France, for example, unemployment improved in the first quarter of 2017, but remains high at 9.6%. Even with the German locomotive firing on all 4 cylinders, the Eurozone flash estimate for inflation was unchanged at 1.3%, well below the ECB's target of just under 2%. The ECB's ultra-easy accommodative policy is set to wind up in December, but the cautious ECB has not hinted at an earlier termination date or tapering the current purchases of ECB 60 billion/month. The ECB has said it will not make any changes before inflation moves closer to its inflation target, but the euro continues to move higher. On Friday, EUR/USD touched a high of 1.7777, its highest level since January 2015. A stronger euro has been weighing on European stock markets, as export shares such as automobile makers have dropped since their products have become more expensive on world markets.