
Sample Category Title
Cable Likely To Be Buoyant As Bank Of England Set To Meet
Key Points:
- Cable recently buoyed by negative greenback sentiment swing.
- Bank of England MPC decision likely to be the key event.
- Risks for the Cable are largely tilted to the upside.
The Cable experienced another week in the green as the pair reacted to both the U.S. FOMC and UK GDP results. However, it was largely the FOMC's lack of hawkishness that set off a broad sentiment swing against the greenback and saw the pair significantly buoyed. However, the focus will now shift to the Bank of England's interest rate decision and it remains to be seen if the pair can retain its bullish intent.
Last week was a relatively positive one for the Cable as the pair was buoyed by both the U.S. FOMC and the UK GDP results. However, it was primarily Yellen's speech following the FOMC vote which broadly skewed sentiment for the greenback and this led to a sharp rise for the Cable. In addition, the UK GDP figures proved on target at 0.3% q/q and added to the long slow bid that the pair received. UK output is likely to be on the upside in the coming months as increased consumer confidence continues to flow through to the broader economy. Price action did manage to break through the near term high but the momentum slowed quickly and the pair ended up finishing the week out around the 1.3134 mark.
Looking ahead, it's set to be a highly busy day for the Cable as a slew of UK economic data is due for release in the coming days. In particular, the Bank of England is due to meet to determine their near term interest rate policy as well as release their inflation report. The market is largely expecting the central bank to hold rates steady at 0.25% but watch for any potentially hawkish statements as inflation is definitely accelerating in the UK. In addition, the U.S. Non-Farm Payroll figures are also due for release and could bring with it some volatility if the print varies from the estimate of 180k. Subsequently, there is plenty of economic releases which could impact the Cable's valuations in the coming week.
However, there is also some dissent on the potential direction of the BOE at the coming meeting with Morgan Stanley taking the view that the Dove's upon the MPC might just hold on in the coming meeting but that the decision could still go either way. Having said that, inflation is starting to roar and an August hike is still a strong possibility considering the vote could go either way. Regardless, the Cable is fundamentally predisposed to the upside and we should start to see some further gains as we move towards the critical meeting.
Ultimately, the Bank of England's decision is likely to set the tone for the pair in the coming week and we could very well see a significant appreciation as the pair potentially reacts to the decision. Regardless, the upside is beckoning given the risk of the MPC meeting is completely stacked to the upside. Subsequently, keep a watch on the Cable because in all likelihood there will be plenty of volatility in the aftermath of the meeting.
RBA Left Its Key Interest Rate Unchanged For The 11th Consecutive Month
For the 24 hours to 23:00 GMT, the AUD rose 0.26% against the USD and closed at 0.8002.
LME Copper prices rose 1.0% or $64.0/MT to $6347.0/MT. Aluminium prices rose 0.6% or $12.0/MT to $1904.0/MT.
In the Asian session, at GMT0300, the pair is trading at 0.8033, with the AUD trading 0.39% higher against the USD from yesterday's close.
Earlier in the session, the Reserve Bank of Australia (RBA), at its latest monetary policy meeting, kept its benchmark interest rate steady at 1.5%, in line with market expectations.
On the data front, Australia's AiG performance of manufacturing index advanced to a level of 56.0 in July, following a level of 55.0 in the prior month.
Elsewhere, in China, Australia's largest trading partner, the Caixin/Markit manufacturing PMI index unexpectedly rose to a level of 51.1 in July, hitting a 4-month high level and defying market consensus for the PMI to remain steady at a level of 50.4.
The pair is expected to find support at 0.7982, and a fall through could take it to the next support level of 0.793. The pair is expected to find its first resistance at 0.8064, and a rise through could take it to the next resistance level of 0.8094.
Going forward, Australia's building approvals data for June, set to be released in the early hours' tomorrow, will keep investors on their toes.
The currency pair is trading above its 20 Hr and 50 Hr moving averages.

Euro-Zone’s Unemployment Rate Lowest In 8 Years In June, Annual Inflation Advanced As Expected In July
For the 24 hours to 23:00 GMT, the EUR rose 0.74% against the USD and closed at 1.1828, after the Euro-zone's jobs report painted a bright picture of the region's labour market.
Data showed that unemployment rate in the Euro-zone surprisingly declined to an eight-year low of 9.1% in June, suggesting that the region's economy continued to gain traction. Unemployment rate had recorded a revised level of 9.2% in the previous month, while markets were expecting it to remain steady.
Further, the region's preliminary consumer price index (CPI) advanced 1.3% on an annual basis in July, meeting market expectations and compared to a similar rise in the prior month.
Separately, Germany's retail sales grew more-than-expected by 1.1% on a monthly basis in June, rising by the most since October 2016 and indicating that the nation's consumers remain a key pillar for driving growth in the Euro-zone's biggest economy. Retail sales had registered a gain of 0.5% in the prior month, while market participants had envisaged for a rise of 0.2%.
The US Dollar declined against a basket of major currencies, amid chaos in the White House following news that the White House communications director, Anthony Scaramucci, was ousted.
Macroeconomic data showed that pending home sales in the US rebounded more-than-expected by 1.5% on a monthly basis in June, advancing for the first time in 4 months. Investors had anticipated pending home sales to increase 1.0%, after reporting a revised drop of 0.7% in the prior month. Further, the nation's Dallas Fed manufacturing business index unexpectedly climbed to a level of 16.8 in July, following a level of 15.0 in the prior month.
On the contrary, the nation's Chicago Fed purchasing managers index dropped to a level of 58.9 in July, surpassing market consensus for a drop to a level of 60.0 and after recording a three-year high level of 65.7 in the previous month.
In the Asian session, at GMT0300, the pair is trading at 1.1826, with the EUR trading marginally lower against the USD from yesterday's close.
The pair is expected to find support at 1.1751, and a fall through could take it to the next support level of 1.1675. The pair is expected to find its first resistance at 1.1874, and a rise through could take it to the next resistance level of 1.1921.
Ahead in the day, investors will anxiously await the Euro-zone's flash 2Q GDP figures and Germany's unemployment rate for July. Further, the release of final Markit manufacturing and services PMIs data across the Euro-bloc, scheduled in a few hours, will grab a lot of market attention. Additionally, traders will direct their attention to a slew of economic releases in the US, consisting of the ISM manufacturing as well as the final Markit manufacturing PMIs, both for July along with the nation's construction spending, personal income and spending data, all for June, slated to release later in the day.
The currency pair is trading above its 20 Hr and 50 Hr moving averages.

AUD/USD Daily Outlook
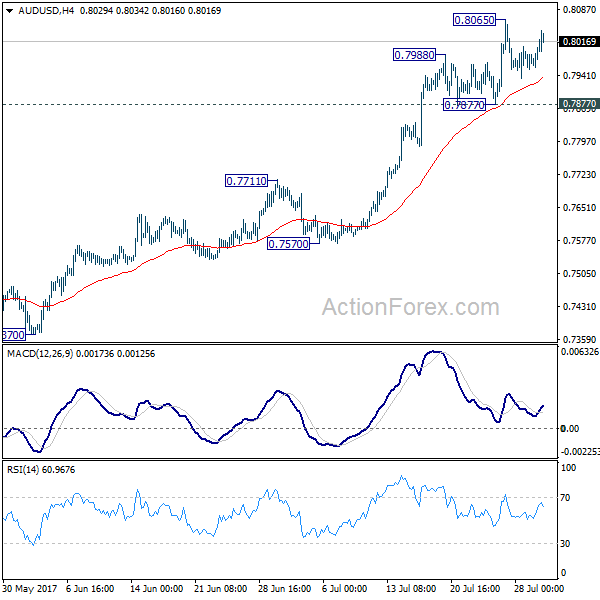
Daily Pivots: (S1) 0.7946; (P) 0.7976; (R1) 0.8016; More...
AUD/USD recovers today but stays in range of 0.7877/8065. Intraday bias remains neutral for the moment. Another rally is expected as long as 0.7877 support holds. Break of 0.8065 will target 100% projection of 0.6826 to 0.7833 from 0.7328 at 0.8335. Nonetheless, break of 0.7877 will indicate short term topping, possibly with bearish divergence condition in 4 hour MACD. In such case, intraday bias will be turned back to the downside for 0.7711 resistance turned support.
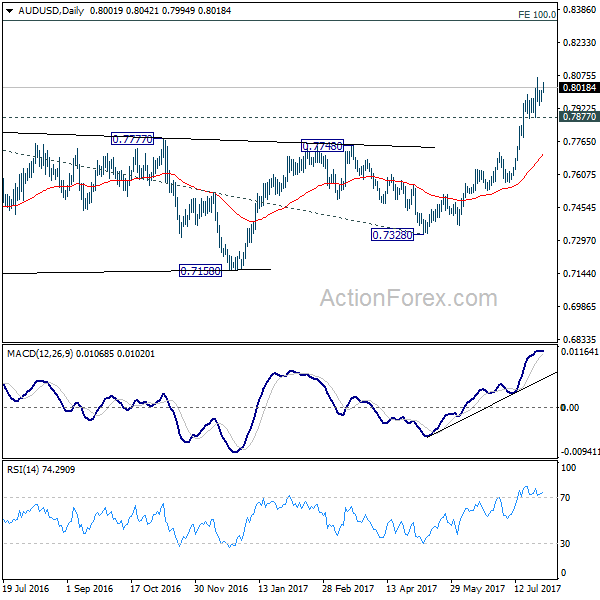
In the bigger picture, current development suggests that rebound from 0.6826 is developing into a medium term rise. There is no confirmation of trend reversal yet and we'll continue to treat such rebound as a corrective pattern. But in any case, further rise is now expected to 55 month EMA (now at 0.8100) or even further to 38.2% retracement of 1.1079 to 0.6826 at 0.8451. Break of 0.7328 support is needed to confirm completion of the rebound. Otherwise, further rise is now expected.
Dollar Dived again on White House Drama, No Follow Through Buying in Australia Dollar after RBA
Dollar suffered another round of selloff against Euro, Sterling and Yen yesterday as the political drama in White House continued. Australian Dollar jumps earlier today as lifted by better than expected data from China. But there is no follow through buying after RBA stands pat and warns of recent appreciation in the exchange rate. Sterling is also trading mildly higher as markets await UK manufacturing data. Euro also stays strong ahead of Q2 GDP. WTI oil price surged through 50 handle overnight but provides little boost to Canadian Dollar, as USD/CAD is struggling in tight range around 1.2460 key support level.
RBA Maintained Status Quo, Warned that Strong Aussie is Curbing Growth
As widely anticipated, the RBA left the cash rate unchanged at 1.5%. Policymakers acknowledged that June inflation drifted back below the +2% target but remained confident it would improve gradually alongside the pickup of the economy. Policymakers, however, warned of Australian dollar's appreciation, suggesting that it would limit economic growth. A reference of the negative impact of strong currency on economic developments reappeared as AUDUSD has risen +5.7% from July's low of 0.7567. More in RBA Maintained Status Quo, Warned that Strong Aussie is Curbing Growth
Fed Vice Fischer: Political and economy uncertainty is dragging growth
Fed Vice Chair Stanley Fischer warned that political and economy uncertainty is dragging growth in the US and globally. He said that "uncertainty about the outlook for government policy in health care, regulation, taxes, and trade can cause firms to delay projects until the policy environment clarifies." While US President Donald Trump always talks about bring the economy to above 3% growth, Fisher noted that the Congressional Budget Office estimates that growth potential is closer to 1.5%. And he said that "lower growth diminishes the number of business opportunities that can be profitably undertaken."
Talking about political uncertainty US, Trump's new chief of staff John Kelly just forced Anthony Scaramucci out of the post of White House Communications Director after 10 days of the latter's appointment. Press secretary said in a statement that "Mr. Scaramucci felt it was best to give Chief of Staff John Kelly a clean slate and the ability to build his own team." Politics aside, the better news yesterday was that Gary Cohn, Trump's top economic adviser, said "the number one topic of the Cabinet meeting today was talking about taxes, tax reform, what it would take to get tax reform done this year."
UK Chancellor Hammond: Brexit "won't be postponed or delayed"
In UK, there are talks the deadline of Brexit could slip due to lack of progress in the negotiation with EU so far. But Chancellor of the Exchequer Philip Hammond emphasized that Brexit "won't be postponed or delayed". Hammond noted that "There is a discussion going on about how we will then move from full membership of the European Union to a future relationship with the European Union. That is a debate, a discussion that will go on through these negotiations." Trade Secretary Liam Fox was also firm and said "we will leave the European Union at the end of March 2019... there's no doubt about it."
Prime Minister Theresa May confirmed that freedom of movement will end on the date Brexit takes effect in March 2019. Her spokesman said that "the Prime Minister's position on an implementation period is very clear and well-known... Free movement will end in March 2019. We have published proposals on citizens' rights".
Oil surges through 50
WTI crude oil surged through 50 handle overnight and is staying firm above. A factor boosting oil prices was US sanction over Venezuela president Nicolas Maduro after an election over the weekend virtually gave the president unlimited power. Threat of US sanctions against Venezuela added to hopes of tightening supply. Also, there's some optimism on the OPEC/non-OPEC technical meeting discuss about the compliance issue. As the OPEC statement suggested, the meeting aims to "better understand the difficulties and obstacles faced by some OPEC and non-OPEC participating countries and to assess how conformity levels can be improved with the goal of achieving a faster rebalanced global oil market, for the benefit of producers and consumers alike".
On the data front
China Caixin PMI manufacturing rose to 51.1 in July, up from 50.4, and beat expectation of 50.4. It's noted in the statement that "panelists widely commented on an improvement in market conditions and strong foreign demand. Notably, new export sales increased at the second-fastest rate since September 2014." New export orders jumped sharply from 50.9 to 53.5, hitting the highest level since February.
Looking ahead, Eurozone Q2 GDP and UK PMI manufacturing will be the main focuses in European session. Later in the day, US personal income and spending, ISM manufacturing will catch most attention.
AUD/USD Daily Outlook
Daily Pivots: (S1) 0.7946; (P) 0.7976; (R1) 0.8016; More...
AUD/USD recovers today but stays in range of 0.7877/8065. Intraday bias remains neutral for the moment. Another rally is expected as long as 0.7877 support holds. Break of 0.8065 will target 100% projection of 0.6826 to 0.7833 from 0.7328 at 0.8335. Nonetheless, break of 0.7877 will indicate short term topping, possibly with bearish divergence condition in 4 hour MACD. In such case, intraday bias will be turned back to the downside for 0.7711 resistance turned support.
In the bigger picture, current development suggests that rebound from 0.6826 is developing into a medium term rise. There is no confirmation of trend reversal yet and we'll continue to treat such rebound as a corrective pattern. But in any case, further rise is now expected to 55 month EMA (now at 0.8100) or even further to 38.2% retracement of 1.1079 to 0.6826 at 0.8451. Break of 0.7328 support is needed to confirm completion of the rebound. Otherwise, further rise is now expected.
Economic Indicators Update
| GMT | Ccy | Events | Actual | Forecast | Previous | Revised |
|---|---|---|---|---|---|---|
| 0:30 | JPY | PMI Manufacturing Jul F | 52.1 | 52.2 | 52.2 | |
| 1:45 | CNY | Caixin PMI Manufacturing Jul | 51.1 | 50.4 | 50.4 | |
| 4:30 | AUD | RBA Rate Decision | 1.50% | 1.50% | 1.50% | |
| 6:00 | GBP | Nationwide House Prices M/M Jul | -0.10% | 1.10% | ||
| 7:45 | EUR | Italy Manufacturing PMI Jul | 55.1 | 55.2 | ||
| 7:50 | EUR | France Manufacturing PMI Jul F | 55.4 | 55.4 | ||
| 7:55 | EUR | Germany Manufacturing PMI Jul F | 58.3 | 58.3 | ||
| 7:55 | EUR | German Unemployment Change Jul | -5k | 7k | ||
| 7:55 | EUR | German Unemployment Rate Jul | 5.70% | 5.70% | ||
| 8:00 | EUR | Eurozone Manufacturing PMI Jul F | 56.8 | 56.8 | ||
| 8:30 | GBP | PMI Manufacturing Jul | 54.5 | 54.3 | ||
| 9:00 | EUR | Eurozone GDP Q/Q Q2 A | 0.60% | 0.60% | ||
| 12:30 | USD | Personal Income Jun | 0.40% | 0.40% | ||
| 12:30 | USD | Personal Spending Jun | 0.10% | 0.10% | ||
| 12:30 | USD | PCE Deflator M/M Jun | 0.00% | -0.10% | ||
| 12:30 | USD | PCE Deflator Y/Y Jun | 1.30% | 1.40% | ||
| 12:30 | USD | PCE Core M/M Jun | 0.10% | 0.10% | ||
| 12:30 | USD | PCE Core Y/Y Jun | 1.40% | 1.40% | ||
| 14:00 | USD | ISM Manufacturing Jul | 56.4 | 57.8 | ||
| 14:00 | USD | ISM Prices Paid Jul | 56.5 | 55 | ||
| 14:00 | USD | Construction Spending M/M Jun | 0.50% | 0.00% |
UK’s Mortgage Approvals Declined To Its Lowest In 9 Months In June
For the 24 hours to 23:00 GMT, the GBP rose 0.5% against the USD and closed at 1.3201.
In economic news, data showed that Britain's mortgage approvals for house purchases dropped to a level of 64.7K in June, hitting its lowest level in nine months, thus pointing to a loss of momentum in the nation's housing market. Mortgage approvals had recorded a revised reading of 65.1K in the previous month, while market participants had expected for a drop to a level of 65.0K. On the other hand, the nation's net consumer credit registered a rise of £1.5 billion in June, at par with market expectations and compared to a revised rise of £1.8 billion in the prior month.
In the Asian session, at GMT0300, the pair is trading at 1.3217, with the GBP trading 0.12% higher against the USD from yesterday's close.
The pair is expected to find support at 1.3135, and a fall through could take it to the next support level of 1.3052. The pair is expected to find its first resistance at 1.3262, and a rise through could take it to the next resistance level of 1.3306.
Trading trend in the Pound today is expected to be determined by the release of UK's Markit manufacturing PMI and Nationwide house prices data, both for July, slated in a few hours.
The currency pair is trading above its 20 Hr and 50 Hr moving averages.

Japan’s Manufacturing Sector Growth Eased More Than Initially Estimated In July
For the 24 hours to 23:00 GMT, the USD declined 0.11% against the JPY and closed at 110.32.
In the Asian session, at GMT0300, the pair is trading at 110.13, with the USD trading 0.17% lower against the JPY from yesterday's close.
Overnight data showed that Japan's final Nikkei manufacturing PMI was revised lower to a level of 52.1 in July, compared to a preliminary print that indicated a drop to an eight-month low level of 52.2. In the prior month, the manufacturing PMI had recorded a reading of 52.4.
The pair is expected to find support at 109.84, and a fall through could take it to the next support level of 109.54. The pair is expected to find its first resistance at 110.60, and a rise through could take it to the next resistance level of 111.06.
Moving ahead, market participants will look forward to Japan's consumer confidence for July, slated to release tomorrow.
The currency pair is trading below its 20 Hr and 50 Hr moving averages.

Swiss Franc Trading Higher In The Morning Session
For the 24 hours to 23:00 GMT, the USD declined 0.08% against the CHF and closed at 0.9673.
On the data front, Switzerland’s total sight deposits remained steady at a level of CHF579.1 billion in the week ended 28 July.
In the Asian session, at GMT0300, the pair is trading at 0.9667, with the USD trading 0.06% lower against the CHF from yesterday’s close.
The pair is expected to find support at 0.9632, and a fall through could take it to the next support level of 0.9596. The pair is expected to find its first resistance at 0.9708, and a rise through could take it to the next resistance level of 0.9748.
Amid a holiday observed in Switzerland today, trading trend in the CHF will be governed by global macroeconomic news.
The currency pair is showing convergence with its 20 Hr moving average and trading below its 50 Hr moving average.

Loonie Trading Flat In The Asian Session, Ahead Of Canadian Manufacturing PMI Data
For the 24 hours to 23:00 GMT, the USD rose 0.17% against the CAD and closed at 1.2497.
In the Asian session, at GMT0300, the pair is trading at 1.2497, with the USD trading flat against the CAD from yesterday’s close.
The pair is expected to find support at 1.2452, and a fall through could take it to the next support level of 1.2408. The pair is expected to find its first resistance at 1.2535, and a rise through could take it to the next resistance level of 1.2574.
Looking ahead, traders will keep a close watch on Canada’s Markit manufacturing PMI for July, slated to release later today.
The currency pair is showing convergence with its 20 Hr and 50 Hr moving averages.

RBA Maintained Status Quo, Warned that Strong Aussie is Curbing Growth
As widely anticipated, the RBA left the cash rate unchanged at 1.5%. Policymakers acknowledged that June inflation drifted back below the +2% target but remained confident it would improve gradually alongside the pickup of the economy. Policymakers, however, warned of Australian dollar's appreciation, suggesting that it would limit economic growth. A reference of the negative impact of strong currency on economic developments reappeared as AUDUSD has risen +5.7% from July's low of 0.7567.
RBA noted that inflation came in "broadly as the bank expected", adding that "both CPI inflation and measures of underlying inflation are running at a little under 2%". Policymakers believed that inflation would "pick up gradually as the economy strengthens. Higher prices for electricity and tobacco are expected to boost CPI inflation. A factor working in the other direction is increased competition from new entrants in the retail industry". In the second quarter, Australia's headline CPI eased to +1.9% y/y while the core CPI improved modestly to +1.5% y/y
However, currency appreciation is somehow tightening the economy. As the central bank suggested, the recent strength in Australian dollar was "partly reflecting a lower US dollar". It added that "the higher exchange rate is expected to contribute to subdued price pressures in the economy. It is also weighing on the outlook for output and employment. An appreciating exchange rate would be expected to result in a slower pick-up in economic activity and inflation than currently forecast". In July, the accompanying statement only noted "an appreciating exchange rate would complicate" the economic transition progress.
On the monetary policy, RBA reiterated that "taking account of the available information, the Board judged that holding the stance of monetary policy unchanged at this meeting would be consistent with sustainable growth in the economy and achieving the inflation target over time". Regarding questions over the impacts of US's rate hike schedule and ECB's more hawkish stance on RBA's monetary outlook, Governor Philip Lowe noted that there's no "automatic" link among the issues. It appeared that the central bank would keep its policy rate unchanged at the current level for some time.