
Sample Category Title
GDP Price Index Missed, Skinny Obamacare Repeal Collapsed, Dollar to End the Week Lower
Dollar is set to end the week as the second weakest currency as slightly better than expected growth data provides little support. Q2 GDP grew 2.6% annualized, up from prior 1.4% and versus consensus of 2.5%. However, GDP price index slowed to 1.0%, down from 1.9% and below expectation of 1.3%. Employment cost index rose 0.5% in Q2, also below expectation of 0.6%. Subdued inflation will affirm the case for Fed to starting shrinking the balance in September first, and leave another rate hike to December. This will give Fed more time to assess inflation and growth outlook before raising interest rates. Also from US session, Canada GDP rose 0.6% mom in May, much stronger than expectation of 0.2% mom.
Skinny Obamacare repeal bill collapsed
Political uncertainty is also another factor that weighs on the Dollar. After a months-effort by Senate Republicans, another attempt at repealing Obamacare collapsed. The "skinny" version of the Obama repeal bill was voted down by John McCain and two more Republicans. Senate Majority Leader, Mitch McConnell said that "this is clearly a disappointing moment" and "it's time to move on." US President Donald Trump is now expected to move on to his expansive fiscal policies. However, the lack of political leadership aside, the failure of border tax and Obamacare repeal now raised questions on whether Trump could balance the books for tax reforms and infrastructure spending.
Eurozone data positive
Euro continues it's march higher against Swiss Franc while staying in range against Dollar and Yen. Economic data from Eurozone are generally positive. German CPI rose 0.4% mom 1.7% yoy in July, picked up from prior 0.2% mom and 1.6%. That also beat expectation of 0.2% mom, 1.5% yoy. French GDP grew 0.5% qoq in Q2, in line with consensus. Eurozone business climate dropped to 1.05 in July. Economic confidence rose to 111.2, industrial confidence was unchanged at 4.5, services confidence rose to 14.1, consumer confidence dropped to -1.7. Also from Europe, Swiss KOF leading indicator rose to 105.5 in July.
Japan national CPI core unchanged at 0.4% yoy
A bunch of economic data is released from Japan today. National CPI core was unchanged at 0.4% yoy in June. Tokyo CPI core rose to 0.2% yoy in July, up from 0.0% yoy and beat expectation of 0.1% yoy. Unemployment rate dropped to 2.8% in June versus expectation of 3.0%. Household spending rose 2.3% yoy, retail sales rose 2.1% yoy. Core inflation remained well below BoJ's 2% target. Indeed, the central bank has lowered inflation forecast for the current fiscal year to 1.1% and pushed back the timing for hitting the target by a year. And the summary of opinions of the July meeting also showed that one member is concerned that repeated delays would hurt BoJ's credibility. Based on current outlook, there is little chance for BoJ to follow other major global central banks to start exiting from stimulus.
USD/JPY Mid-Day Outlook
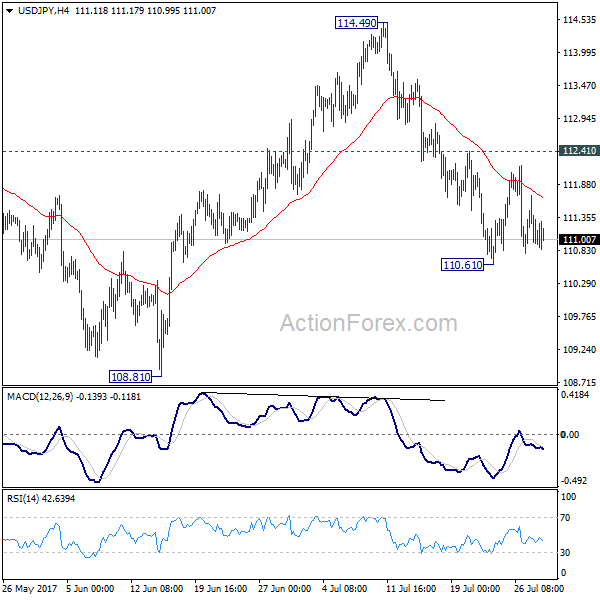
Daily Pivots: (S1) 110.79; (P) 111.25; (R1) 111.72; More...
USD/JPY is still bounded in consolidation above 110.61 temporary low and intraday bias remains neutral. As long as 112.41 resistance holds, further decline is expected. Break of 110.61 will target 108.81. Break there will resume whole correction from 118.65 and target 61.8% retracement of 98.97 to 118.65 at 106.48. Nonetheless, break of 112.41 will dampen this bearish view and turn focus back to 114.49 resistance instead.
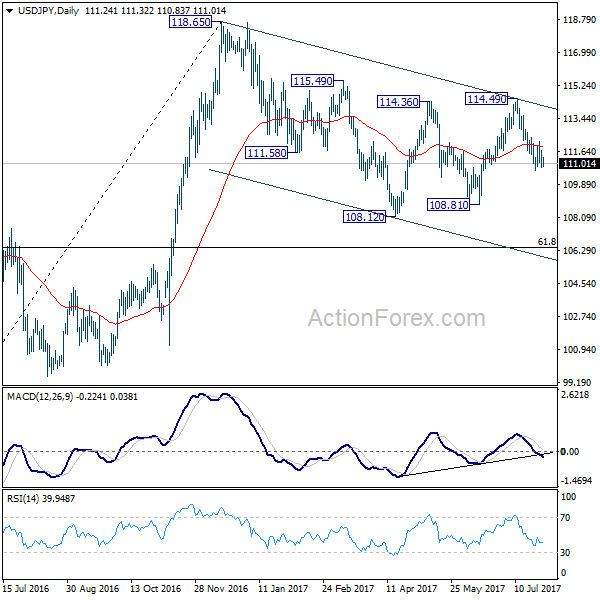
In the bigger picture, the corrective structure of the fall from 118.65 suggests that rise from 98.97 is not completed yet. Break of 118.65 will target a test on 125.85 high. At this point, it's uncertain whether rise from 98.97 is resuming the long term up trend from 75.56, or it's a leg in the consolidation from 125.85. Hence, we'll be cautious on topping as it approaches 125.85. If fall from 118.65 extends lower, down side should be contained by 61.8% retracement of 98.97 to 118.65 at 106.48 and bring rebound.
Economic Indicators Update
| GMT | Ccy | Events | Actual | Forecast | Previous | Revised |
|---|---|---|---|---|---|---|
| 23:01 | GBP | GfK Consumer Confidence Jul | -12 | -11 | -10 | |
| 23:50 | JPY | BOJ Summary of Opinions July Meeting | ||||
| 23:30 | JPY | National CPI Core Y/Y Jun | 0.40% | 0.40% | 0.40% | |
| 23:30 | JPY | Tokyo CPI Core Y/Y Jul | 0.20% | 0.10% | 0.00% | |
| 23:30 | JPY | Jobless Rate Jun | 2.80% | 3.00% | 3.10% | |
| 23:30 | JPY | Household Spending Y/Y Jun | 2.30% | 0.50% | -0.10% | |
| 23:50 | JPY | Retail Trade Y/Y Jun | 2.10% | 2.30% | 2.00% | 2.10% |
| 01:30 | AUD | PPI Q/Q Q2 | 0.50% | 0.60% | 0.50% | |
| 01:30 | AUD | PPI Y/Y Q2 | 1.70% | 1.30% | ||
| 05:30 | EUR | French GDP Q/Q Q2 A | 0.50% | 0.50% | 0.50% | |
| 07:00 | CHF | KOF Leading Indicator Jul | 106.8 | 106 | 105.5 | 105.8 |
| 09:00 | EUR | Eurozone Economic Confidence Jul | 111.2 | 110.8 | 111.1 | |
| 09:00 | EUR | Eurozone Business Climate Indicator Jul | 1.05 | 1.14 | 1.15 | 1.16 |
| 09:00 | EUR | Eurozone Industrial Confidence Jul | 4.5 | 4.3 | 4.5 | |
| 09:00 | EUR | Eurozone Services Confidence Jul | 14.1 | 13.4 | 13.4 | 13.3 |
| 09:00 | EUR | Eurozone Consumer Confidence Jul F | -1.7 | -1.7 | -1.7 | -1.3 |
| 12:00 | EUR | German CPI M/M Jul P | 0.40% | 0.20% | 0.20% | |
| 12:00 | EUR | German CPI Y/Y Jul P | 1.70% | 1.50% | 1.60% | |
| 12:30 | CAD | GDP M/M May | 0.60% | 0.20% | 0.20% | |
| 12:30 | USD | GDP (Annualized) Q2 A | 2.60% | 2.50% | 1.40% | |
| 12:30 | USD | GDP Price Index Q2 A | 1.00% | 1.30% | 1.90% | |
| 12:30 | USD | Employment Cost Index Q2 | 0.50% | 0.60% | 0.80% | |
| 14:00 | USD | U. of Michigan Confidence Jul F | 93.1 | 93.1 |
Dollar Struggles in July
July has certainly been a painful trading month for the Greenback, with today's second quarter economic growth figures from the US offering little support to the beleaguered currency. The US economy expanded by 2.6% in the second quarter of 2017 on the back of strong consumer spending which was a solid pick up from the soft first quarter growth reading of 1.2%. Although US GDP printed in line with expectations, price action suggests that concerns over stubbornly low inflation in the US, as well as political risk, continue to weigh heavily on the Dollar.
With the Greenback falling into the category of currency's that have become increasingly sensitive to monetary policy speculations, and market expectations for a 25 basis point rate hike in December standing at 46.6%, further downside may be on the cards. Dollar bullish investors are clearly lacking the inspiration to support prices and may turn towards next week's NFP report for further insight into the health of the US economy and labor force.
From a technical standpoint, the Dollar Index is bearish on the daily timeframe as there have been consistently lower lows and lower highs. Prices are trading below the daily 20 SMA, while the MACD has crossed to the downside. A breakdown below 93.40 should encourage a further selloff towards 93.00.
Trade Idea Update: USD/CHF – Buy at 0.9600
USD/CHF - 0.9689
Original strategy :
Buy at 0.9600, Target: 0.9700, Stop: 0.9565
Position : -
Target : -
Stop : -
New strategy :
Buy at 0.9600, Target: 0.9700, Stop: 0.9565
Position : -
Target : -
Stop : -
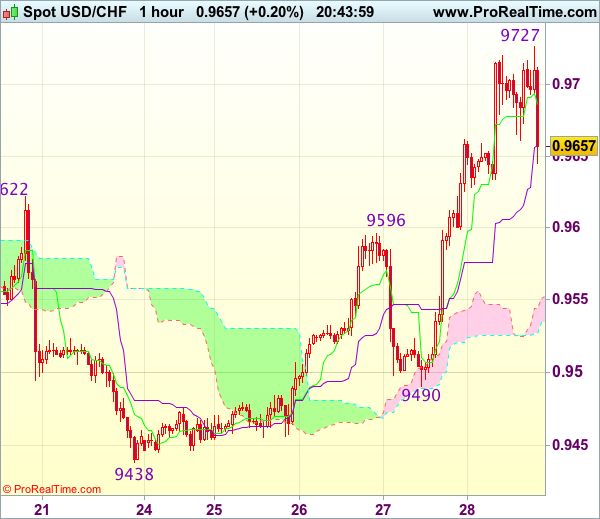
Although the greenback slipped to 0.9490 earlier today, renewed buying interest emerged and dollar has rallied above indicated resistance at 0.9622-35, confirming recent decline has ended at 0.9438, hence upside bias is seen for the move from there to extend gain to 0.9730, however, break there is needed to retain bullishness and encourage for headway to 0.9750-60 first.
In view of this, would not chase this rise here and would be prudent to buy dollar on pullback as previous resistance at 0.9596 should turn into support and contain dollar’s downside. Below 0.9570 would defer and risk test of the upper Kumo (now at 0.9551) but price should stay well above support at 0.9490, bring another rise later.
Trade Idea Update: GBP/USD – Stand aside
GBP/USD - 1.3077
New strategy :
Stand aside
Position : -
Target : -
Stop : -
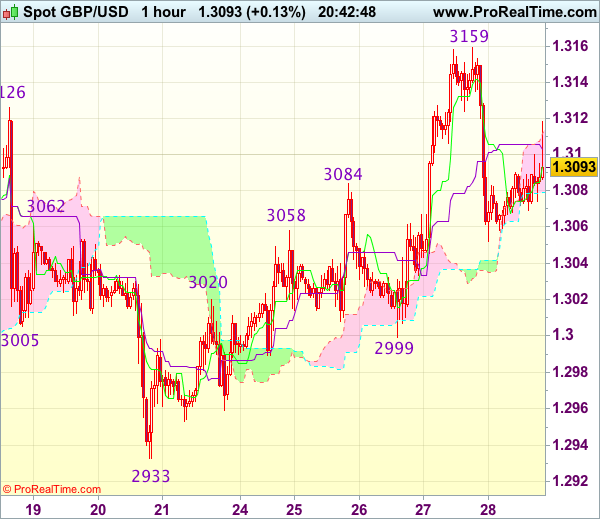
Despite yesterday’s marginal rise to 1.3159, the subsequent sharp retreat suggests top has possibly been formed there and downside risk has increased for retracement of recent upmove to 1.3035-40, however, only break of support at 1.2999 would confirm recent upmove has ended, bring further fall to 1.2980 and later towards 1.2955-60.
In view of this, would be prudent to stand aside in the meantime. Above 1.3120 would bring recovery to 1.3140 but only break of said resistance at 1.3159 would revive bullishness and signal recent upmove has resumed for headway to 1.3185-90 and then 1.3210-20.
NZD/USD Turned to the Downside
Price is going down after the false breakout above the third warning line (WL3) of the former descending pitchfork. Has ignored the 0.7484 static support (resistance turned into support) and now is going down, a retest of the WL3 will bring us a perfect selling opportunity.
USD/CHF Approaches Another Target
Price rallies and extends the latest gains, you could see that is very close to hit the median line (ml) of the descending pitchfork, where he could find temporary support. Has increased aggressively, ignoring the USDX's drop, is trading much above the 0.9634 broken resistance.
A valid breakout above the median line (ml) will confirm a further increase, this scenario could take shape only if the US data will come in better later.
USD/CAD Canadian and US Data Eyed
The currency pair decreased today and is trying to correct after the yesterday's impressive rally, is trading in the red also because is still under massive selling pressure. Remains to see how will react after the United States and Canadian data will be released.
You should be careful because the economic figures will bring life on the currency market, we may have a high volatility on this pair and you don't want to suffer a heavy loss.
The United States Advance GDP may increase by 2.5% i the second quarter, more versus the 1.4% in Q1, while the Advance GDP Price Index could increase by 1.3%, less compared to the 1.9% in the previous reading period. The Employment Cost Index is expected to increase by 0.6% in Q2, less versus the 0.8% in Q1, while the Revised UoM Consumer Sentiment could climb from 93.1 to 93.2 points. The greenback needs a strong support from the US economy to be able to resume the yesterday's rebound.
Price rebounded in the yesterday's session and invalidated the breakdown below the 1.2460 long term support and below the confluence formed by the warning line (wl4) with the lower median line (lml) of the black descending pitchfork. Has slipped lower today and awaits the economic data, could increase further if the US numbers will impress.
Is trading right below the 1.2450 psychological level and could come down to retest the support levels, only a rejection from the mentioned downside obstacles will signal a reversal.
You can see that we had a false breakdown below from the black descending pitchfork, but the failure to reach the lower median line (lml) of the blue descending pitchfork and the lower median line (LML) of the major (red) descending pitchfork could send the rate much higher again, but unfortunately will be driven by the fundamental factors.
Trade Idea Update: EUR/USD – Stand aside
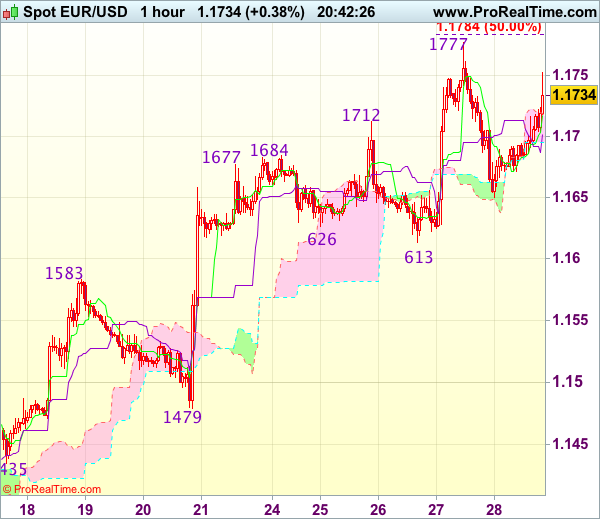
EUR/USD - 1.1745
New strategy :
Stand aside
Position : -
Target : -
Stop : -
As the single currency found support at 1.1650 and has recovered, suggesting further recovery to 1.1755-60 cannot be ruled out, however, break of this week’s high at 1.1777 is needed to signal recent upmove has once again resumed and extend gain to 1.1784-85 (50% projection of 1.1370-1.1712 measuring from 1.1613). then 1.1800 but loss of near term upward momentum should prevent sharp move beyond 1.1820-25 (61.8% projection), risk from there has increased for a retreat later.
As near term outlook is mixed, would be prudent to stand aside in the meantime. Below 1.1700 would bring test of said support at 1.1650 but break there is needed to signal a temporary top is possibly formed, bring further weakness towards support at 1.1613, having said that, price should stay well above previous resistance at 1.1583 (now support), bring another rise later.
Trade Idea Update: USD/JPY – Hold short entered at 111.45
USD/JPY - 111.00
Original strategy :
Sold at 111.45, Target: 110.45, Stop: 111.75
Position : - Short at 111.45
Target : - 110.45
Stop : - 111.75
New strategy :
Hold short entered at 111.45, Target: 110.45, Stop: 111.75
Position : - Short at 111.45
Target : - 110.45
Stop : - 111.75
Although the greenback staged a rebound from 110.78 to 111.71, the subsequent retreat has retained our bearishness for a retest of this week’s low at 110.62, however, break there is needed to confirm recent decline has resumed and extend further weakness to 110.30-35 but reckon 110.00-05 would hold from here.
In view of this, we are holding on to our short position entered at 111.45. Above said resistance at 111.71 would defer and prolong choppy trading, however, price should still falter below said resistance at 112.20, bring retreat later.

Another Devastating Blow For Trump Spooked Investors | Euro| Euro Moves Higher on French Data
- Another major blow for Trump made traders angry
- French GDP matched the forecast and the euro moved higher
Over in Europe, the French GDP data brought more light for the Eurozone's economy. The problem child of the Eurozone is no longer a problem child, in fact, it has grown up and is living up to the expectations. The GDP number matched the forecast of 0.5% and this would stem the rally for the euro further. However, the overall focus in the market is on a much bigger picture which has taken over every single headline.
Trump had another fresh blow and this one is really an ugly one. The Senate did what Trump was not expecting, the repeal of Obamacare was blocked. It appears that the Obama Care has become a nightmare for Trump and no good news for the markets as well. The ability of Trump to deliver on his so many promises such as tax and stimulus packages are really shattered. This is going to have a negative impact on the markets as the trump trade would wind up even further. It will also bring more bleeding for the dollar which is already bruised badly.
So the trade would be to go heavy against the Trump trade and that is what most investors would focus on. Let's just say that without those stimulus packages and the tax reforms, we could say good bye to the Trump dream. The GDP growth of 3 percent or higher which he promised is not going to see the daylight anytime soon.
The only card which is left for President Trump to play is perhaps the debt ceiling and he may have some chance to twist the arms of others to get what he wants. The other option is that he just moves on from here and admit defeat.
The only element which could support the dollar today is the US advance GDP data and the bar is set high. The forecast is 2.5% while the previous reading was at 1.4%.
If the repealing of Obamacare is bad news for the dollar, it brings fresh fuel for the gold rally. We do think that maybe after a small pullback in the gold price, the path of least resistance would remain skewed to the upside. The Fed would have to be very careful in terms of their current strategy.