Sample Category Title
Daily Technical Analysis: EURUSD, GBPUSD, USDJPY, USDCHF
EURUSD
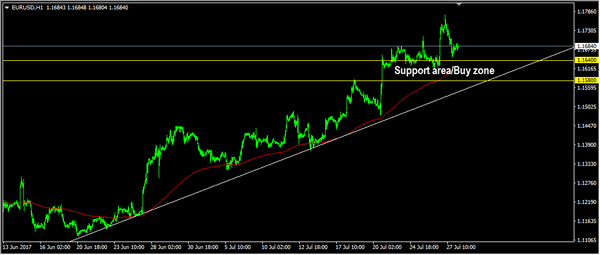
The EURUSD was corrected lower yesterday bottomed at 1.1650. That is a normal corrective movement and overall I remain bullish. The bias is bearish in nearest term testing 1.1640 – 1.1580 support area which is a good place to buy with nearest target seen around 1.1875. Immediate resistance is seen around 1.1712. A clear break above that area could lead price to neutral zone in nearest term retesting 1.1776 region. On the downside, a clear break and daily/weekly close below 1.1580 and the trend line support would signal further bearish correction and activate my neutral mode.
GBPUSD
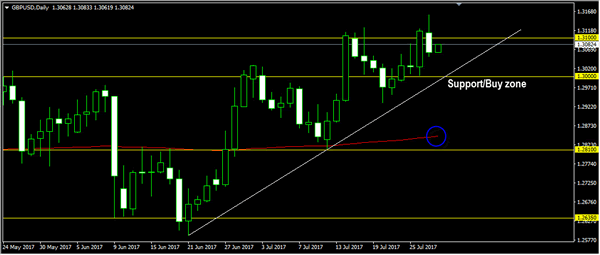
The GBPUSD attempted to push higher yesterday topped at 1.3159 but whipsawed to the downside and closed lower at 1.3062. The bias is bearish in nearest term testing 1.3000 area which is a good place to buy with a tight stop loss. Immediate resistance is seen around 1.3100/25. A clear break above that area could lead price to neutral zone in nearest term but would keep the major bullish bias remain strong retesting 1.3159 or higher. Overall I remain bullish but a clear break and daily/weekly close below 1.3000 would signal further bearish correction next week.
USDJPY
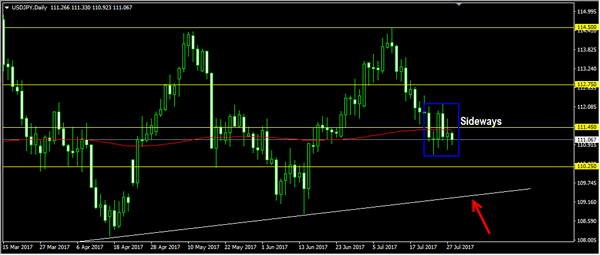
The USDJPY was indecisive yesterday. The bias is neutral in nearest term. Price has been moving sideways without clear direction this week. Immediate support is seen around 110.60. A clear break and daily/weekly close below that area could trigger further bearish pressure testing the trend line support and 109.50/00 support area next week which is a good place to buy. Immediate resistance is seen around 111.50/70 region. A clear break above that area would expose 112.75 region. Overall I remain neutral.
USDCHF
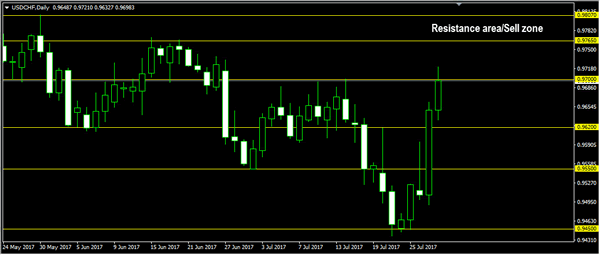
The USDCHF had a strong bullish momentum yesterday topped at 0.9661 and hit 0.9721 earlier today in Asian session. The bias is bullish in nearest term testing 0.9765 – 0.9807 resistance area which is s good place to sell. Immediate support is seen around 0.9650. A clear break below that area could lead price to neutral zone in nearest term testing 0.9595/50 area. Overall I remain bearish but need a clear break at least back below 0.9550 to keep the bearish outlook remain strong.
US Data Prints On The Soft Side, Russia Central Bank To Stay On Hold
US data in focus as USD extends losses
Durable goods orders printed well above median forecast suggesting a solid recovery in June after two months of contraction. The headline gauge increased 6.5%m/m versus 3.9% expected and an upwardly revised figure of -0.1% in May. The upside surprise was essentially due to a sharp bounce in new orders for aircraft, thanks to the Paris Air Show (23-25 June). Excluding the volatile transportation components, core durable goods orders came in below estimates, printing at 0.2%m/m versus 0.4% expected and 0.6% previous reading. Overall, the report suggests that the manufacturing activity continues to expand at a moderate pace, while the anaemic demand for consumer goods such as vehicles and electronic products signals households’ consumption is not ready to take of yet, which is of bad omen for inflation.
Talking about inflation, the core personal expenditure index for the second quarter is due for release later today. The gauge is expected to have increased 0.7% (SAAR), down from a rise of 2% in the first quarter. Although the slowdown in inflation pressures has already been documented through the last months, financial markets are not immune to sharp adjustments should the gauge surprise in either direction.
US Q2 GDP is anticipated to have accelerated to 2.7% (q/q annualised) compared to a reading of 1.4% in the previous quarter, mostly due to heightened expectations for personal consumption - 2.8% (saar) consensus and 1.1% in Q1.
On Friday, EUR/USD stabilised at around 1.17 after printing a multi-year high at 1.1777 on Thursday. The broad-based dollar weakness of the recent months was enhanced by the Fed’s dovish statement released on Wednesday. Investors will have to wait September to get further clarity on both the ECB and Fed thinking, which means the market will become more sensitive to economic data than usual, especially inflation figures.
Russia: Rate decision over sanctions fears
The ruble is trading sideways around 60 ruble and this may not last long as the USDRUB pair is under pressures. While the Russian economic data are improving, there are other geopolitical issues that may have strong consequences on the future of the Russian economy. Indeed, U.S senate has finally approved further strengthening of sanctions which would prevent Donald Trump from lifting them. Now Trump must revise this legislation which sounds contradictory knowing that his relation with Russia during his campaign are under investigation. There may be there a conflict of interest.
Some say that there is now growing risks that Russia, under the US sanctions, could face decades of low growth. Other economic fundamentals such as low oil prices, which remain below $50, are also weighing on the Russian economy. Inflation, even though declining, are still very high and should likely end up to 5% before year-end (4.4% at the moment). We believe that the Central Bank of Russia has some room for normalizing its monetary policy. In addition, the CBR needs to guarantee price stability because of sanctions will which will drive policymakers not tighten rates. As a result, key rate is then set to remain at 9%. We target 58 ruble for one dollar in the medium-term as we consider the ruble is still one good carry trade with, even though existing but limited downside risks.
Bitcoin Consolidating Around $2500
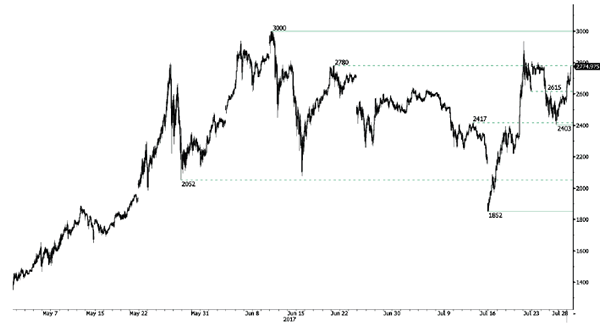
Bitcoin's volatility has declined. Strong resistance can be found at 3000 (12/06/2017 high) and hourly support lies at 2403 (26/07/2017 low). Further retracement are expected.
In the long-term, the digital currency has had an exponential growth. There are decent likelihood that the asset will consolidate above $1500. Long-term support is given at $1464 (04/05/2017 low).
Trade Idea: GBP/JPY – Stand aside
GBP/JPY - 145.25
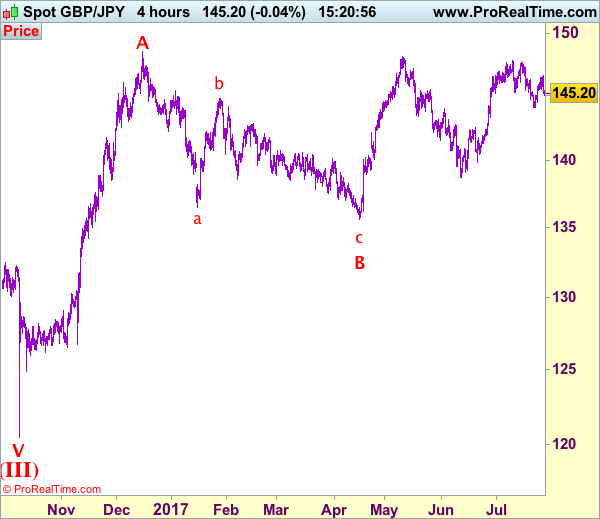
Recent wave: Medium term low formed at 120.50 and (A)-(B)-(C) major correction has commenced with (A) leg ended at 148.45, hence wave (B) is unfolding for retreat to 131.00-10.
Trend: Near term up
Original strategy:
Sold at 145.90, stopped at 146.50
Position: - Short at 145.90
Target: -
Stop: - 146.50
New strategy :
Stand aside
Position: -
Target: -
Stop:-
Although sterling moved higher to 146.55 yesterday, lack of follow through buying and the subsequent retreat suggest further consolidation would be seen and weakness to 144.80-85 cannot be ruled out, however, below support at 144.45-50 is needed to signal the rebound from 144.00-05 has ended, bring test of this level, break there would add credence to our view that a temporary top has been formed at 147.75 earlier this month, bring retracement of recent upmove to 143.50, then towards support at 143.30.
On the upside, above said resistance at 146.55 would signal low has been formed at 144.05 and bring a stronger rebound to 146.90-00 and possibly towards 147.30. As near term outlook is still mixed, would be prudent to stand aside in the meantime.
Our preferred count is that larger degree wave V with circle is unfolding from 251.12 with wave (I) 219.34, (II): 241.38 and wave (III) is subdivided into 1: 192.60, 2: 215.89 (23 Jul 2008) and wave 3 ended at 118.87 earlier in 2009. The correction from there to 162.60 is wave 4 which itself is a double three and is labeled as first a-b-c ended at 151.53, followed by wave x at 139.03, 2nd a ended at 162.60, 2nd b at 146.75 and 2nd c leg of wave 4 ended at 163.00. Therefore, the decline from 163.00 to 116.85 is now treated as wave 5 which also marked the end of larger degree wave (III), hence wave (IV) major correction has commenced for retracement of the wave (III) from 241.38 and upside target at 183.95-00 (50% Fibonacci retracement of the wave (II) from 241.38) had been met, a drop below 160.00 would suggest wave (IV) has ended at 195.85, bring decline in wave (V) for initial weakness to 130 (already met) and 120.
Crude Oil Strong Bullish Momentum
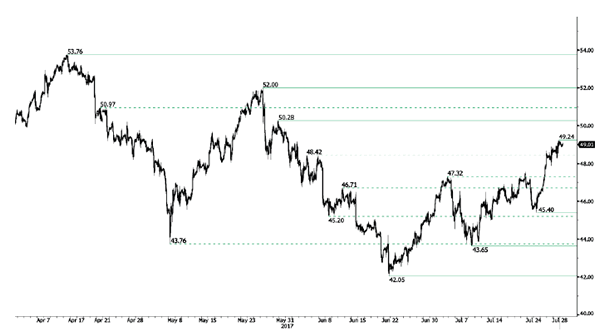
Crude oil is trading higher Hourly support is given at 45.40 (24/07/2017 low). Strong resistance given at 50.28 (29/05/2017). Expected to show further bearish consolidation before another leg higher.
In the long-term, crude oil has recovered after its sharp decline last year. However, we consider that further weakness are very likely. Strong support lies at 35.24 (05/04/2016) while resistance can now be found at 55.24 (03/01/2017 high).
Silver Riding Bullish Channel
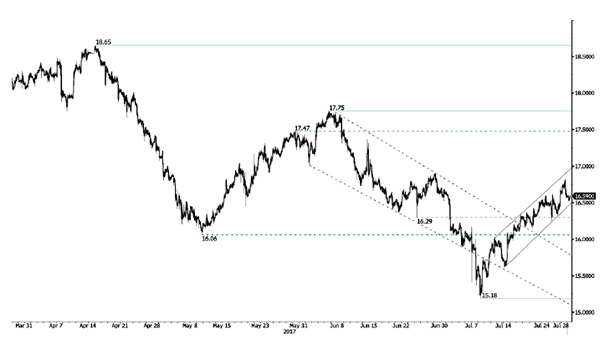
Silver is pushing higher after the bounce from hourly support given at 15.18 (10/07/2017 low). Key resistance is given at a distance at 17.75 (06/06/2017 high). The commodity continues its short-term bullish increase.
In the long-term, the death cross indicates that further downsides are very likely. Resistance is located at 25.11 (28/08/2013 high). Strong support can be found at 11.75 (20/04/2009).
Trade Idea: GBP/USD – Stand aside
GBP/USD – 1.3090
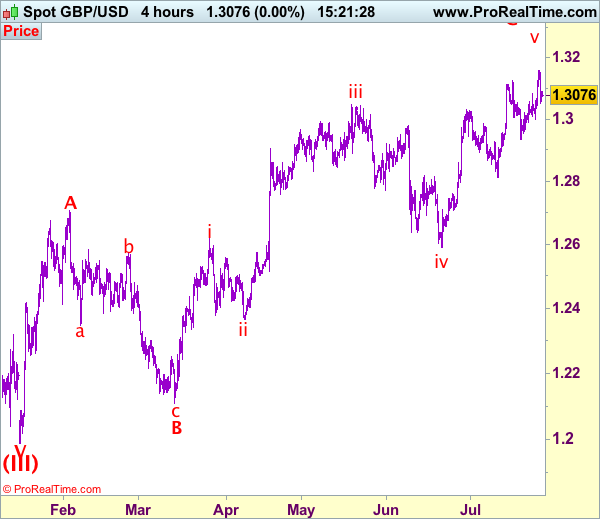
Recent wave: Wave V of larger degree wave (III) has ended at 1.1986 and major correction has commenced from there for gain to 1.3000 and 1.3140-50
Trend: Near term up
New strategy :
Stand aside
Position: -
Target: -
Stop:-
Despite rising to 1.3159 yesterday, lack of follow through buying and the subsequent retreat suggest consolidation below this level would be seen and pullback to 1.3050 cannot be ruled out, however, break of 1.2995-00 is needed to suggest a temporary top is possibly formed, bring retracement of recent rise to 1.2955-60 but support at 1.2933 should hold from here.
On the upside, expect recovery to be limited to 1.3120-25 and said resistance at 1.3159 should hold, bring further consolidation, only break of said resistance at 1.3159 would signal recent upmove has once again resumed and extend further gain to 1.3190-00, however, as this move is still viewed as the final wave v of larger degree wave C, reckon upside would be limited to 1.3240-50 and price should falter below 1.3300-10, then sterling shall retreat sharply from there.
Our preferred count on the daily chart is that cable's rebound from 1.3500 (wave (A) trough) is unfolding as a wave (B) with A ended at 1.7043, followed by triangle wave B and wave C as well as wave (B) has ended at 1.7192, the subsequent selloff is the larger degree wave (C) which is still unfolding with minor wave (III) of larger degree wave 3 ended at 1.1986, hence wave (IV) correction is in progress which could either be a triangle wave (IV) of a complex formation but upside should be limited to 1.3500 and price should falter well below 1.4000, bring another decline in wave (V) of 3 for weakness to 1.1500, then 1.1200.
GOLD Bullish
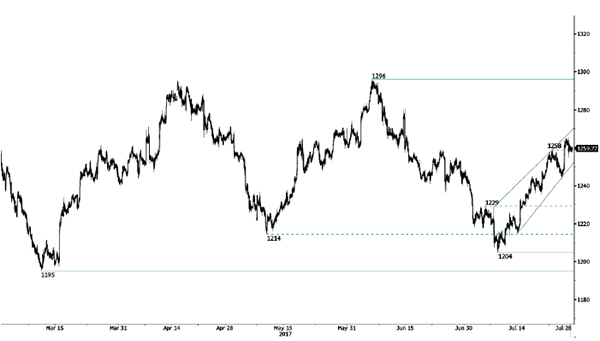
Gold continues to grow. Strong support is given at 1204 10/07/2017 high). Hourly resistance at 1258 (23/06/2017 high) has been broken. Expected to show continued strengthening.
In the long-term, the technical structure suggests that there is a growing upside momentum. A break of 1392 (17/03/2014) is necessary ton confirm it, A major support can be found at 1045 (05/02/2010 low)
EUR/CHF Very Strong Bullish Momentum
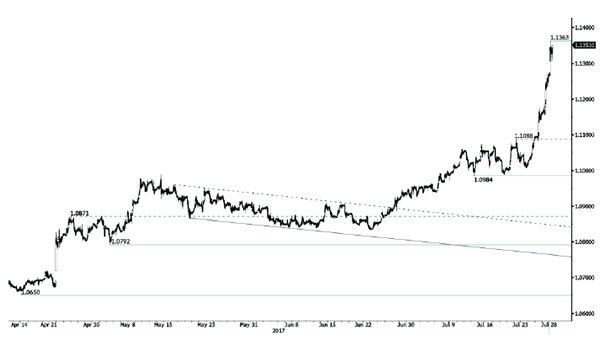
EUR/CHF is still trading above psychological level at 1.1000 and the pair is heading sharply higher. s. Hourly support is located at a distance at 1.0984 (13/07/2017 low). Road is wide-open for further strengthening.
In the longer term, the technical structure is mixed. Resistance can be found at 1.1200 (04/02/2015 high). Yet,the ECB's QE programme is likely to cause persistent selling pressures on the euro, which should weigh on EUR/CHF. Supports can be found at 1.0184 (28/01/2015 low) and 1.0082 (27/01/2015 low).
EUR/GBP Short-Term Weakness
EUR/GBP is very volatile. The pair is consolidating lower. Hourly support is given at a distance at 0.8742 (16/06/2017 low). Downside risks are important.
In the long-term, the pair has largely recovered from recent lows in 2015. The technical structure suggests a growing upside momentum. The pair is trading above from its 200 DMA. Strong resistance can be found at 0.9500 psychological level.