Sample Category Title
EURUSD Intraday Analysis
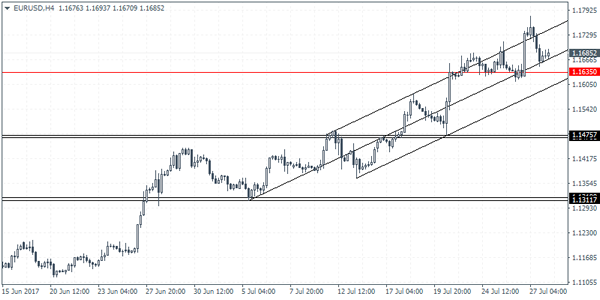
EURUSD (1.1685): The EURUSD closed bearish yesterday after briefly reaching for a new 3-year high. The common currency fell following a brief gain in the US dollar index. Still, the declines are expected to be limited to the immediate support found at 1.635. Only a breach of this support will spell further weakness in the currency pair. The next main technical support sits at 1.1475 which could be tested in the short-term basis. Alternately, a reversal at 1.1635 will keep the EURUSD supported to the upside. But price action will need to push higher in order to maintain the steady pace of gains.
Dollar Gains On Durable Goods Orders. Q2 GDP Awaited
The US dollar managed to pare losses, rising on the back of a better than expected durable goods orders report yesterday. Data from the commerce department showed that durable goods orders rose 6.5% on the month in June. This marked the quickest pace of increase in three years and beat estimates of a 3.8% increase.
The US dollar index briefly fell to a 13-month session low before managing to close the day with gains.
Looking ahead, traders will be watching the advance GDP report from the US today. According to the economists polled, the US GDP is expected to have increased 2.5% on the quarter, following a 1.4% increase in GDP in Q1. From the eurozone, flash GDP numbers from France and Spain are due while Germany will be reporting the preliminary inflation data for July.
Trade Idea: EUR/JPY – Stand aside
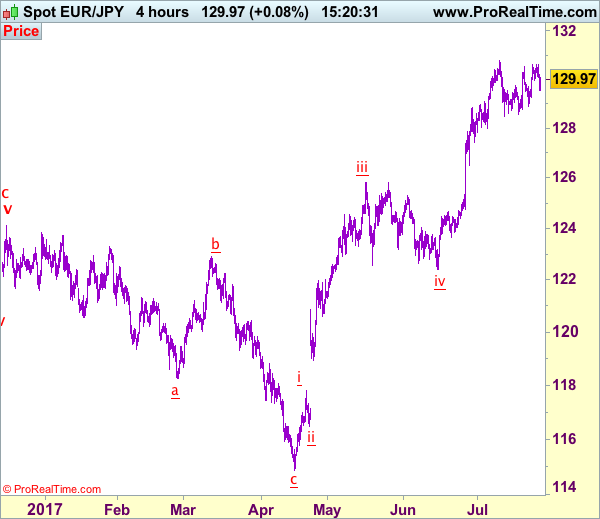
EUR/JPY - 129.93
Recent wave: wave v of (C) ended at 94.12 and major correction in wave A has ended at 149.79
Trend: Near term up
New strategy :
Stand aside
Position: -
Target: -
Stop:-
Despite edging higher to 130.61 yesterday, the subsequent retreat has retained our view that further consolidation below recent high at 130.77 would be seen and pullback to 129.45-50 is likely, however, reckon downside would be limited to 129.20-25 and 128.49-57 support should hold, bring another rise later.
On the upside, above 130.61 would bring retest of said resistance at 130.77 but break there is needed to confirm recent upmove has resumed and bring further gain to 131.00-10, above there would encourage for headway to 131.50, however, loss of upward momentum should prevent sharp move beyond latter level and reckon 132.00 would hold from here, risk from there is seen for a retreat later.
Our latest preferred count is that wave (ii) is ABC-X-ABC which ended at 123.33 and wave (iii) is unfolding with wave iii ended at 100.77, followed by wave iv at 111.57 and wave v as well as the wave (iii) has ended at 97.04, followed by wave (iv) at 111.43 and wave (v) has ended at 94.12 which is also the end of the larger degree v, this also implied the major wave (C) has also ended there, hence major correction has commenced from there with (A) leg unfolding in its lower degree wave c which has possibly ended at 145.69. Under this count, A-B-C wave (B) has commenced with A leg ended at 136.23, wave B at 143.79 and wave C has possibly ended at 149.79.
Our larger degree count is that the decline from 139.26 is wave (C) and is sub-divided into a diagonal triangle i-ii-iii-iv-v with wave i - 105.44, wave ii- 123.33, wave iii - 97.03, wave iv - 111.43, followed by the final wave v as well as the end of wave (C) at 94.12, this also mark the bottom of larger degree wave B. Under this count, major rise in wave C has commenced as an impulsive wave with minor wave III ended at 145.69, wave V is still in progress for further gain to 150.00. Having said that, this so-called wave V could well be the first leg of larger degree 5-waver wave C and this wave C should bring at least a retest of wave A top at 169.97 (July 2008).
Trade Idea: AUD/USD – Buy at 0.7880 or sell at 0.8020
AUD/USD – 0.7979
Recent wave: Wave 5 ended at 1.1081 and major correction has commenced for fall to 0.7000 and then towards 0.6500-10
Trend: Near term up
Original strategy :
Buy at 0.7890, Target: 0.8090, Stop: 0.7830
Position: -
Target: -
Stop: -
New strategy :
Buy at 0.7880, Target: 0.8080, Stop: 0.7820
O.C.O.
Sell at 0.8020, Target: 0.7880, Stop: 0.8080
Position: -
Target: -
Stop:-
Although aussie extended recent upmove to 0.8066 yesterday, the subsequent retreat suggests the wave iii top is possibly formed there and consolidation with mild downside bias is seen for correction in wave iv, hence weakness to 0.7900 is likely, however, reckon previous support at 0.7875-78 would hold and renewed buying interest should emerge there, bring another rise later. Above said resistance at 0.8066 would signal recent upmove is still in progress for headway to 0.8100, then 0.8140-50 but overbought condition should limit upside to 0.8190-00, bring retreat later. We are keeping our latest bullish count that recent impulsive waves is unfolding as (1 2, (i)(ii), i ii) and may extend headway to aforesaid upside targets.
In view of this, whilst we are looking to buy aussie on subsequent pullback, we would turn short on recovery as 0.8020-30 should limit upside. A sustained breach below support at 0.7875 would defer and risk correction to 0.7810-20, however, still reckon downside would be limited to 0.7786 and price should stay well above wave i top at 0.7712.
On the 4-hour chart, the move from 0.8066 is the wave 5 with i: 0.8860, ii: 0.8315, wave iii is an extended move ended at 1.0183, iv: 0.9706 and wave v has ended at 1.1081 (also the top of entire wave 5). The subsequent selloff is the major correction which is unfolding as ABC-X-ABC and 2nd A leg has ended at 0.8848, followed by a-b-c wave B which ended at 0.9758, hence, 2nd C wave is now in progress and indicated downside target at 0.7000 and 0.6950 had been met, so further fall to 0.6710-20 cannot be ruled out.

GBPJPY Looking Neutral, Remains Above 50- And 200-day Moving Averages
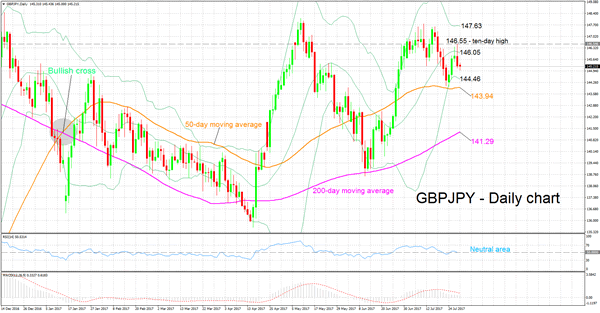
GBPJPY reached a ten-day high of 146.55 in yesterday's trading before declining to finish the day 0.4% lower.
In terms of technical indicators, the RSI is currently moving along the 50 neutral-perceived level, hinting to a lack in upside or downside momentum in the very short term. The MACD is giving a mixed picture as it is positive but below the red signal line. This perhaps suggests that the overall bias is neutral as well.
If the price falls, the area around the lower Bollinger band at 144.46 could act a support. Further declines would shift the focus to the region around the current level of the 50-day moving average (MA) at 143.94 for additional support.
On the other hand, if the price rises, resistance could be met around the middle Bollinger line, which is a 20-day MA line, at 146.05. A break above would turn the attention to the region around yesterday's high of 146.55 for additional resistance.
Concluding with the medium-term picture, it looks mostly bullish given the overall uptrend since the start of the year and price action taking place above both the 50- and 200-day MAs since late June (the pair also recorded a bullish cross at the start of the year when the 50-day MA moved above the 200-day one). A fall below the 50-day MA though would set a more neutral tone.
EUR/GBP Setting Up For Further Gains
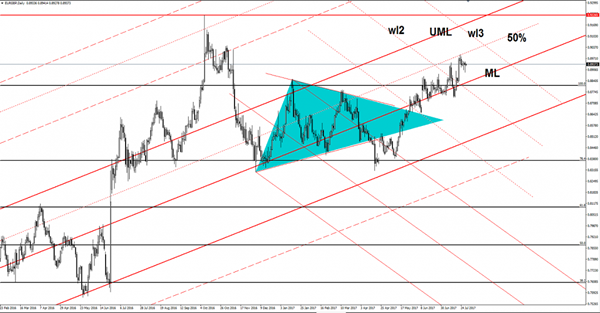
Has changed little today, but looks like is trying to resume the upside movement after the minor decrease, personally I would like if will come down to retest the median line (ML) before will jump much higher. We’ll have a great buying opportunity if we’ll have a retest of the ML.
EUR/CHF Reached New Peaks
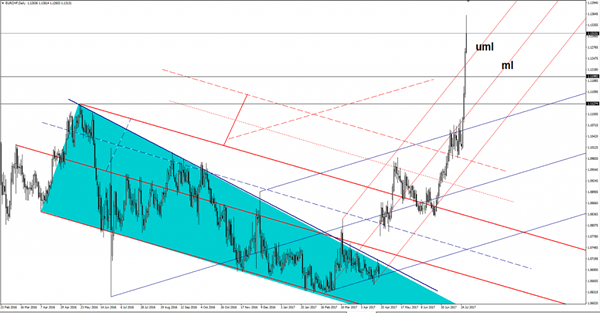
EUR/CHF rallied and has extended the latest gains, climbed as much as 1.1361, much above the 1.1274 yesterday’s high. You can see that has retreated a little in the last hours after the amazing jump, we could see a minor consolidation in the upcoming days above the upper median line (uml) of the ascending pitchfork.
USD/JPY On The Way Down
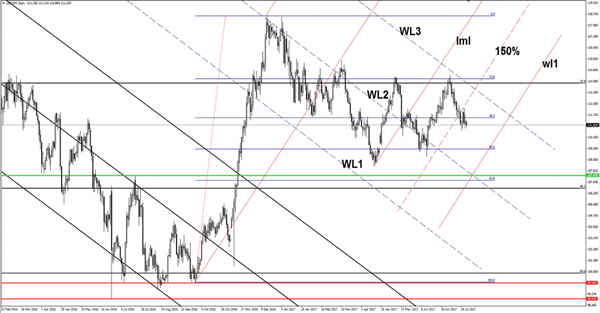
USD/JPY is trading in the red and should approach and reach fresh new lows in the upcoming days because is located in the seller's territory. Is moving sideways on the daily chart and, but I hope that we'll have a clear direction very soon because the Nikkei stock index looks ready to make a significant move on the Daily chart.
The Yen increased in the morning also because has received a helping had from the economic figures, the Unemployment Rate decreased from 3.1% to 2.8% in June, more versus the 3.0% estimate, while the Tokyo Core CPI increased by 0.2% in July, beating the 0.1% estimate, the Househld Spending increased by 2.3% in June, exceeding the 0.6% estimate. Moreover the National Core CPI surged by 0.4%, matching expectations.
Price is trapped between the 50% and the 23.6% retracement levels, is located below the 38.2% retracement level, signalling that could decrease further. You can see that has failed to stay above the 38.2% retracement level and now should move towards the 50% retracement level, actually could be attracted by the confluence area formed at the intersection between the 50% level and the first warning line (wl1) of the ascending pitchfork.
The current corrective phase is natural after the false breakout above the 23.6% and after the failure to reach the third warning line (WL3).
The Yen could dominate the currency market as the Nikkei stock index failed once again to close above the 20058 static resistance, we false breakout in the yesterday's session that could send the index towards the 19700 level. A valid breakdown below the 19700 major static obstacle will open the door for more declines. I've told you in the last weeks that the JP225 looks exhausted on the Daily chart, but we needed a confirmation that will drop again.
EUR/JPY Candlesticks and Ichimoku Analysis
Weekly
• Last Candlesticks pattern: Window
• Time of formation: 24 April 2017
• Trend bias: Up
Daily
• Last Candlesticks pattern: Hammer
• Time of formation: 18 May 2017
• Trend bias: Up
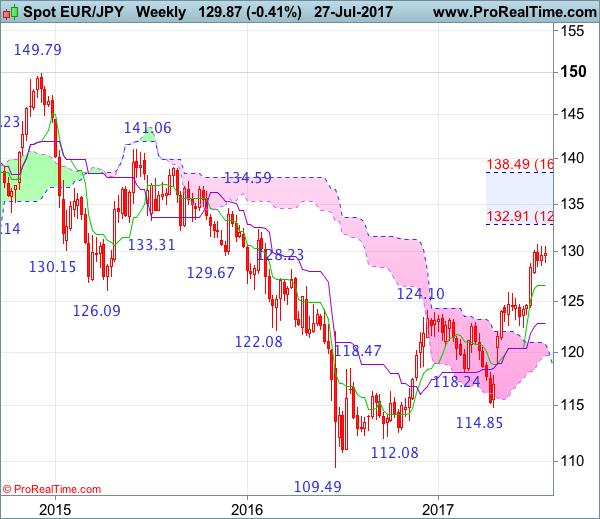
EUR/JPY – 130.31
As the single currency has maintained a firm undertone after recent rally to 130.77, adding credence to our bullish view that medium term rise from 109.49 low is still in progress, hence upside bias remains for this move to extend further gain to 131.50-60, then 132.00-10, however, loss of near term upward momentum should prevent sharp move beyond previous resistance at 132.33 and reckon 133.00-10 would hold from here, risk from there has increased for a correction to take place later.
On the downside, whilst initial pullback to the Tenkan-Sen (now at 129.59) cannot be ruled out, reckon downside would be limited to 128.90-00 and bring another rise later. A drop below support at 128.49 would defer and suggest a temporary top is possibly formed, bring test of 128.00, break there would add credence to this view, then retracement of recent upmove would take place for test of previous support at 127.44 and then test of the Kijun-Sen (now at 127.31) which is likely to hold of first testing, bring rebound later.
Recommendation: Buy at 128.90 for 131.50 with stop below 127.90.
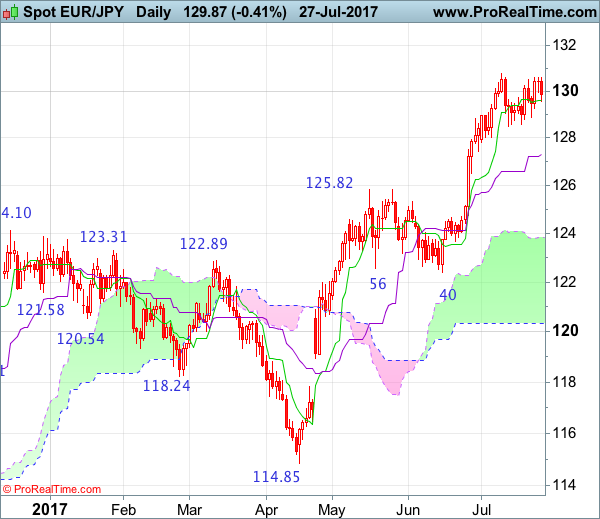
On the weekly chart, as the single currency has continued trading with a firm bias after resuming recent major upmove from 109.49 low, reinforcing our bullish view for this medium term rise to extend further gain to 131.00, then 131.50-60, however, overbought condition should limit upside to previous chart resistance at 132.33 and reckon 133.00-10 would hold from here, risk from there is seen for a retreat to take place later.
On the downside, although initial pullback to 129.50-60, then 128.90-00 cannot be ruled out, reckon 128.50-60 would limit downside and euro shall head north again from there to aforesaid upside targets. A drop below support at 127.81 would defer and risk test of the Tenkan-Sen (now at 126.59) but a weekly close below there is needed to signal a temporary top is formed, bring retracement of recent upmove to previous resistance at 125.82 (now support) but downside should be limited to 125.00 and reckon 124.00-10 would remain intact.
USD/CAD Candlesticks and Ichimoku Analysis
Weekly
• Last Candlesticks pattern: Shooting doji
• Time of formation: 01 May 2017
• Trend bias: Sideway
Daily
• Last Candlesticks pattern: Bearish engulfing
• Time of formation: 5 May 2017
• Trend bias: Down
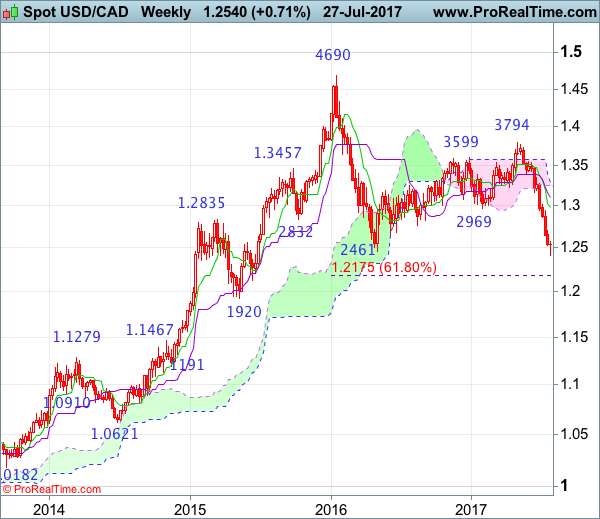
USD/CAD – 1.2540
As the greenback has remained under pressure after recent selloff below indicated previous support at 1.2969, adding credence to our bearish view that early erratic rise from 1.2461 has ended at 1.3794 earlier and the breach of said support at 1.2461 confirms another leg of major fall from 1.4690 is underway, hence bearishness remains for further weakness to 1.2400, then 1.2350-60, however, oversold condition should limit downside to 1.2300 and price should stay well above 1.2240-50, risk from there has increased for a rebound to take place later.
On the upside, whilst initial recovery to the Tenkan-Sen (now at 1.2558) cannot be ruled out, reckon upside would be limited to 1.2690-00 and bring another decline later. Above 1.2730-40 would defer and risk a stronger rebound to 1.2790-00 but reckon the Kijun-Sen (now at 1.2876) would hold from here and bring another selloff later. Only a daily close above the Kijun-Sen would abort and suggest a temporary low is formed instead, risk a stronger rebound to 1.2940-45 but price should falter below resistance at 1.3015.
Recommendation: Sell at 1.2690 for 1.2400 with stop above 1.2790.

On the weekly chart, as recent selloff has kept price under pressure and price finally broke below indicated previous support at 1.2461 (2016 low), adding credence to our view that the major fall from 1.4690 top has resumed, hence bearishness remains for this move to extend weakness to 1.2400, then towards 1.2300-10 but near term oversold condition should prevent sharp fall below 1.2240-50 and price should stay above 1.2175 (61.8% Fibonacci retracement of 1.0621-1.4690), risk from there has increased for a rebound later.
On the upside, although initial recovery to 1.2590-00 cannot be ruled out, reckon upside would be limited to 1.2690-00 and bring another decline later. Above 1.2790-00 would defer and bring a stronger rebound to 1.2850 but resistance at 1.2944 should hold from here. Only a weekly close above the Tenkan-Sen (now at 1.2981) would suggest a temporary low is formed, bring retracement of recent decline to 1.3015 resistance but price should falter below the Kijun-Sen (now at 1.3104) and bring another selloff in late Q3.