Sample Category Title
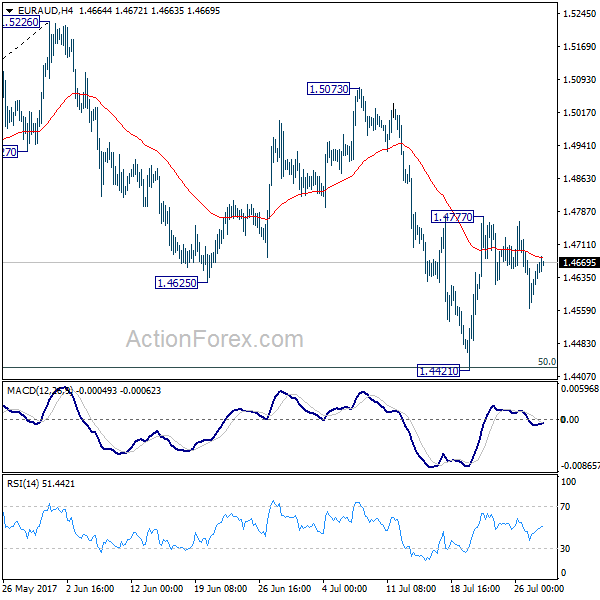
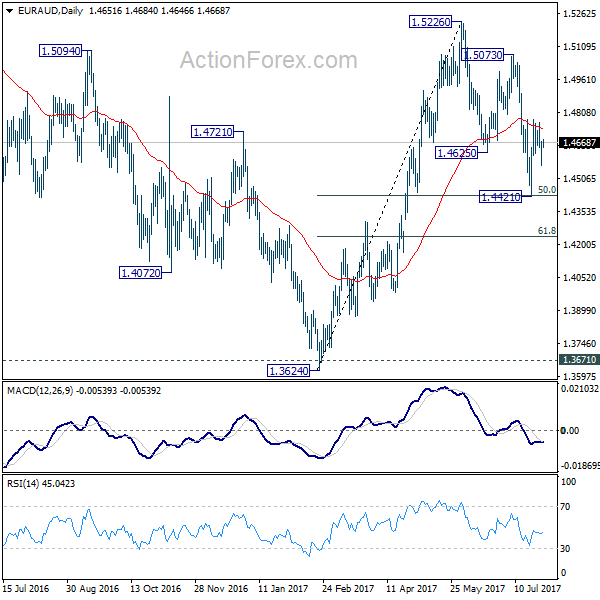
EUR/AUD Daily Outlook
Daily Pivots: (S1) 1.4588; (P) 1.4630; (R1) 1.4696; More...
Intraday bias in EUR/AUD remains neutral as it's bounded in range of 1.4421/4777. At this point, we're still favoring the case that correction from 1.5226 could have completed with three waves down to 1.4421 already. Therefore, another rally is expected in the cross. Break of 1.4777 will turn bias to the upside for 1.5073 resistance first. Break there will indicate resumption of whole rise from 1.3624. However, break of 1.4221 will invalidate our view and extend the decline from 1.5226 to 61.8% retracement of 1.3624 to 1.5226 at 1.4236.
In the bigger picture, we're holding on to the view that corrective decline from 1.6587 medium term has completed at 1.3624. Rise from 1.3624 is expected to resume to retest 1.6587. The corrective structure of the fall from 1.5226 is affirming this view. Above 1.5226 will target a test on 1.6587 key resistance. However, further downside acceleration will dampen our view and would drag EUR/AUD lower to retest key support zone around 1.3624.
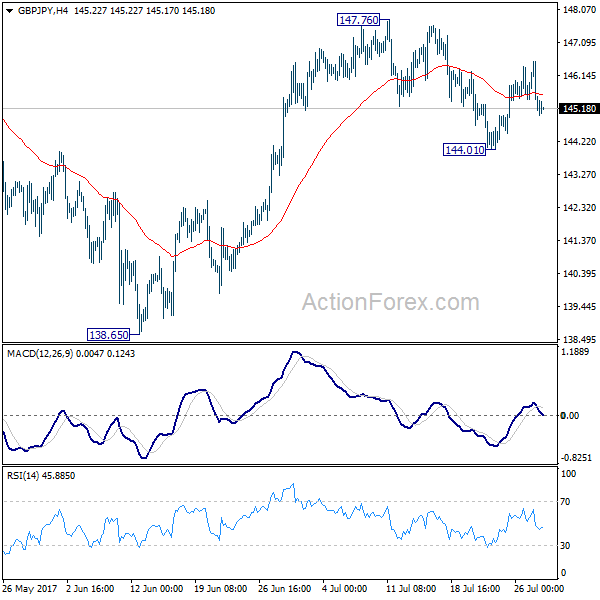
GBP/JPY Daily Outlook
Daily Pivots: (S1) 144.80; (P) 145.68; (R1) 146.24; More
GBP/JPY's recovery from 144.01 quickly lost momentum and intraday bias is turned neutral again. On the upside, break of 147.76/148.42 key resistance zone will resume larger rebound from 122.36. On the downside, break of 144.01 will extend the sideway pattern from 148.20 with another fall back to 135.58/65 support zone.
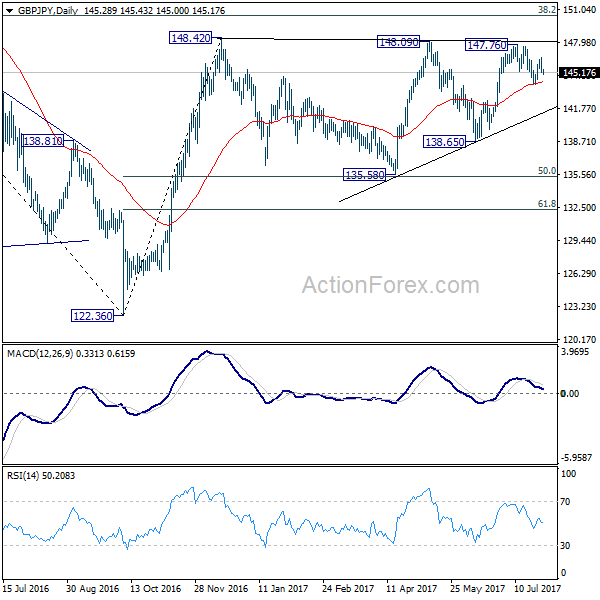
In the bigger picture, rise from medium term bottom at 122.36 is expected to continue to 38.2% retracement of 196.85 to 122.36 at 150.43. Decisive break there will carry long term bullish implications and pave the way to 61.8% retracement at 167.78. In case the sideway pattern from 148.42 extends, we'd be looking for strong support from 135.58 and 50% retracement of 122.36 to 148.42 at 135.39 to contain downside.
Daily Technical Outlook And Review: EUR/USD, GBP/USD, AUD/USD, USD/JPY, USD/CAD, USD/CHF, DOW 30, GOLD
A note on lower timeframe confirming price action...
Waiting for lower timeframe confirmation is our main tool to confirm strength within higher timeframe zones, and has really been the key to our trading success. It takes a little time to understand the subtle nuances, however, as each trade is never the same, but once you master the rhythm so to speak, you will be saved from countless unnecessary losing trades. The following is a list of what we look for:
- A break/retest of supply or demand dependent on which way you're trading.
- A trendline break/retest.
- Buying/selling tails ... essentially we look for a cluster of very obvious spikes off of lower timeframe support and resistance levels within the higher timeframe zone.
- Candlestick patterns. We tend to only stick with pin bars and engulfing bars as these have proven to be the most effective.
We typically search for lower-timeframe confirmation between the M15 and H1 timeframes, since most of our higher-timeframe areas begin with the H4. Stops are usually placed 1-3 pips beyond confirming structures.
EUR/USD
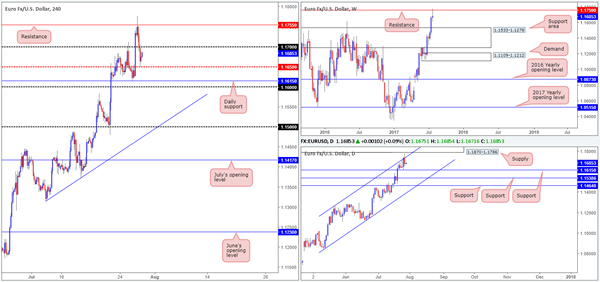
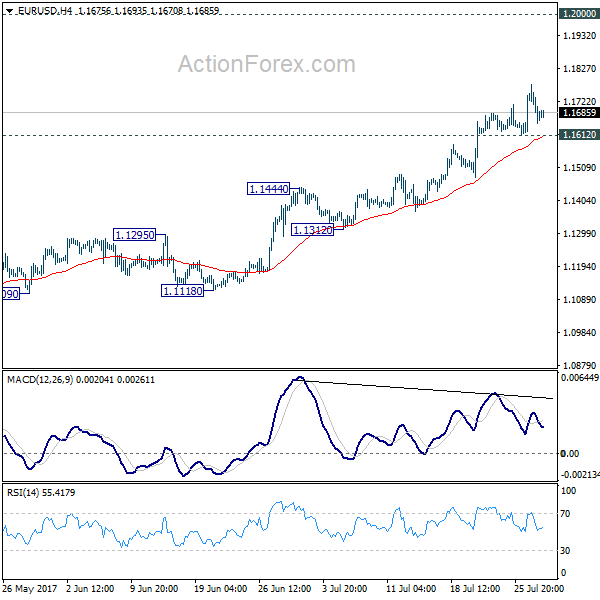
During the course of yesterday's segment, the EUR/USD underwent a rather aggressive downside correction from a H4 resistance level seen at 1.1755. Likely influenced by the daily channel resistance line extended from the high 1.1263 and a weekly resistance level seen at 1.1759 (we missed this weekly level yesterday), the single currency managed to run through the 1.17 handle and cross swords with the H4 mid-level barrier at 1.1650 going into the closing bell.
According to weekly structure, price could stretch down as low as the support area seen at 1.1533-1.1278. On the daily timeframe, nonetheless, the next downside target is seen a little closer at 1.1615 (a support level). Therefore, a H4 close beyond 1.1650 is not necessarily an indication to short!
Our suggestions: As price is nearing a daily support right now, our team is reluctant to sell this market. By the same token, buying the pair would also be a risky move, in our opinion, given where both the weekly and daily candles are trading from at the moment (see above). On that note, remaining flat may very well be the better path to take today.
Data points to consider: US Advance GDP figures q/q at 1.30pm, FOMC member Kashkari speaks at 6.20pm GMT+1.
Levels to watch/live orders:
- Buys: Flat (stop loss: N/A).
- Sells: Flat (stop loss: N/A).
GBP/USD
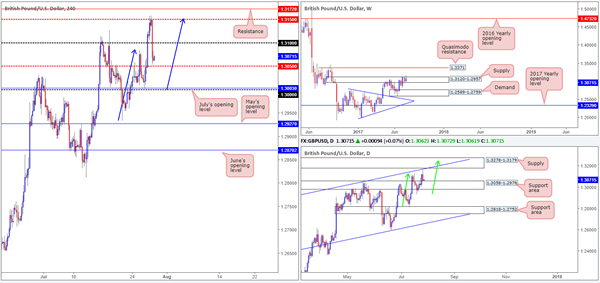
Strong sellers came into the market yesterday after price shook hands with a H4 mid-level resistance at 1.3150. The approach to this barrier, as we highlighted in Thursday's report, was a nice-looking H4 AB=CD bearish formation which terminated at exactly 1.3150 (see blue arrows). We did not take this trade as we were looking for price to connect with the daily supply seen above this line at 1.3278-1.3179 (converges with a daily channel resistance line drawn from the high1.2774).
Moving forward, we can see that weekly price is currently trading back within the walls of supply at 1.3120-1.2957, and daily action is now seen challenging the top edge of a support area coming in at 1.3058-1.2979. Over on the H4 chart, the pair is hovering above the mid-level number 1.3050.
Our suggestions: At current prices, similar to the EUR/USD, we have conflicting signals in this market. A buy would place one against potential weekly sellers, whereas a sell would have you shorting into a daily support area.
We would, nonetheless, still be interested in selling from the daily supply base mentioned above at 1.3278-1.3179, given the potential AB=CD bearish pattern (green arrows) that completes within the supply, and the aforesaid converging daily channel resistance line.
Data points to consider: US Advance GDP figures q/q at 1.30pm, FOMC member Kashkari speaks at 6.20pm GMT+1.
Levels to watch/live orders:
- Buys: Flat (stop loss: N/A).
- Sells: 1.3278-1.3179 ([waiting for a H4 bear candle to form – preferably a full, or near-full-bodied candle – before pulling the trigger is advised] stop loss: ideally beyond the candle's wick).
AUD/USD
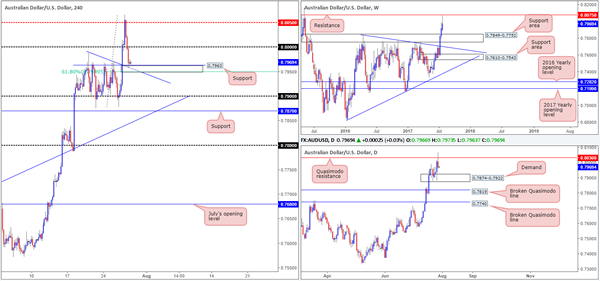
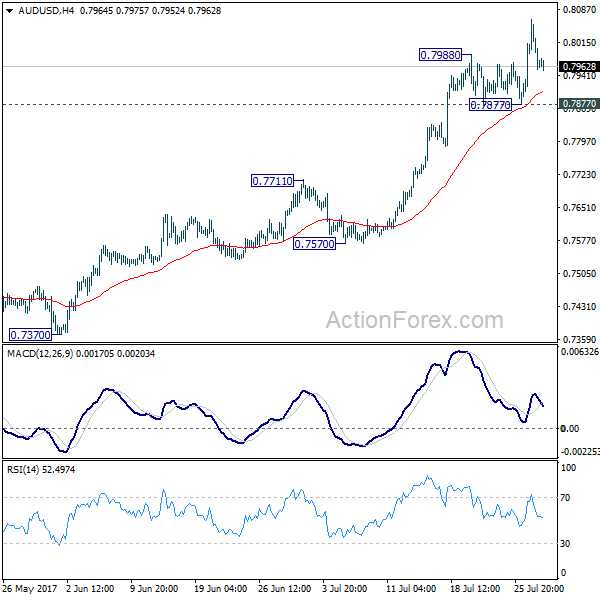
Coming in from the top this morning, the weekly timeframe shows that price came within ten pips of connecting with a major resistance line at 0.8075 yesterday, before selling off. Assuming that the bears remain in a dominant position here, this could lead to price trading as far down as the support area seen at 0.7849-0.7752. Turning our attention to the daily candles, the Quasimodo resistance at 0.8030 has managed to hold firm which could force the unit down to demand at 0.7874-0.7922.
Sliding across to the H4 timeframe, price is now seen challenging a support at 0.7963, after driving through the nearby psychological band at 0.80. As you can see, this support also fuses nicely with a trendline support taken from the high 0.7987, a nearby mid-level support at 0.7950 and also a 61.8% Fib support at 0.7950 drawn from the low 0.7877.
Our suggestions: While H4 price is seen holding steady above 0.7963 right now, both the weekly and daily charts suggest further selling may be on the cards. In view of this, despite the surrounding H4 confluence, we are reluctant to buy this market at this time.
With longs out of the question, what about shorts? Well, a close below the 0.9550 neighborhood would likely open the trapdoor down to the 0.79 handle. However, seeing as how the top edge of the current daily demand is sited at 0.7922, there's a good chance 0.79 may not be challenged!
Data points to consider: US Advance GDP figures q/q at 1.30pm, FOMC member Kashkari speaks at 6.20pm GMT+1.
Levels to watch/live orders:
- Buys: Flat (stop loss: N/A).
- Sells: Flat (stop loss: N/A).
USD/JPY
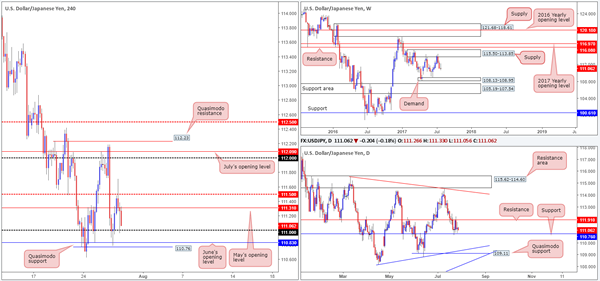
For those who read Thursday's report, you may recall that our team placed a pending buy order at 110.77. As you can see, the order came within a pip of being filled before the market turned in our desired direction! Well done to any of our readers who managed to get on board with this one.
Despite yesterday's movement, there's been little change in the overall structure of this market, hence the daily indecision candle recently printed. Weekly price continues to range between supply at 115.50-113.85 and demand at 108.13-108.95. In addition to this, daily flow is also still seen sandwiched between support coming in at 110.76 and resistance at 111.91.
Our suggestions: Personally, there is very little that interests us at the moment. Stop-loss orders have likely all been squeezed below 111 and the buy orders from the H4 Quasimodo support at 110.76/June's opening level at 110.83 have also likely been consumed. Why not sell then? Good question! The simple reason we are not willing sellers here is due to the daily support at 110.76! Given its history, it is very difficult to judge whether this level is on the verge of giving way or not. It is just not worth the risk, in our humble opinion.
Data points to consider: US Advance GDP figures q/q at 1.30pm, FOMC member Kashkari speaks at 6.20pm GMT+1
Levels to watch/live orders:
- Buys: Flat (stop loss: N/A).
- Sells: Flat (stop loss: N/A).
USD/CAD
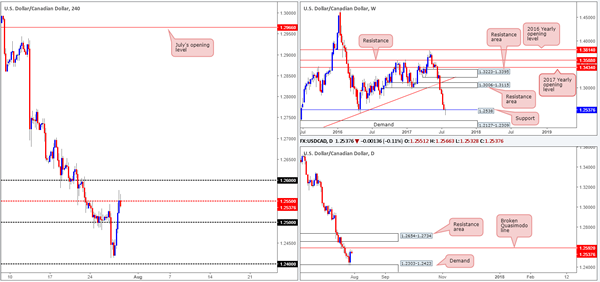
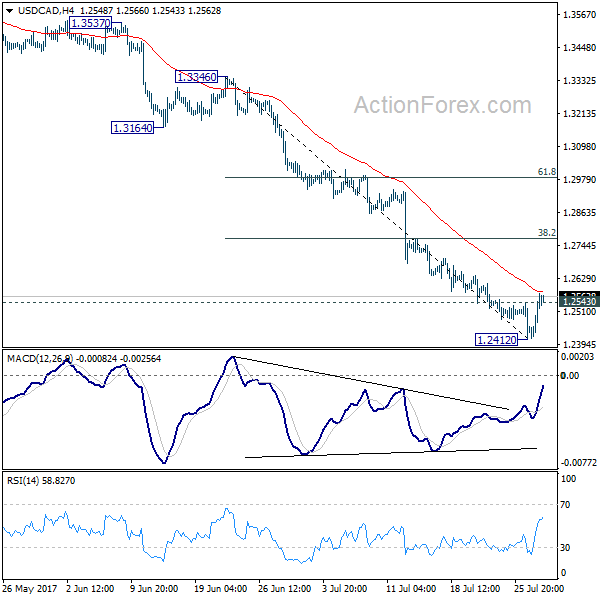
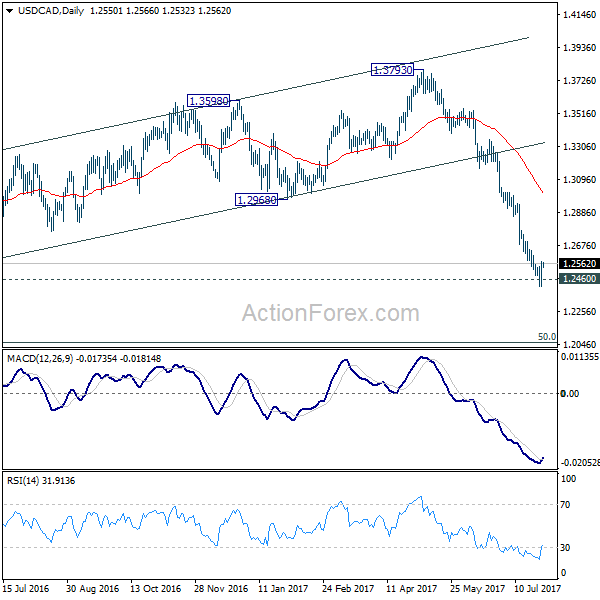
In recent trading, we've seen the current weekly candle begin to chalk in a fairly substantial buying tail. Should this market remain bid today and end the week closing back above the nearby weekly support level at 1.2538, this may suggest that the bulls could be attempting to make a play here. As you can see from the daily chart, the recent advance was helped by demand pegged at 1.2303-1.2423, which has consequently now placed the pair within striking distance of a broken Quasimodo line coming in at 1.2592.
Thursday's advance saw H4 action run through offers at the 1.25 handle and connect with the mid-level resistance at 1.2550 going into the closing bell. Until 1.2550 is consumed, it'll be difficult for the unit to attack the aforesaid daily broken Quasimodo line.
Our suggestions: This pair has been entrenched within a substantial downtrend for almost two months now. As such, yesterday's bounce to the upside may only be just that: a bounce! Even if the weekly candle closes back above the weekly support level this week, we would need to see both the current daily broken Quasimodo line as well as the daily resistance area at 1.2654-1.2734 taken out, before we become willing buyers.
We feel that the daily broken Quasimodo line at 1.2592, coupled with the nearby 1.26 handle, will likely hold this market lower today, therefore a trade from here is an option. Waiting for additional confirmation, however, is strongly advised, since if weekly buyers do kick into action from the current weekly support, being on the wrong side of this move would be a rather painful experience!
Data points to consider: US Advance GDP figures q/q at 1.30pm, FOMC member Kashkari speaks at 6.20pm. Canadian growth data at 1.30pm GMT+1.
Levels to watch/live orders:
- Buys: Flat (Stop loss: N/A).
- Sells: 1.26 region ([waiting for a H4 bear candle to form – preferably a full, or near-full-bodied candle – before pulling the trigger is advised] stop loss: ideally beyond the candle's wick).
USD/CHF
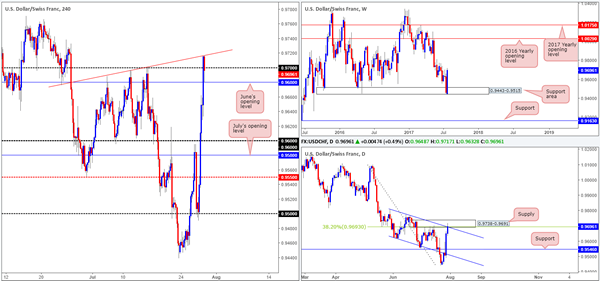
A stronger-than-expected bounce has been seen from the weekly support area at 0.9443-0.9515, consequently forcing daily action to challenge supply at 0.9738-0.9691. This area also happens to converge with a daily channel resistance extended from the high 0.9808 and a daily 38.2% Fib resistance at 0.9693 taken from the high 1.0099.
Although weekly price looks bull strong at the moment, the confluence surrounding the daily supply zone, coupled with H4 price reacting so well off of a minor trendline resistance extended from the low 0.9675 seen positioned just above 0.97, strongly suggests that sellers may make an appearance.
Our suggestions: We have entered short at 0.9694 and placed the stop above the current daily supply at 0.9740, with an overall target objective set at 0.9546: a daily support level. Should the trade come to fruition, this will net over three times our initial risk.
Data points to consider: US Advance GDP figures q/q at 1.30pm, FOMC member Kashkari speaks at 6.20pm GMT+1.
Levels to watch/live orders:
- Buys: Flat (stop loss: N/A).
- Sells: 0.9694 ([live] stop loss: 0.9740).
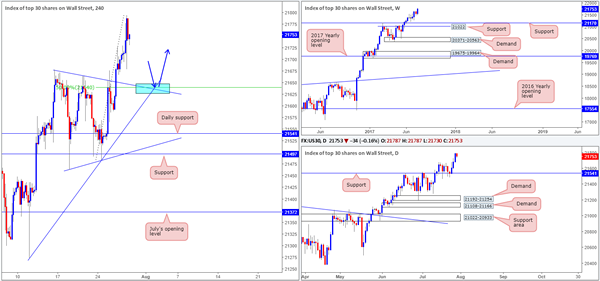
DOW 30
US equities recorded a third consecutive bull candle on Thursday, reaching an all-time high of 21778 on the day. With both the weekly and daily charts showing room for further buying, we are watching for H4 price to pullback and test the 50.0% support value at 21640 extended from the low 21484 for a possible long trade. The reason we like this level is due to it converging closely with two trendline supports – one taken from the low 21273 and the other taken from a high at 21677 (blue area).
Our suggestions: While we expect a bounce to be seen from the aforesaid blue zone, we would not feel comfortable placing pending orders here, since the area is small and therefore susceptible to a fakeout. With that in mind, waiting for a H4 bull candle to form (preferably a full-bodied candle) would be ideal since this would show buyer intent.
Data points to consider: US Advance GDP figures q/q at 1.30pm, FOMC member Kashkari speaks at 6.20pm GMT+1.
Levels to watch/live orders:
- Buys: Watch for H4 price to retest 21640 ([waiting for a full, or near-full-bodied H4 bull candle to form following the retest is advised] stop loss: ideally beyond the candle's tail).
- Sells: Flat (stop loss: N/A).
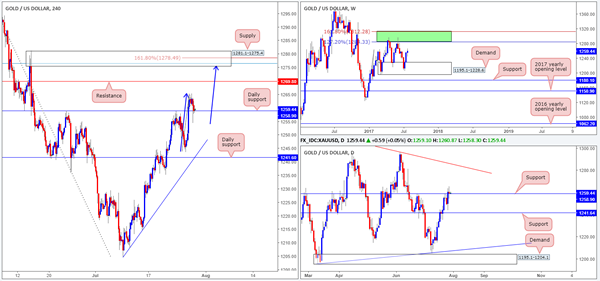
GOLD
In recent trading, the yellow metal topped at a high of 1265.2 and retested daily support at 1258.9, which for the time being is holding firm. Should this level remain in play, the next area of interest on the H4 chart can be seen at 1269.8 (resistance), followed closely by supply at 1281.1-1275.4.
With daily price remaining afloat above support and weekly flow showing room to extend north as far as the area comprised of two Fibonacci extensions 161.8/127.2% at 1312.2/1284.3 taken from the low 1188.1 (green zone), we would not really feel comfortable selling at the H4 resistance mentioned above at 1269.8. The H4 supply above on the other hand, is interesting. Although it equally boasts little higher-timeframe structure, it does have potential for a bounce. Encased within the area is a H4 AB=CD (blue arrows) 161.8% Fib ext. at 1278.4 drawn from the low 1243.6, and a H4 78.6% Fib resistance at 1276.5 taken from the high 1296.0.
Our suggestions: Despite the confluence, we would strongly recommend waiting for additional candle confirmation to form from the current H4 supply, before pulling the trigger, as we are effectively trading against higher-timeframe flow here.
Levels to watch/live orders:
- Buys: Flat (stop loss: N/A).
- Sells: 1281.1-1275.4 ([waiting for a full, or near-full-bodied H4 bear candle to form is advised] stop loss: ideally beyond the candle's wick).
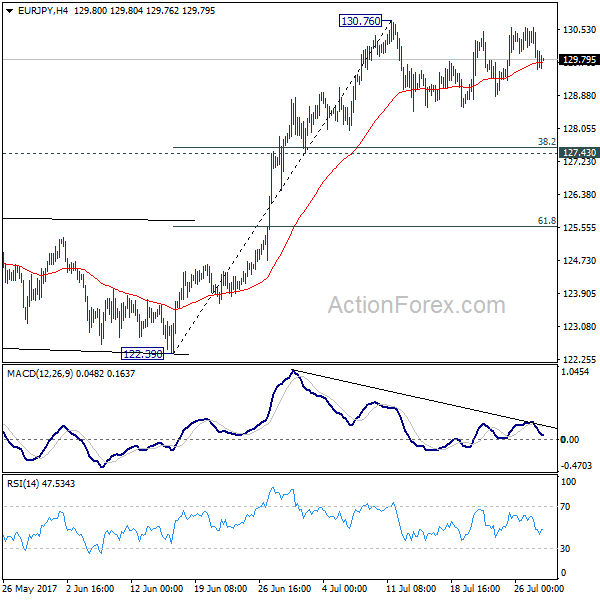
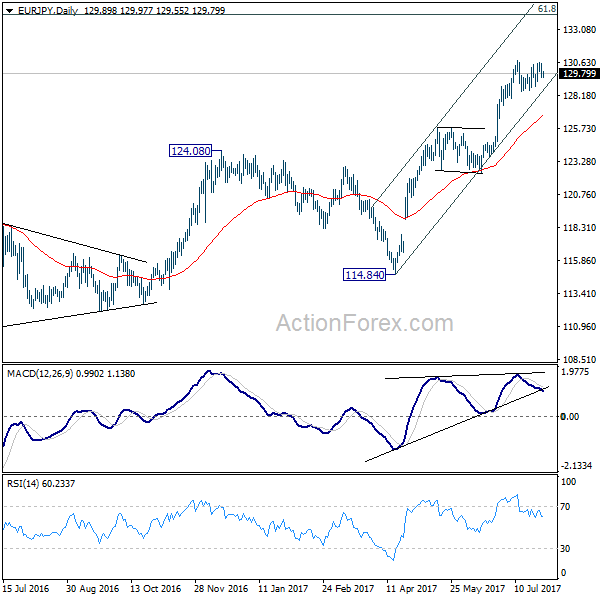
EUR/JPY Daily Outlook
Daily Pivots: (S1) 129.44; (P) 130.01; (R1) 130.48; More...
No change in EUR/JPY;s outlook as consolidation from 130.76 is still unfolding. Another fall could be seen but downside should be contained by 127.43 cluster support (38.2% retracement of 122.39 to 130.76 at 127.56) and bring rebound. Above 130.76 will extend the larger rally to next key fibonacci level at 134.20.
In the bigger picture, the down trend from 149.76 (2014 high) is completed at 109.03 (2016 low). Current rally from 109.03 should be at the same degree as the fall from 149.76 to 109.03. Further rise is expected to 61.8% retracement of 149.76 to 109.03 at 134.20. Sustained break there will pave the way to key long term resistance zone at 141.04/149.76. Medium term outlook will remain bullish as long as 124.08 resistance turned support holds.
NZDUSD 4-Hour Breakout Could Be In Play
Key Points:
- Price action trapped within a 4-hour range.
- RSI Oscillator is declining within neutral territory.
- Watch for a breakout in the coming session.
The New Zealand Dollar has been roaring lately as the pair has reacted strongly to the diminished sentiment for the greenback. Subsequently, the pair has risen from a low around the 0.72 handle to form a new high around the 0.7549 mark. This is not an inconsequential rally but the air might finally be evaporating from the bullishness as price action pulls back sharply in response to renewed interest in the greenback. So the Kiwi's future remains uncertain as the pair now prepares for a 4-hour range breakout.
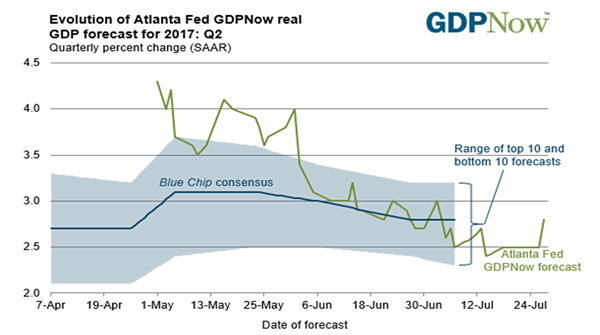
In particular, a cursory review of the 4-hour chart highlights the pair's current conundrum with price action having declined overnight following the upgrading of the U.S. Fed's Atlanta GDPNow estimate to 2.8%. This subsequently had a bullish impact on the greenback and has seen a significant sentiment swing in play. Subsequently, price action appears to have now formed some intra-day support around the 0.7480 mark and looks to be setting up for a breakout of the current range. In addition, the RSI Oscillator has also started to trend in a bearish direction which has helped to relieve the pressure and the indicator is now trading within neutral territory.
In addition, the RSI Oscillator has also started to trend in a bearish direction which has helped to relieve the pressure and the indicator is now trading within neutral territory.
Subsequently, there is something brewing for the pair and the present sideways direction could lead to a breakout/down of the range in the coming days. In fact, there are two potential scenarios for the pair with a breakdown likely to see price action declining back towards support at 0.7419. In the alternative scenario, price action could gather steam in a sideways fashion and then break sharply towards resistance at the 0.7558 mark.
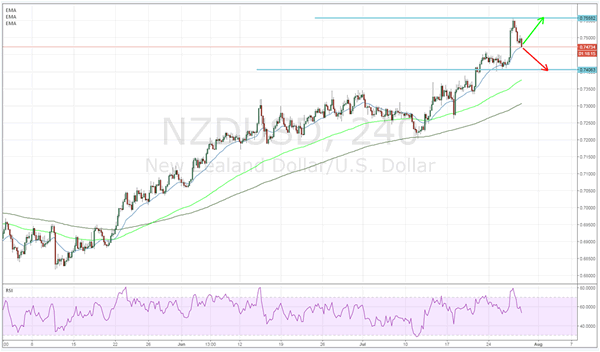
Either of these scenarios is equally likely given that price action is presently resting right at the centre of the range. However, my personal view is that the risks are currently slanted to the downside given the meteoric rise that the Kiwi Dollar has experienced of late. Subsequently, in my view, the most probable move is a downside push towards support at 0.7418. To put it bluntly, the greenback is not going to stay depressed for long and the economic divide between New Zealand and the U.S. is far too wide for the current valuation to remain. So keep a close watch on the pair because when it finally breaks, it's likely to be relatively quick indeed.
Market Morning Briefing: Better Than Expected US Durable Goods Orders Data
STOCKS
Dow (21796.55, +0.39%) is firmly bullish and could continue to move up in the near term. Looking at the current momentum, the index could rally towards 22000 sooner than expected. Near term uptrend remains intact.
Dax (12212.04, -0.76%) came off from levels near 12340 instead of rising towards 12400. Note that immediate support is visible near 12050 on the weekly charts and while that holds, there is some hope of a bounce back towards 12500-12750 in the medium term. Only on a break below 12000, if seen, would we look for any further downside.
Shanghai (3252.66, +0.09%) recovered the fall to 3220 yesterday itself, closing at levels above 3240. There could be some sideways consolidation within 3220-3270 for a few sessions before it rises further towards 3280 or higher.
Nikkei (19995.37, -0.42%) is almost stable and is likely to consolidate within 19700-20280 in the medium term. Only on a break on either side of the range would we get some more clarity on further direction.
Nifty (10020.55, -0.00%) made an intra-day high of 10115 before loosing all gains to close at previous levels. 10100-10115 is an interim resistance which if holds could produce a fall towards 9900 before again rising up towards current levels. Else the rally may continue towards 10200 in the near term. A corrective fall from current levels is more preferred just now.
COMMODITIES
Gold (1260) is trading within the range of 1245-70. It has a crucial Support at 1245. If that holds, we can see a rise towards 1270. As Gold is overbought in near term time frame, we are not confident about the sustainability beyond 1270 regions. But, in case the Support at 1245 breaks, there will be a further dip to 1230 and 1210. Silver (16.55) is also within the range of 16.50-16.17.Only a close below 16.50 could open up 16.20 and 15.90 respectively.
Copper (2.86) looks on a firm footing while it is trading above 2.78 levels. Midterm resistance comes at 3.12 regions from where we may see some correction due to profit taking.
Oil Price rose higher in line with our expectation. Both Brent (51.45) and WTI (48.99) are trading within the ranges of 48-52 and 47.60-49.50 respectively. We are bullish on oil since 10th of July onwards and there are no reason to change our bullish stance in near term while Brent and WTI are trading above 48 and 46 levels on a weekly closing basis. A weekly close above those resistance levels might confirm the end of the midterm bearish trend also.
Gold-WTI ratio (25.92) is hovering around its crucial support at 25.90. If this support breaks then it may come down towards 24 levels. Brent-WTI ratio (2.16) may find support at current levels, could rebound towards 3.00 within a couple of week time.
FOREX
Better than expected US durable goods orders data has helped Dollar Index (93.87) to stage a sharp intraday recovery after hitting a low of 93.15 following the Fed concern over inflation. Hence our target of 93.00 was missed by a very narrow margin but the chances of a retest of 93.00 or even a further decline to 92.00 remain open at this point.
Similarly, the initial target of 1.1800 was almost met as Euro (1.1686) registered a high at 1.1777 before retreating below 1.1700. The trend remains firmly up and the higher target of 1.20 remains open but the troubling issue remains the highly overstretched state of both Euro and Dollar.
Euro is in the most overbought condition since 2008 and Dollar in the most oversold condition since 2011, which warrants a consolidation phase at least if not an outright sharp correction. So follow the trend without underestimating the possibility of a sharp reversal in the next few sessions.
Dollar-Yen (111.05) is trading closer to the lower end of the 6-day range of 110.50-112.15. if the support of 110.50-30 holds, it may bounce back to 112.00-50 levels once again.
Pound (1.3083) retreated along with other majors after hitting a high at 1.3159, not far from the major resistance of 1.32. Failure to rise above 1.32 and a break of 1.30 may invite weakness in the near term.
Aussie (0.7967) is seeing a minor correction in sync with the other majors against Dollar but the trend remains firmly up and the targets of 0.8100-70 unchanged. Only a break below 0.7925 may signal a consolidation phase in the range of 0.7870-0.8050 for a few days to be followed by a fresh rise.
We will watch today's price action in Dollar Rupee (64.11) closely. A Close below 64.25, and certainly below 64.09, will accelerate the downtrend. A Close above 64.25 (less likely) could trigger a rise to 64.35-50.
INTEREST RATES
The US yields are rising again to re-test the long term resistances. As mentioned yesterday the yield s could remain stable in the coming sessions before we see another downleg. The 30Yr (2.91%) is targeting 3% while the 10YR (2.31%) and the 5Yr (1.85%) are targeting levels near 2.50% and 2% respectively.
The US-Japan 10Yr (2.24%) has bounced from immediate support and could now move up towards 2.31% in the near term.
The Japanese yields are trading at support levels sand could move up in the coming sessions. The 10YR (.08%) and the 5Yr (-0.06%) could target levels near 0.085% and -0.046% respectively. Near term looks bullish.
AUD/USD Daily Outlook
Daily Pivots: (S1) 0.7917; (P) 0.7965; (R1) 0.8053; More...
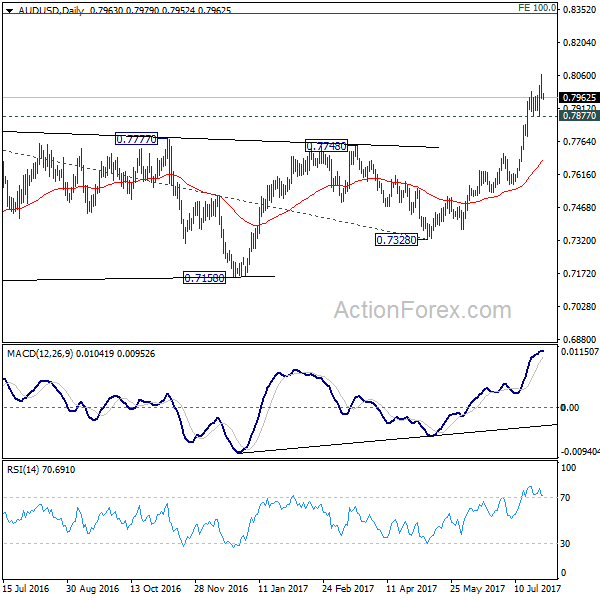
While AUD/USD loses some upside momentum, with 0.7877 support intact, further rise is still expected. Current rally from 0.7328 should target next key projection level at 100% projection of 0.6826 to 0.7833 from 0.7328 at 0.8335. Nonetheless, break of 0.7877 will indicate short term topping and bring deeper pull back to 0.7711 resistance turned support.
In the bigger picture, current development suggests that rebound from 0.6826 is developing into a medium term rise. There is no confirmation of trend reversal yet and we'll continue to treat such rebound as a corrective pattern. But in any case, further rise is now expected to 55 month EMA (now at 0.8100) or even further to 38.2% retracement of 1.1079 to 0.6826 at 0.8451. Break of 0.7328 support is needed to confirm completion of the rebound. Otherwise, further rise is now expected.
USD/CAD Daily Outlook
Daily Pivots: (S1) 1.2452; (P) 1.2513; (R1) 1.2614; More....
Break of 1.2543 minor resistance is seen as an indication of short term bottoming, on bullish convergence condition in 4 hour MACD, after drawing support from 1.2460 key level. Intraday bias is turned to the upside for 38.2% retracement of 1.3346 to 1.2412 at 1.2769 first. On the downside, through, sustained trading below 1.2460 will extend the whole decline from 1.3793 to next key fibonacci level at 1.2048.
In the bigger picture, price actions from 1.4689 medium term top are seen as a correction pattern. Fall from 1.3793 is seen as the third leg and should target 50% retracement of 0.9406 to 1.4869 at 1.2048. At this point, we'd look for strong support from there to contain downside and bring rebound. However, firm break there will target 100% projection of 1.4689 to 1.2460 from 1.3793 at 1.1564.
EUR/USD Daily Outlook
Daily Pivots: (S1) 1.1624; (P) 1.1700 (R1) 1.1751; More...
EUR/USD continues to lose upside momentum for the moment. But still, with 1.1612 minor support intact further rise is expected. Current medium term rally is expected to target 1.2 handle next. Nonetheless, considering bearish divergence condition in 4 hour MACD, break of 1.1612 will indicate short term topping and bring lengthier consolidation first.
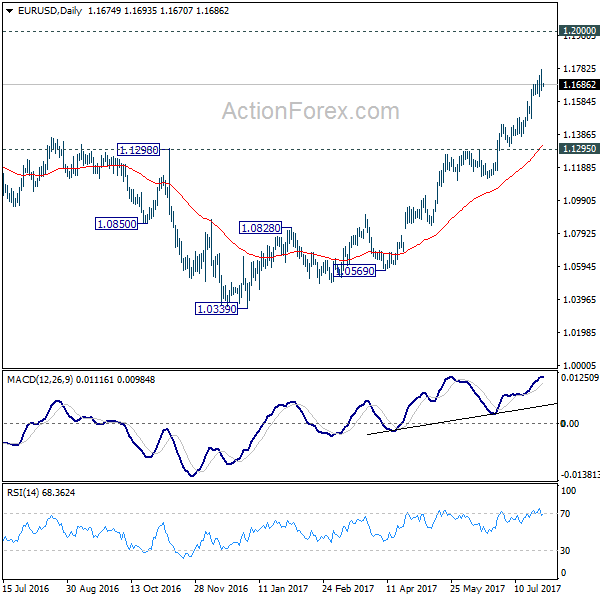
In the bigger picture, an important bottom was formed at 1.0339 on bullish convergence condition in weekly MACD. Sustained break of 55 month EMA (now at 1.1760) will pave the way to key fibonacci level at 38.2% retracement of 1.6039 (2008 high) to 1.0339 (2017 low) at 1.2516. While rise from 1.0339 is strong, there is no confirmation that it's developing into a long term up trend yet. Hence, we'll be cautious on strong resistance from 1.2516 to limit upside. But for now, medium term outlook will remain bullish as long as 1.1295 support holds, in case of pull back.
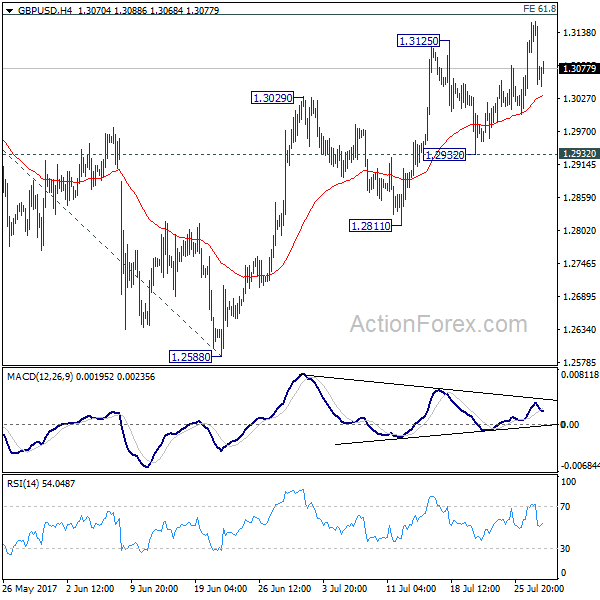
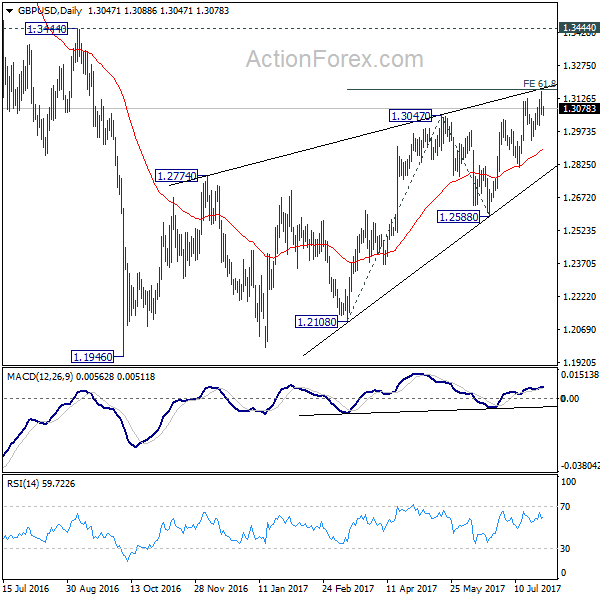
GBP/USD Daily Outlook
Daily Pivots: (S1) 1.3023; (P) 1.3091; (R1) 1.3131; More...
No change in GBP/USD's outlook. Price actions from 1.1946 is seen as a corrective pattern. Considering bearish divergence condition in 4 hour MACD, we'd stay cautious on strong resistance from 61.8% projection of 1.2108 to 1.3047 from 1.2588 at 1.3168 to limit upside. Break of 1.2932 support will be the first sign of reversal and will turn bias to the downside to target 1.2588 key support next. Though, sustained break of 1.3168 will bring further rise towards 1.3444 before completing the correction.
In the bigger picture, overall, price actions from 1.1946 medium term low are seen as a corrective pattern that is still in progress. While further upside is expected, overall outlook remains bearish as long as 1.3444 key resistance holds. Larger down trend from 1.7190 is expected to resume later after the correction completes. And break of 1.2588 will indicate that such down trend is resuming.