
Sample Category Title
Daily Technical Analysis: EUR/USD Retracement Within Bullish Channel After Hitting 1.1750 Target
Currency pair EUR/USD
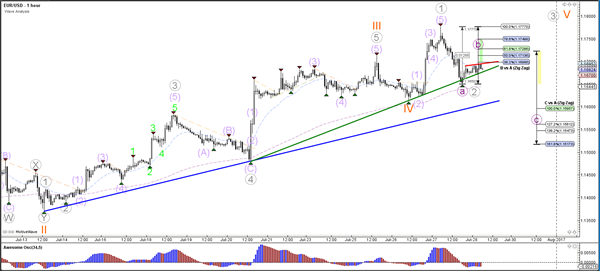
The EUR/USD turned near the quarter resistance level of 1.1750 and top of the bullish channel (red/blue), which could complete the wave 5 (orange). If price manages to break above the previous top, then a larger trend continuation within wave 5 (orange) is still possible towards 1.18, 1.1850, and 1.20.
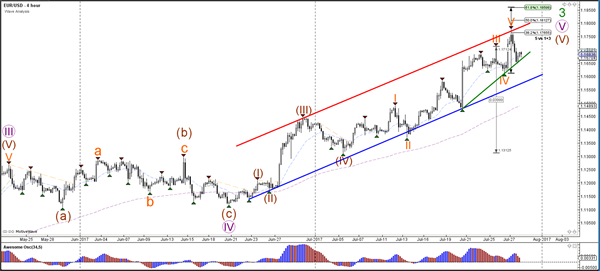
The EUR/USD could be building a larger correction via an ABC (purple) or price could have made a retracement back to support via a wave 1-2 (grey).
Currency pair USD/JPY
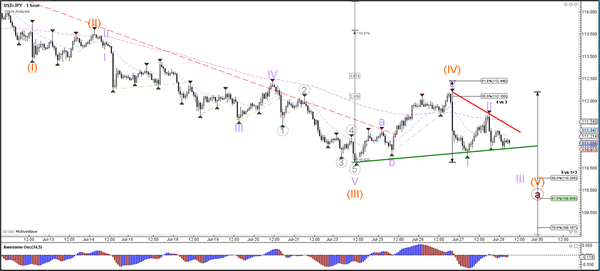
The USD/JPY bounced at the Fibonacci levels of wave 4 (orange) but price failed to break below the bottom (green line). A bearish breakout could price move towards the Fibonacci levels of wave 5 (orange).
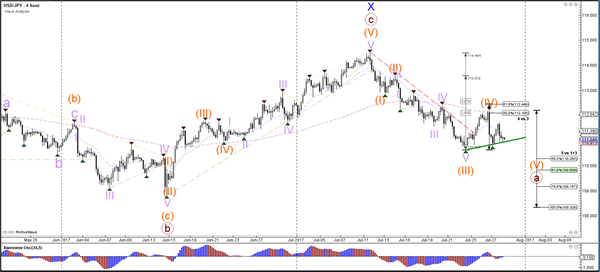
The USD/JPY break below the support trend line (green) makes a wave 3 (purple) more likely whereas a break above resistance (red) could indicate a truncated wave 5 (orange) which fails to break the bottom.
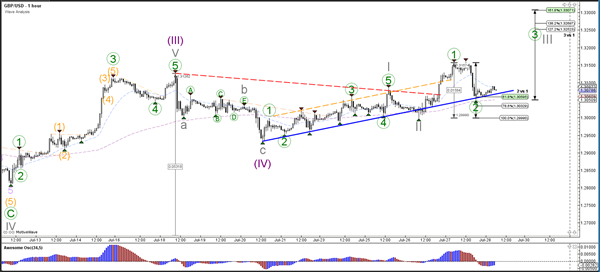
Currency pair GBP/USD
The GBP/USD broke above the resistance trend lines (dotted orange/red) and is now making a strong bearish pullback that is retesting the support trend line (blue) which is a major break or bounce spot.
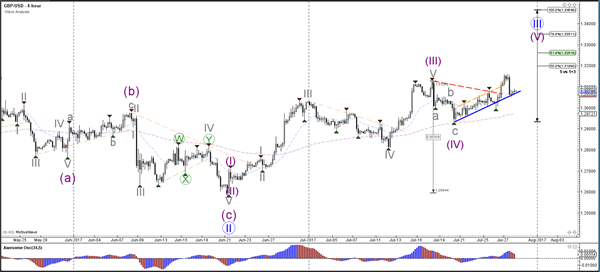
The GBP/USD could be in a deep retracement for a wave 2 (green). A break below the support (blue) and 1.30 round level would invalidate it.
Aussie Dollar Trading Marginally Higher In The Morning Session
For the 24 hours to 23:00 GMT, the AUD declined 0.3% against the USD and closed at 0.7972.
LME Copper prices rose 1.4% or $87.0/MT to $6325.0/MT. Aluminium prices rose x.x% or $xx.x/MT to $xxxx.x/MT.
In the Asian session, at GMT0300, the pair is trading at 0.7974, with the AUD trading a tad higher against the USD from yesterday’s close.
Early this morning, data showed that Australia’s producer price index (PPI) advanced 0.5% on a quarterly basis in the second quarter of 2017. The PPI had registered a similar rise in the prior quarter.
The pair is expected to find support at 0.7929, and a fall through could take it to the next support level of 0.7885. The pair is expected to find its first resistance at 0.8042, and a rise through could take it to the next resistance level of 0.8111.
Next week, market participants will focus on the Reserve Bank of Australia’s monetary policy decision.
The currency pair is trading below its 20 Hr moving average and showing convergence with its 50 Hr moving average.

German Consumer Morale Zoomed To A 16-Year High In August
For the 24 hours to 23:00 GMT, the EUR declined 0.39% against the USD and closed at 1.1683.
In economic news, Germany’s GfK consumer confidence index unexpectedly climbed to a level of 10.8 in August, escalating to a sixteen-year high level, as strong economic growth in the nation continued to brighten investor sentiment. Market participants had expected the index to remain steady at a level of 10.6.
The greenback gained ground against its key peers, after data indicated that the US preliminary durable goods orders jumped 6.5% in June, accelerating at its fastest pace in nearly 3 years, propelled by robust demand for civilian aircraft. Durable goods orders had registered a revised drop of 0.1% in the prior month, while markets were expecting it to gain 3.9%. Further, the nation’s advance goods trade deficit narrowed more-than-expected to a level of $63.9 billion in June, amid a rise in exports and a decline in imports. Investors had envisaged advance goods trade deficit to narrow to a level of $65.5 billion, following a revised deficit of $66.3 billion in the previous month. Additionally, the nation’s seasonally adjusted flash wholesale inventories rose more-than-anticipated by 0.6% in June, compared to a rise of 0.4% in the prior month.
In other economic news, the number of Americans filing for fresh jobless claims climbed to a level of 244.0K in the week ended 22 July 2017, surpassing market expectations for a rise to a level of 240.0K. In the preceding week, initial jobless claims had recorded a revised reading of 234.0K. Meanwhile, the Chicago Fed national activity index rose less-than-expected to a level of 0.13 in June, after recording a revised reading of -0.30 in the prior month.
In the Asian session, at GMT0300, the pair is trading at 1.1691, with the EUR trading 0.07% higher against the USD from yesterday’s close.
The pair is expected to find support at 1.1635, and a fall through could take it to the next support level of 1.1579. The pair is expected to find its first resistance at 1.1762, and a rise through could take it to the next resistance level of 1.1833.
Moving ahead, investors will closely monitor Germany’s flash inflation figures and the Euro-zone’s final consumer confidence data, both for July, slated to release in a few hours. Moreover, the US flash 2Q GDP report and final Michigan consumer confidence data for July, both due to release later today, will grab a lot of market attention.
The currency pair is showing convergence with its 20 Hr and 50 Hr moving averages.

UK’s Consumer Confidence Deteriorated In July
For the 24 hours to 23:00 GMT, the GBP declined 0.34% against the USD and closed at 1.3072.
In the Asian session, at GMT0300, the pair is trading at 1.3088, with the GBP trading 0.12% higher against the USD from yesterday's close.
Overnight data indicated that UK's GfK consumer confidence index eased more-than-expected to a level of -12.0 in July, a sign that heightened political and economic uncertainty in the nation may be denting confidence in the economy. The index had recorded a reading of -10.0 in the previous month, while investors had expected for a fall to a level of -11.0.
The pair is expected to find support at 1.3040, and a fall through could take it to the next support level of 1.2993. The pair is expected to find its first resistance at 1.3147, and a rise through could take it to the next resistance level of 1.3207.
Amid no economic releases in the UK today, investors will look forward to the Bank of England's interest rate decision, scheduled next week.
The currency pair is trading below its 20 Hr moving average and showing convergence with 50 Hr moving average.

BoJ’s July Summary Of Opinions Indicate Concerns About Credibility, ETF Purchases
For the 24 hours to 23:00 GMT, the USD marginally rose against the JPY and closed at 111.19.
In the Asian session, at GMT0300, the pair is trading at 111.06, with the USD trading 0.12% lower against the JPY from yesterday's close.
The Japanese Yen gained ground against the USD, after Japan's unemployment rate fell more-than-expected to 2.8% in June, as job availability improved further, boosting optimism over the health of the nation's labour market. In the past month, the nation's unemployment rate had registered a reading of 3.1%, while market participants had expected it to fall to 3.0%. Meanwhile, the nation's national consumer price index (CPI) rose 0.4% on an annual basis in June, at par with market expectations. In the prior month, the CPI had registered a similar rise.
Another set of data revealed that Japan's seasonally adjusted retail trade rebounded 0.2% in June, compared to a fall of 1.6% in the previous month. Markets were anticipating retail trade to advance 0.4%. Moreover, the nation's large retailers' sales registered an unexpected rise of 0.2% in June, defying market consensus for a fall of 0.1% and following decline of 0.6% in the prior month.
Separately, the Bank of Japan's (BoJ) summary of opinions report from its July meeting showed that policymakers discussed repeated delays in meeting the central bank's inflation target and that it could undermine the BoJ's credibility. Also, they called for an in-depth discussion on whether it was appropriate to continue buying exchange-traded funds.
The pair is expected to find support at 110.66, and a fall through could take it to the next support level of 110.25. The pair is expected to find its first resistance at 111.59, and a rise through could take it to the next resistance level of 112.11.
The currency pair is trading below its 20 Hr and 50 Hr moving averages.

Swiss Franc Trading Lower, Ahead Of Swiss KOF Leading Indicator Data
For the 24 hours to 23:00 GMT, the USD rose 1.37% against the CHF and closed at 0.9645.
In the Asian session, at GMT0300, the pair is trading at 0.9701, with the USD trading 0.58% higher against the CHF from yesterday’s close.
The pair is expected to find support at 0.9554, and a fall through could take it to the next support level of 0.9408. The pair is expected to find its first resistance at 0.9784, and a rise through could take it to the next resistance level of 0.9868.
Moving ahead, Switzerland’s KOF leading indicator data for July, due to release in a few hours, will be on investors’ radar.
The currency pair is trading above its 20 Hr and 50 Hr moving averages.

Loonie Trading A Tad Lower, Ahead Of Canada’s GDP Report
For the 24 hours to 23:00 GMT, the USD rose 0.79% against the CAD and closed at 1.2551.
On the macro front, Canada's CFIB business barometer index fell to a level of 60.7 in July, after recording a level of 60.9 in the preceding month.
In the Asian session, at GMT0300, the pair is trading at 1.2552, with the USD trading marginally higher against the CAD from yesterday's close.
The pair is expected to find support at 1.2452, and a fall through could take it to the next support level of 1.2352. The pair is expected to find its first resistance at 1.2614, and a rise through could take it to the next resistance level of 1.2676.
This afternoon will bring a crucial Canadian release, namely the gross domestic product (GDP) data for May.
The currency pair is trading above its 20 Hr and 50 Hr moving averages.

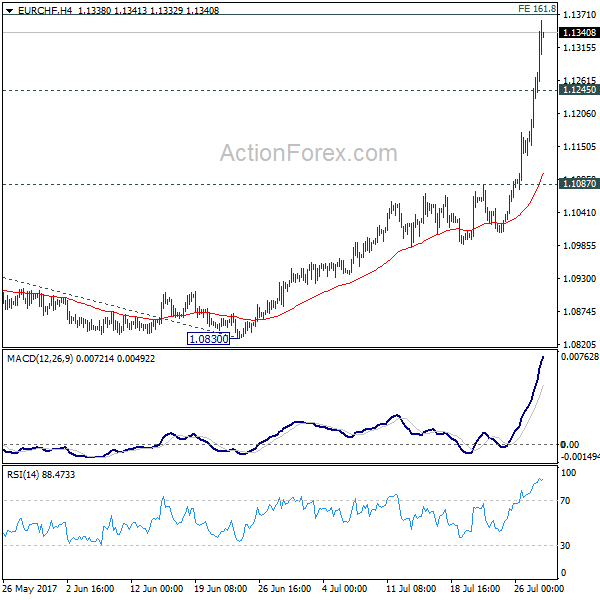
EUR/CHF Daily Outlook
Daily Pivots: (S1) 1.1184; (P) 1.1229; (R1) 1.1310; More...
EUR/CHF surges to as high as 1.1362 so far and intraday bias stays on the upside. Current rally is starting 161.8% projection of 1.0652 to 1.0986 from 1.0830 at 1.1370. Break there will target 200% projection at 1.1498 next. On the downside, below 1.1245 minor support will turn bias neutral and bring consolidations first. But downside of retreat should be contained well above 1.1087 to bring rally resumption.
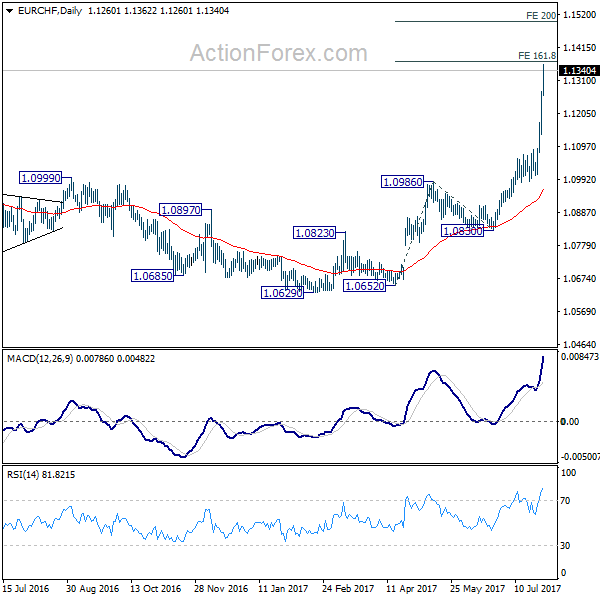
In the bigger picture, sustained break of 1.1198 key resistance confirms resumption of the long term rise from SNB spike low back in 2015. In such case, EUR/CHF could eventually head back to prior SNB imposed floor at 1.2000. For now, this will be the favored case as long as 1.0986 resistance turned support holds.
EUR/GBP Daily Outlook
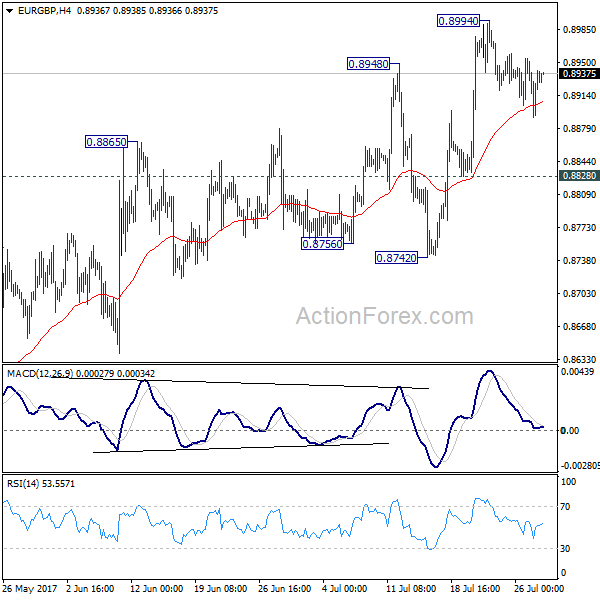
Daily Pivots: (S1) 0.8900; (P) 0.8927; (R1) 0.8962; More
Intraday bias in EUR/GBP remains neutral as consolidation from 0.8994 continues. Downside of retreat should be contained by 0.8828 minor support to bring another rally. Break of 0.8994 will extend the whole rise from 0.8312 towards 0.9304 high. here is no clear sign of up trend resumption yet. Hence, we'll be cautious on strong resistance from 0.9304 to limit upside and bring another fall.
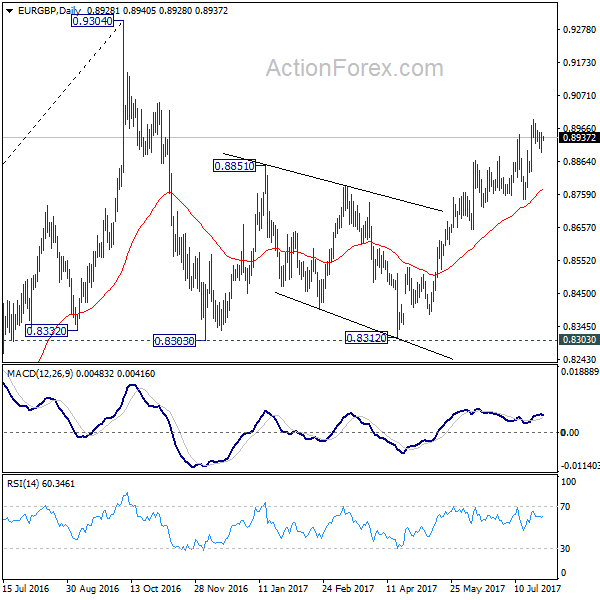
In the bigger picture, price actions from 0.9304 are viewed as a medium term corrective pattern. It's uncertain whether it is finished yet. But in case of another fall, we'd expect strong support from 0.8116 cluster support (50% retracement of 0.6935 to 0.9304 at 0.8120) to contain downside and bring rebound. Whole up trend from 0.6935 is expected to resume after consolidation from 0.9304 completes.
European Open Briefing: The US Dollar Recovered Overnight
Global Markets:
- Asian stock markets: Nikkei down 0.70 %, Shanghai Composite fell 0.05 %, Hang Seng declined 0.60 %, ASX 200 lost 1.50 %
- Commodities: Gold at $1258 (-0.15 %), Silver at $16.50 (-0.40 %), WTI Oil at $48.90 (-0.30 %), Brent Oil at $51.35 (-0.30 %)
- Rates: US 10-year yield at 2.30, UK 10-year yield at 1.20, German 10-year yield at 0.53
News & Data:
- Australia PPI q/q 0.5 % vs 0.6 % expected
- Australia PPI y/y 1.7 % vs 1.3 % previous
- Japan CPI 0.4 % vs 0.4 % expected
- Japan Unemployment Rate 2.8 % vs 3.0 % expected
- Japan Retail Sales y/y 2.1 % vs 2.3 % expected
- Japan Household Spending m/m 1.5 % vs -0.1 % expected
- Japan Household Spending y/y 2.3 % vs 0.6 % expected
- Asian shares pull back after U.S. techs knocked off highs – RTRS
Markets Update:
The US Dollar recovered overnight against most other major currency pairs. Risk appetite decreased, with stocks declining and the Japanese Yen catching a bid.
The focus of traders was on the Swiss Franc. The CHF pairs had a large move in the Asian session, with no fundamental reason behind it. USD/CHF rallied to a high of 0.9720, while EUR/CHF made it to 1.1360. There were rumours of the SNB being active in the market earlier this week.
EUR/USD consolidated in a 1.1670-90 range overnight. Key support is now seen at 1.1620, where the pair should run into decent demand. Meanwhile, GBP/USD failed to sustain momentum above 1.31 and reached a low of 1.3060 overnight.
USD/JPY suffered from the risk-off sentiment and fell to 110.90. Support is seen at 110.80 and 110.20, while resistance lies at 111.30 and 111.70.
The commodity currencies declined as well. AUD/USD reached a low of 0.7950. While the outlook remains positive, the pair is somewhat overbought in the short-term and could see another test of 0.79 soon.
Upcoming Events:
- 07:45 BST – French CPI
- 10:00 BST – Euro Zone Consumer Confidence
- 13:00 BST – German CPI
- 13:30 BST – US GDP
- 13:30 BST – Canadian GDP
- 15:00 BST – US Michigan Consumer Sentiment