

Sample Category Title
USD/CAD Canadian Dollar Lower After Dollar Rebound
USD/CAD Canadian Dollar Lower After Dollar Rebound
The Canadian dollar depreciated on Thursday against the US dollar after US economic releases were positive and gross domestic product (GDP) forecasts were upgraded for the second quarter. The Trump administration has also put forth a plan to get the much awaited tax reform policy plan in motion. Trump had promised tax reforms and infrastructure spending out of the gate of his presidency, but had so far put higher priority in more divisive issues. The pro-growth policy and the decision to drop the border tax shows a willingness from Republicans to abandon the controversial measures to assure a tax overhaul.
The US Bureau of Economic Analysis will publish the first estimate of second quarter gross domestic product (GDP) on Friday, July 28 at 8:30 am EDT. The market is forecasting a 2.5 percent gain in the advanced 2Q GDP figures. Growth is anticipated to have accelerated after a disappointing first quarter pace of 1.4 percent. A print below the forecast would be seen as a negative for the USD with the Atlanta Fed upgrading its forecast on Thursday from 2.5 percent to 2.8 percent.
A strong rebound in GDP growth would put the dovish FOMC statement into perspective. The concerns about low inflation were blown out of proportion in the Fed communication but could go either way if the growth of the US economy disappoints on Friday. The loonie has appreciated this year thanks to strong Canadian fundamentals and the quick hawkish turn form the Bank of Canada (BoC) that translated into a rate hike in July.
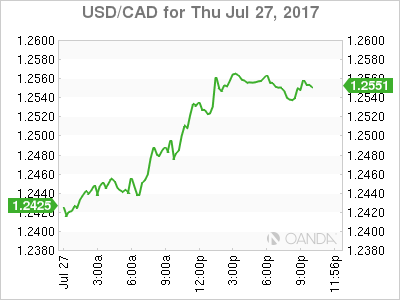
The USD/CAD gained 0.881 percent on Thursday. The currency pair is trading at 1.2556 after the USD rebounded following an improved GDP forecast and the Trump administration getting back on track to pass the promised tax reform. The loonie fell with no support from economic releases and despite the rise of oil prices.
The release of the first estimate of second quarter US GDP tomorrow at 8:30 am EDT will be the the highlight of the trading session. At the same time Canadian monthly data will be released. The US is anticipated to have grown close to 2.5 percent while Canadian monthly GDP gains are expected at 0.2 percent matching last month’s release.
Economic indicators have been mixed for the US economy. The U.S. Federal Reserve hiked the benchmark interest rate in June, but is awaiting signs of accelerated growth before committing to a third rate hike this year. Inflation in the United States remain weak but if employment and growth keep their pace of growth the central bank will hike as planned. A slowdown in the progress of the US economy would trigger a more dovish Fed which could put the dollar under downward pressure.
Oil prices were behind the decision from the Bank of Canada (BoC) to cut interest rates back in 2015 so with the stability provided by the Organization of the Petroleum Exporting Countries (OPEC) and other producers limiting output it makes sense to bring the rate back to previous levels. There are rumours that the decision did not sit well with the Canadian government as it could cause pain to high debt households. Real estate prices in Vancouver and Toronto have retreated for the moment, but it will take more than 25 basis points to trigger a correction. The central bank could follow through with another hike before the end of the year to bring rates back to 2015 levels and also keep the gap between American and Canadian rates to widen.
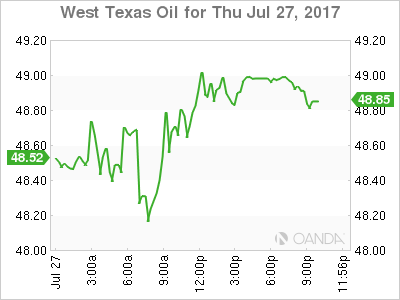
The price of energy has gained 1.138 percent on Thursday. West Texas Intermediate is trading at $48.83 on a volatile session where crude moved more than two percent intraday. Bigger than expected drawdowns in US inventories and what appears to be a change in strategy from shale drillers as US production is anticipated to slow down has given this round to the producers who agreed to cut production.
The Organization of the Petroleum Exporting Countries (OPEC) and other major producers will continue to limit production until March of 2018 with Saudi Arabia taking a leadership role but asking for more compliance to the agreed levels of production. Disruptions in Libya and Nigeria make them exempt of the deal, but as those issues are sorted production has growth threatening the efforts of the group.
Crude has gained 4.7 percent in the last five days as US production has slowed down as evidenced by shrinking inventories. The OPEC agreement is a long way in reducing the supply glut but so far its efforts have resulted in higher oil prices. Internal dissent and the difficulties of proper production compliance will be a challenge going forward as well as a ramp up from Brazil, Canada and US operations once oil reaches higher price levels.
Market events to watch this week:
Friday, July 28
8:30 am CAD GDP m/m
8:30 am USD Advance GDP q/q
Dollar Rebounds Ahead Of Q2 US GDP
Growth expected to have doubled from disappointing Q1
The USD dollar is higher against major pairs awaiting the release of US growth in the second quarter. Comments from the Trump administration on plans to move forward on tax reform in the Autumn has also put a bid on the greenback. Pro-growth policies have been delayed as healthcare and immigration took priority for the Administration, but now it appears there is real push them forward.
The US Bureau of Economic Analysis will publish the first estimate of second quarter gross domestic product (GDP) on Friday, July 28 at 8:30 am EDT. The market is forecasting a 2.5 percent gain in the advanced 2Q GDP figures. Growth is anticipated to have accelerated after a disappointing first quarter pace of 1.4 percent. A print below the forecast would be seen as a negative for the USD with the Atlanta Fed upgrading its forecast on Thursday from 2.5 percent to 2.8 percent.
Economic indicators have been mixed for the US economy. The U.S. Federal Reserve hiked the benchmark interest rate in June, but is awaiting signs of accelerated growth before committing to a third rate hike this year. Inflation in the United States remain weak but if employment and growth keep their pace of growth the central bank will hike as planned. A slowdown in the progress of the US economy would trigger a more dovish Fed which could put the dollar under downward pressure.
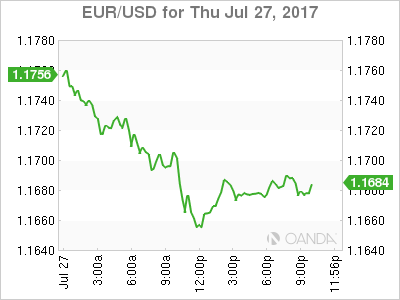
The EUR/USD gained 0.317 percent in the last 24 hours. The single currency is trading at 1.1665 after a rebound in 10 year yields and an upgrade GDP estimate form the NY Fed got the dollar back on its feet. The July FOMC statement was taken as dovish by the market, but the central bank stuck to previous messaging and regarding inflation removed the ambitious “somewhat” and is now squarely at below the two percent target.
Tomorrow's first estimate of second quarter GDP is expected to improve from the disappointing first quarter and could in hindsight make the Fed statement less dovish as the central bank has not backed down from its balance sheet reduction plans. The massive bond buying during its QE program will begin to shrink starting in the fall as per the economists and then the market will focus on a potential third rate hike in December.
The Trump administration appears to have moved on from the healthcare debate and is mounting a serious effort to introduce tax reforms in the fall. The joint statement by House Speaker Paul Ryan, Senate Majority Leader Mitch McConnell, Treasury Sec. Steven Mnuchin, National Economic Council Director Gary Cohn, Senate Finance Committee Chairman Orrin Hatch, and House Ways and Means Committee Chairman Kevin Brady was a shot in the arm of the dollar. The tax reform policy is not expected to have as much opposition as healthcare and could be the biggest win so far for the Trump Administration if it passes without issue.
The Fall calendar will be important for the dollar with NAFTA renegotiation to kick off in August, but continue through the last quarter of the year and the just announced tax reform process.
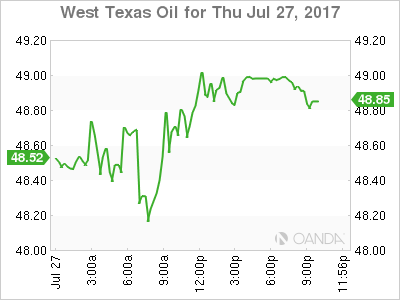
The price of energy has gained 1.138 percent on Thursday. West Texas Intermediate is trading at $48.83 on a volatile session where crude moved more than two percent intraday. Bigger than expected drawdowns in US inventories and what appears to be a change in strategy from shale drillers as US production is anticipated to slow down has given this round to the producers who agreed to cut production.
The Organization of the Petroleum Exporting Countries (OPEC) and other major producers will continue to limit production until March of 2018 with Saudi Arabia taking a leadership role but asking for more compliance to the agreed levels of production. Disruptions in Libya and Nigeria make them exempt of the deal, but as those issues are sorted production has growth threatening the efforts of the group.
Crude has gained 4.7 percent in the last five days as US production has slowed down as evidenced by shrinking inventories. The OPEC agreement is a long way in reducing the supply glut but so far its efforts have resulted in higher oil prices. Internal dissent and the difficulties of proper production compliance will be a challenge going forward as well as a ramp up from Brazil, Canada and US operations once oil reaches higher price levels.
Market events to watch this week:
Friday, July 28
8:30 am CAD GDP m/m
8:30 am USD Advance GDP q/q
Dovish Fed Spurs Commodity Prices and Currencies Higher
Commodity currencies are looking at their most bullish since 2015 after the Federal Reserve struck a dovish tone on inflation at its latest monetary policy meeting yesterday, lifting the price of risk assets, including those of commodities. Commodity prices have already been on the up during the past month, boosted in part by growing demand from China – the world's biggest consumer of commodities.
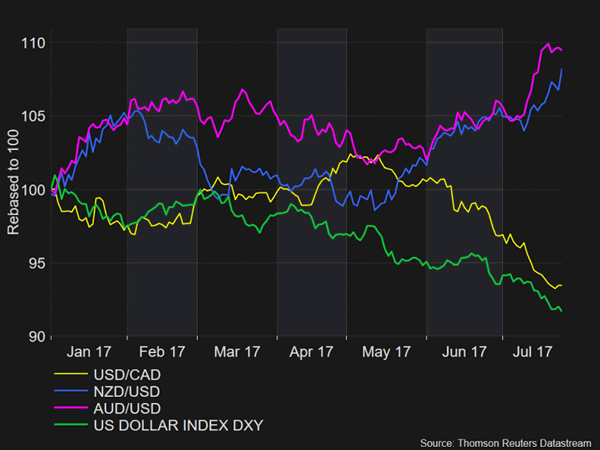
This uptrend has helped drive commodity-linked currencies such as the Canadian, Australian and New Zealand dollars to 2-year highs, although the three currencies began their current rally in May. While doubts about the Fed's projected path of three rate hikes in 2017 and the reversal of the Trumpflation trade have been the main contributor in reducing the appeal of the greenback, the three currencies have had other factors pulling them up.
The Canadian dollar is up nearly 7% in the year-to-date against its US counterpart, as the Bank of Canada recently adopted a hawkish stance and swiftly proceeded with raising rates for the first time in seven years at its July meeting. Many analysts expect one more hike by the bank in 2017, with the Canadian economy set to become the fastest growing among the G7 this year according to the IMF's latest forecasts. Add to that some signs in the oil market that the global supply glut is receding and the willingness by OPEC members to take further measures, dollar/loonie may have more downside to go before it bottoms out. Though in the short term, a correction is looking overdue given that the pair's technical indicators are in overbought territory.
The Australian dollar has made even bigger gains, appreciating by almost 11% against the greenback so far this year. Unlike the Bank of Canada, the Reserve Bank of Australia is not yet ready to turn hawkish. However, this hasn't stopped market speculation about how soon a rate hike will come and the RBA has fuelled such talk by its own upbeat views on the Australian economy. More recently, expectations of a near-term rate rise have diminished as both inflation and wage growth remain subdued. But the aussie remains a relatively high-yielding currency, which it benefits from at times of risk-on sentiment.
The risk-sensitive Australian and New Zealand dollars have come back in favour with investors as the dollar falters on Trump's political troubles and a less hawkish Fed. Yesterday's FOMC statement was the most dovish the Fed has sounded this year regarding inflation, even as the US economy picks up some traction. Stronger commodity prices are also helping increase the lure of the aussie and the kiwi, as well as for emerging market currencies such as the South African rand, Mexican peso and the Russian ruble.
Base metals have been one of the big gainers in the commodities market recently. Copper futures prices have risen to the highest since May 2015 and iron ore is trading near 2-month highs. Other metals such as zinc, lead and aluminium are also up sharply this year. However, despite evidence that demand from China is on the up, metal prices are at risk of a reversal as part of this demand has come from companies replenishing their declining inventories, and China's economy is expected to slow in the second half of the year. Steel rebar futures have already come under pressure amid fears of an oversupply.
The aussie remains highly susceptible to any downside reversal in metal prices, particularly iron ore, which Australia is a major exporter of, as this would damage the country's terms of trade. The kiwi on the other hand is less vulnerable to the prices of resources as New Zealand is mostly dependent on dairy exports. In addition, the New Zealand government is enjoying strong finances at the moment and plans to increase infrastructure spending over the next few years, guaranteeing strong growth over the coming period. The kiwi has gained around 8.5% against the US dollar in the year-to-date as New Zealand's economy looks set to outperform other advanced economies.
Judging by the above, the aussie's rally appears to be the most overdone given the shaky outlook for metal prices. The loonie's gains are perhaps the most justified as the BoC is raising rates and crude oil prices seem to be turning a corner (though it's too early to say if oil is out of the bear market), while the kiwi is being supported by a strong New Zealand economy.
Another potential threat for commodity-linked currencies is that the dollar may yet resume its rally. Apart from the small possibility of a tax stimulus being announced in the US anytime soon, strengthening growth may push up wages and inflation much earlier than anticipated. This would inevitably lead to the Fed taking a more hawkish stance once again and the prospect of higher US rates could adversely impact global risk sentiment.
Dollar Little Reacts to Initial Jobless Claims and Durable Goods Figures
On Thursday, a day after the Fed decided to maintain benchmark rates unchanged, the Department of Labour released data on initial jobless claims recorded in the past week, while the Census Bureau published the number of new durable goods ordered for the month of June. Initial jobless claims edged up by 10 thousand and durable goods orders increased by more than double the expected figure. The core measure of durable goods orders, which excludes transportation items, marginally grew, but came in below expectations and the figure from the previous month. The dollar did not show any significant reaction to the data.
According to the Department of Labour, last week 244 thousand individuals (seasonally adjusted) applied for unemployment benefits, exceeding the 234 thousand from the preceding week (the result of an upward revision from 233 thousand) and the expected figure of 241 thousand. The four-week claims average, which irons out weekly volatility, remained unchanged at 244 thousand.
Regarding durable goods ordered for the month of June, the Census Bureau estimated that new orders for long lasting manufacturing goods increased massively by 6.5% month-on-month compared to a contraction of 0.1% in May, surprising analysts who instead anticipated a rise by 3.0%. This increase was the highest since August 2014. Core orders fell short of expectations, rising slightly by 0.2% and coming in below May's upwardly revised 0.6% (from 0.1% before). The bureau also released the June goods trade balance. The figures showed the trade deficit decreasing to reach $63.86bn, down from a $65.90bn in the previous month and below the $65.00bn that was expected. Exports picked up by $1.8bn in June to reach $128.6bn and imports decreasing by $0.7bn to stand at $192.4bn drove the deficit down.
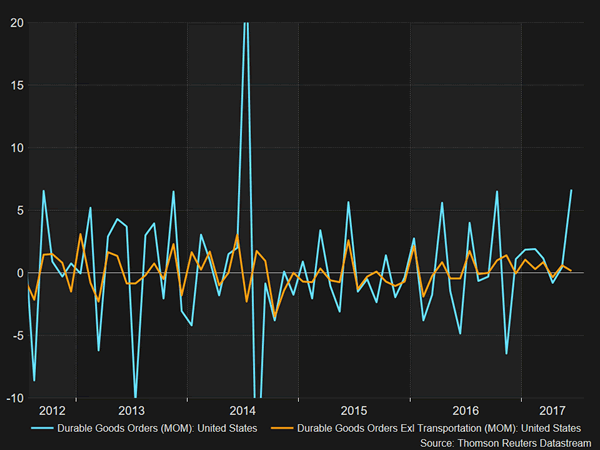
Although applications for unemployment benefits rose during the past week, the labour market remains robust as the US economy continues operating close to full employment with the unemployment rate being at the lowest level since 2007 at 4.3% as of July 2017. Moreover, the decline in the trade deficit in June is likely to positively contribute to second quarter GDP growth given rising exports. US preliminary second quarter GDP estimates will be released tomorrow.
In the forex markets, euro/dollar didn't have much of a reaction to the data. Dollar/yen posted some minor gains within the first few minutes of data release, rising to 111.47 from 111.31 previously. In late European trading hours, euro/dollar was down 0.2% on the day, trading at 1.1661. Meanwhile, dollar/yen was 0.1% up at 111.57.
Trade Idea Wrap-up: USD/CHF – Buy at 0.9600
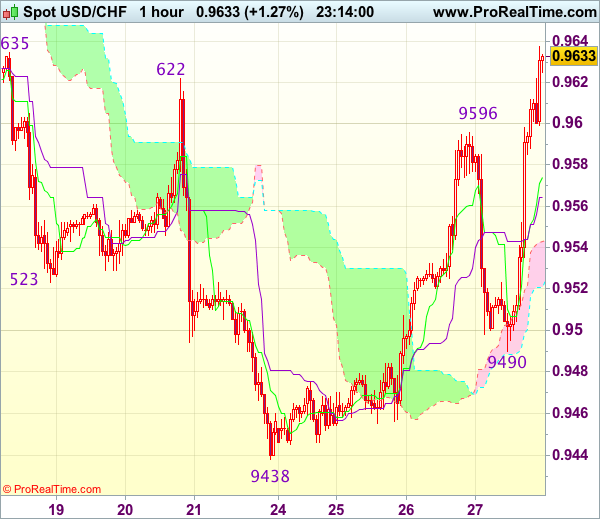
USD/CHF - 0.9660
Most recent candlesticks pattern : N/A
Trend : Near term down
Tenkan-Sen level : 0.9586
Kijun-Sen level : 0.9576
Ichimoku cloud top : 0.9543
Ichimoku cloud bottom : 0.9521
New strategy :
Buy at 0.9600, Target: 0.9700, Stop: 0.9565
Position : -
Target : -
Stop : -
Although the greenback slipped to 0.9490 earlier today, renewed buying interest emerged and dollar has rallied above indicated resistance at 0.9622-35, confirming recent decline has ended at 0.9438, hence upside bias is seen for the move from there to extend gain to previous resistance at 0.9701, however, break there is needed to retain bullishness and encourage for headway to 0.9735-40 first.
In view of this, would not chase this rise here and would be prudent to buy dollar on pullback as previous resistance at 0.9596 should turn into support and contain dollar’s downside. Below 0.9570 would defer and risk test of the upper Kumo (now at 0.9543) but price should stay well above support at 0.9490, bring another rise later.
Trade Idea Wrap-up: GBP/USD – Exit long entered at 1.3085
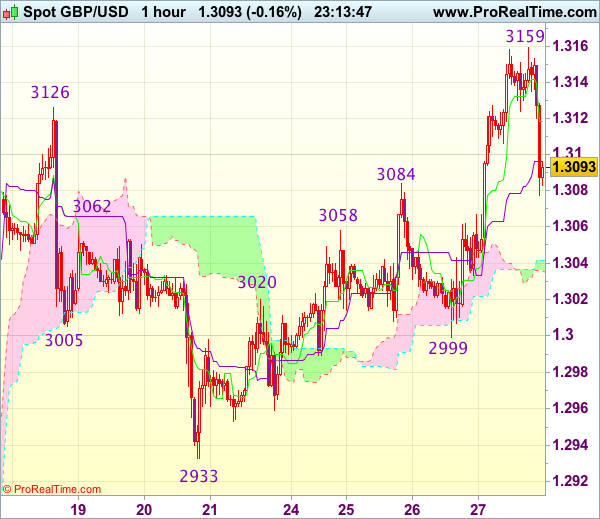
GBP/USD - 1.3085
Most recent candlesticks pattern : N/A
Trend : Near term up
Tenkan-Sen level : 1.3118
Kijun-Sen level : 1.3096
Ichimoku cloud top : 1.3042
Ichimoku cloud bottom : 1.3036
Original strategy :
Bought at 1.3085, Target: 1.3185, Stop: 1.3050
Position : - Long at 1.3085
Target : - 1.3185
Stop : - 1.3050
New strategy :
Exit long entered at 1.3085
Position : - Long at 1.3085
Target : -
Stop : -
Despite intra-day marginal rise to 1.3159, the subsequent sharp retreat suggests top has possibly been formed there and downside risk has increased for retracement of recent upmove to 1.3035-40, however, only break of support at 1.2999 would confirm recent upmove has ended, bring further fall to 1.2980 and later towards 1.2955-60.
In view of this, would be prudent to exit long entered at 1.3085 and stand aside in the meantime. Above 1.3120 would bring recovery to 1.3140 but only break of said resistance at 1.3159 would revive bullishness and signal recent upmove has resumed for headway to 1.3185-90 and then 1.3210-20.
Trade Idea Wrap-up: EUR/USD – Stand aside
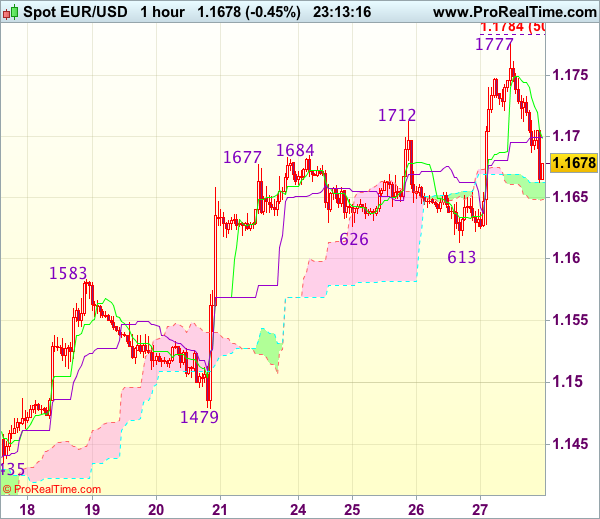
EUR/USD - 1.1672
Most recent candlesticks pattern : N/A
Trend : Near term up
Tenkan-Sen level : 1.1698
Kijun-Sen level : 1.1700
Ichimoku cloud top : 1.1663
Ichimoku cloud bottom : 1.1649
New strategy :
Stand aside
Position : -
Target : -
Stop : -
Although the single currency extended recent upmove and surged to as high as 1.1777 earlier today, the subsequent retreat suggests consolidation below this level would be seen and pullback to 1.1645-50 cannot be ruled out, however, reckon support at 1.1613 would limit downside and price should stay well above previous resistance at 1.1583 (now support), bring another rise later.
On the upside, whilst recovery to 1.1700-10 cannot be ruled out, reckon upside would be limited to 1.1735-40 and said resistance at 1.1777 should remain intact, bring further consolidation. Above 1.1777 would extend recent upmove to 1.1784-85 (50% projection of 1.1370-1.1712 measuring from 1.1613). then 1.1800, however, loss of near term upward momentum should prevent sharp move beyond 1.1820-25 (61.8% projection), risk from there has increased for a retreat later.
Trade Idea Wrap-up: USD/JPY – Hold short entered at 111.45
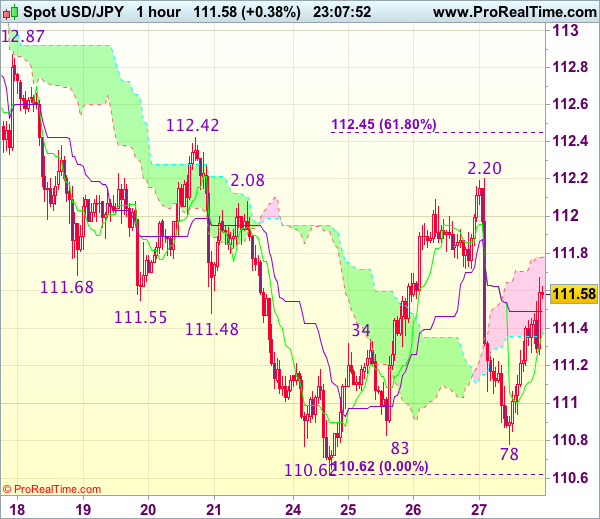
USD/JPY - 111.51
Most recent candlesticks pattern : N/A
Trend : Near term down
Tenkan-Sen level : 111.38
Kijun-Sen level : 111.49
Ichimoku cloud top : 111.78
Ichimoku cloud bottom : 111.37
Original strategy :
Sold at 111.45, Target: 110.45, Stop: 111.80
Position : - Short at 111.45
Target : - 110.45
Stop : - 111.80
New strategy :
Hold short entered at 111.45, Target: 110.45, Stop: 111.80
Position : - Short at 111.45
Target : - 110.45
Stop : - 111.80
The greenback found support at 110.78 and has rebounded, suggesting further consolidation above this week’s low at 110.62 would be seen and marginal gain from here cannot be ruled out, however, reckon the upper Kumo (now at 111.78) would hold and bring retreat later, below said support at 110.78 would signal decline has resumed for retest of 110.62, break there would extend recent fall to 110.30-35.
In view of this, we are holding on to our short position entered at 111.45. Above 111.75-80 would defer and prolong choppy trading, however, price should still falter below said resistance at 112.20, bring retreat later.
Stronger EUR Keeping Inflation Far from the ECB’s Target
Key points
- Euro appreciation is a headwind to inflation and a downward revision to the ECB's forecast should keep inflation far below the target.
- The weaker inflation outlook is likely to keep the ECB on a dovish path, especially as the latest rise in core inflation is not sustainable.
- The risk is that ECB will stay hawkish as it needs an 'excuse' to taper QE given that technical restrictions are again challenging a QE continuation.
- Lack of wage pressure should imply the ECB's exit path will be very gradual, hence the pricing of rate hike is aggressive.
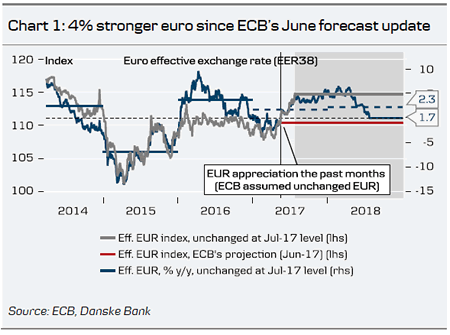
A combination of ECB and Fed communication and the balance of political risks has shifted in favour of the euro, which in effective terms is 4% stronger compared to the assumption in the ECB's projection from June 2017 (see Chart 1). The euro appreciation will be a headwind to headline and core inflation in coming years where the ECB's inflation projection – particularly considering the longer forecast horizon – already seems optimistic. Based on the OECD's new global model, the 4% stronger effective euro will drag down headline inflation by around 0.1pp after one year and an accumulated 0.3pp after two years. Given the ECB's inflation forecast update from June, this should result in an inflation forecast of 1.2% for 2018 and 1.3% for 2019, all else being equal (see Chart 2). Note that we forecast even higher EUR/USD in the longer term, targeting 1.22 in 12 months.
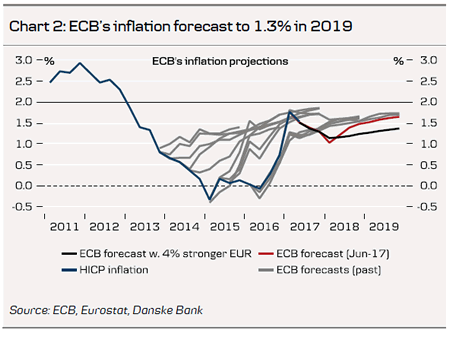
Inflation at 1.3% in 2019 is clearly below the ECB's 2% target for the medium term, implying that pressure on the ECB for expressing a dovish stance is rising. The market is still pricing in a 10bp deposit rate hike at the end of 2018, which in our view is too early as the ECB is likely to continue QE at least until mid-2018 even in a fairly aggressive tapering scenario, after which we expect it to stick to its communication and not hike until 'well past' the QE purchases. It could be the ECB will hike by 20bp (priced in May 2019) but based on the ECB's communication that it will be very gradual, a 10bp deposit rate hike seems most likely and the pricing still seems too hawkish.
We still believe the ECB will continue its QE purchases, but at a reduced pace of EUR40bn per month in H1 18, and that it will announce this at the October meeting with some signalling of it in September. Although an inflation forecast of 1.3% for 2019 is very low, the ECB's recent hawkish shift in focus to the improving economic recovery and its belief that this will result in higher inflation eventually suggest to us that the trigger for a more aggressive QE path currently also hinges on a weaker growth outlook.
Related to the ECB's recent hawkish shift, the risk is that the ECB will look through the downward pressure on inflation and express a hawkish stance due to the ongoing economic recovery. In particular, when Mario Draghi speaks together with other global central bank governors at the Jackson Hole symposium on 24-26 August, he could be perceived as hawkish. However, when the ECB's updated inflation projections are released at the ECB meeting on 7 September, the focus should be on the stronger euro, as it received some attention at the latest meeting already and as Draghi said a financial tightening was 'the last thing' the ECB needs.
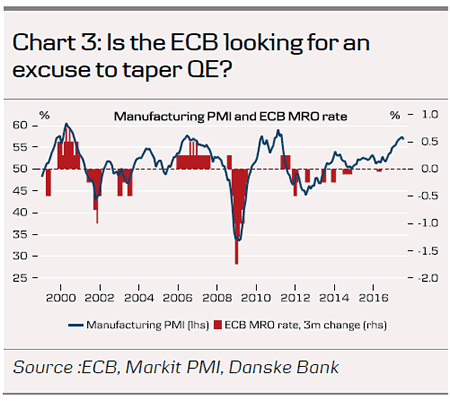
In our view, the ECB's hawkish twist towards the economic recovery could reflect that the ECB is trying to find an 'excuse' to taper QE (see chart 3). While the ECB has not indicated it can end QE due to a sustained adjustment in the path of inflation, the capital key deviations suggest the self-imposed restrictions are again becoming binding thereby challenging a continuation of QE. The ECB has previously resolved this by tweaking the rules, but the pressure for doing so again is much smaller as the deflation risk is gone. Hence, the ECB might continue to focus on the growth momentum and its belief that this will result in higher wage pressure.
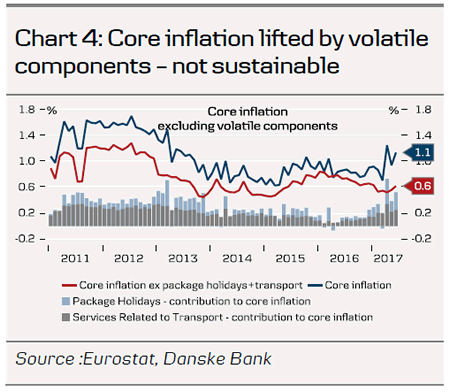
What is supportive of the hawkish twist is the higher core inflation, which was 1.1% in Q2, up from 0.8% in Q1. However, looking into the drivers of the higher core inflation, the rise has been driven by components that are volatile and do not reflect a pickup in underlying price pressure. Excluding package holidays and accommodation as well as services related to transport reveals that core inflation was actually on a downward trend during 2016 and only stabilised recently (see Charts 4 and 7). As the higher inflation in services related to transport reflects an indirect impact of the oil price base effects, this is likely to be a temporary rise – as long as wage pressure remains subdued.
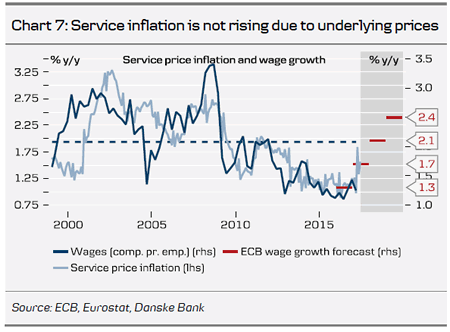
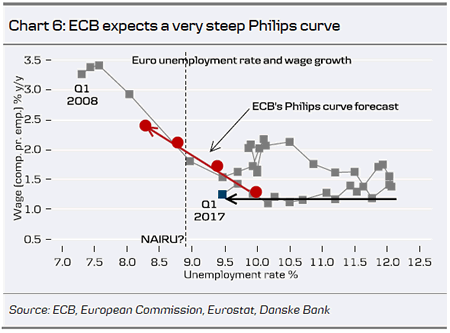
There are still no signs of rising wage pressure and the ECB's projection for wage growth still seems very optimistic. Given the subdued wage growth in Q1, wages need to grow by 0.55% q/q for the rest of the year to reach the ECB's projection. Since 2010, wages have on average risen by 0.37% q/q and given the remaining slack in the labour markets, it is in our view hard to believe in the ECB's forecast (see Chart 6). Note, the ECB argues that slack in the labour market amounts to 18% of the extended labour force.
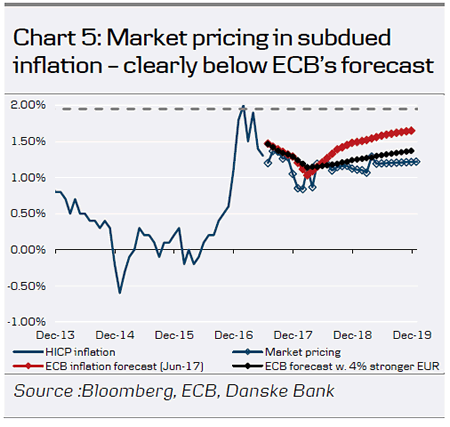
Note, the first euro area inflation figures for July are due for release tomorrow with the German, French and Spanish figures. The euro appreciation during July should not yet result in lower inflation (we expect to see the impact on core inflation after six months), but we look for the German figure to go lower as package tours are likely to have been less supportive. This should lead to a decline in euro area HICP inflation to 1.2% in July from 1.3% in June and in core inflation to 1.0% in July from 1.1% in June, due for release on Monday. In line with our expectations, the market is pricing in a subdued outlook for inflation, which is clearly below the ECB's forecast of a rise in inflation but more consistent with the path following from the 4% stronger euro (see Chart 5).
Dollar Recoups Modestly on Hopes of Business Spending Underpinning GDP Growth
The dollar somewhat rebounded during the European session with the dollar index up 0.1%. The latest data on durable goods orders, jobless claims and trade balance on goods supported the US currency to retrace some of earlier losses post the Federal Open Market Committee meeting. The euro declined against the greenback by 0.35% as the US session was about to start.
Monthly orders for durable goods in the US rose 6.5% last month, expanding at more than double the expected rate and coming in above the upwardly revised figure for May of a 0.1% decline from the original report of 0.8% fall. An increase in wholesale inventories (0.6% jump versus expectations of a 0.2% gain) and a narrowing in the goods trade deficit in June added to the hopes of strong GDP expansion in the second quarter. Traders could be putting their bets on rising inventories implying suppliers' optimism about future sales, rather than a slowdown in moving goods off the shelves. The dollar strengthened against the yen and the euro following the release of the string of data. US preliminary GDP figures are due tomorrow. Dollar/yen was last trading at 111.30, while euro/dollar was at 1.1699.
More out of the US, the Labor Department issued last week's unemployment benefits report, signaling still a healthy labor market. Initial claims for state unemployment benefits rose 10,000 to a seasonally adjusted 244K for the week ended July 22, above the forecasted level of 241K. The four-week average, which irons out weekly volatility, was unchanged at 244K last week. Linked to capacity changes in car-makers assembly plants, the data has been volatile in recent weeks. The volatility may extend beyond summer months as some of the car producers, such as GM prolong the summer shutdowns due to a sales slowdown.
The euro was under pressure against the US dollar during the European session linked to a combination of profit taking following yesterday's rally and good data helping the greenback.
Sterling was broadly flat against the greenback following yesterday's rally on the back of the weakness in the US dollar. The pound/dollar pair was trading at 1.3119 as US traders were starting the day.
The loonie retraced some of this week's gains, falling short of a two-year high ahead of tomorrow's key monthly GDP figure. Dollar/loonie was last trading at 1.2480.
Moving away from forex markets to commodities, oil prices continued gaining during the European session supported by a steeper-than-expected slide in US crude inventories last week. WTI was last trading at $48.82 a barrel while Brent was at $51.09. Gold was up during the day to last trade at $1,261.55 an ounce, unfolding yesterday's rally. The demand for the precious metal has been rising on the recent softness in the US currency.