Sample Category Title
Durables Report Signals Business Spending Could Boost GDP
The 6.5 percent pop in durable goods orders in June handily surpassed consensus expectations. While the eyepopping gain was largely due to a surge in aircraft orders, the details were encouraging as well.
Even After Backing Out Aircraft, a Solid Report
The headline surge in durable goods orders was due largely to a more-thandoubling of civilian aircraft orders compared to the prior month. That is not to suggest that this was the only area of strength, but gains in other categories were smaller in comparison to the +131.2 percent pop in aircraft. Orders for machinery as well as both primary and fabricated metals were all positive in June. Among major categories only electrical equipment and computers saw bookings decline in the month.
In terms of immediate implications for tomorrow's preliminary estimate of second quarter GDP growth, the primary consideration in this report is not orders, but rather shipments. In particular, the key line to hone-in on is non-defense capital goods shipments excluding that big surge in aircraft. Here we see a 0.2 percent increase in June. That is a shade weaker than expectations, but it bears noting that the initially reported increase of 0.1 percent for the prior month (May) was revised to a 0.4 percent gain. In light of the better shipments figures, we acknowledge some upside risk to our forecast for a 3.5 percent rate of growth in equipment spending in tomorrow's GDP report.
Orders lead shipments, so the fact that core capital goods orders were down 0.1 percent in June is mildly concerning. However, the silver lining is that revisions to the prior month's figures were to the upside here as well. An initial estimate of a 0.2 percent rise in May core capital goods orders was lifted to a 0.7 percent increase. Another observation that alleviates the concern about the modest slip in core capital goods orders in June is the fact that the new orders component of the ISM report jumped four points to 63.5 in June, and the new orders components in the latest prints for the regional Fed surveys (Empire, Philly, Richmond and Dallas) were firmly in expansion territory as well.
Is the Inventory Build Good News or Bad News?
Durable goods inventories were a bit higher in June, climbing 0.4 percent on the month. While an inventory build is positive for GDP growth, stockpiling is not always good news for the economy. If the accumulation of inventories is in anticipation of a quickening demand environment (higher sales, increased orders) that is generally positive. If it is a result of product simply not moving because demand is drying up, that clearly is not a good signal. Given the late stage of the business cycle, it is not altogether clear which is the driving force in the 0.4 percent increase in June.
While it is not a perfect litmus test, one time-tested way of determining the difference is to look at inventories as a share of shipments. As the bottom chart shows, this series will tend to rise in the lead-up to recessions, and that is clearly not what is going on at present.
Dollar Sell-off Slows, But Nothing More Than That
- European equities started the session with a rally that run fast into resistance and was followed by a slide towards yesterday's closing levels. The price action was driven by multiple earnings results that were mixed. US equities start positively on generally better than expected earnings.
- The number of Americans filing for unemployment benefits rebounded from a three-month low last week (from 234k to 244k), but remained below a level consistent with a tightening labour market. The US trade deficit narrowed more than estimated in June (to $63.9 billion from $66.3 billion) in a positive sign for economic growth.
- The US economy is experiencing steady but slower growth in business investment as orders for capital equipment eased last month (-0.1% M/M) following a May increase that was bigger than previously reported (0.7% M/M from 0.2 M/M).
- Growth in bank lending was unexpectedly weak in June, a potentially worrying sign for policymakers even if a one-off factor may have contributed to the slowdown. Lending to EMU non-financial corporations slowed to 2.1% Y/Y in June from 2.5% Y/Y in May. Lending to households meanwhile grew by 2.6% Y/Y in June, unchanged from May.
- The head of the Financial Conduct Authority has called for Libor, the interbank lending rate at the heart of a multibillion banking scandal, to be phased out in 2021 and replaced by more reliable alternatives.
- US President Trump's newly appointed communications director Scaramucci shook up relations both in the White House and on the international stage, dialling in to a live broadcast on CNN to warn that Mr Trump "may veto" the Russian sanctions bill, and that his relationship with chief of staff Priebus was potentially irreparable.
- The BoE has appointed a veteran civil servant to become its new deputy governor. Dave Ramsden – currently the chief economic adviser to the Treasury and head of the Government Economic Service – will become the new deputy governor of markets and banking, starting his five-year term on September 4.
Rates
2nd reading of Fed statement opens investors' eyes
Global core bonds failed to hang on to gains on "the day after". Yesterday's rise of US Treasuries proved to be exaggerated and suggests more downside, especially if tomorrow's eco data don't disappoint (Q2 GDP & Core PCE). The Fed kept policy unchanged, keeping the door open for a September announcement on the start of the balance sheet run-off and a December rate hike. Today's price action suggests that markets overreacted to a subtle change on the assessment of current inflation (EUR/USD back below 1.17). German Bunds outperform US Treasuries on the daily scorecard, but that's because of the catching-up effect. European markets were already closed by the time of the release of the Fed statement yesterday. European stock markets and oil prices trade currently near opening levels while EMU/US eco data printed rather close to consensus (see headlines). None of these factors had any intraday importance for core bond trading. The US Treasury concludes its end-of-month refinancing operation tonight with a $28B 7-yr Note auction. The WI currently trades around 2.13%.
At the time of writing, German yields decline by 0.8 bps (2-yr) to 2.5 bps (10-yr) with the belly underperforming the wings. The US yield curve bear steepens with yields 0.8 bps (2-yr) to 3.7 bps (30-yr) higher. On intra-EMU bond markets, 10-yr yield spread changes versus Germany are nearly unchanged with Greece (+5 bps) underperforming.
Currencies
Dollar sell-off slows, but nothing more than that…
Today, the decline of the dollar slowed. US data (durable orders, trade balance, claim) painted a very diffuse picture and gave no guidance for USD trading. EUR/USD and USD/JPY are trading slightly off the recent lows, but the moves are insignificant from a technical point of view. The battle for the key 1.11714/35 LT EUR/USD resistance continues.
Overnight, the post-Fed USD decline continued, but the pace of the down-move slowed. EUR/USD traded temporary north of the key 1.1714/35 resistance in Asian, but returned to the 1.1735 pivot at the start of European trading. USD/JPY reversed an earlier dip below 111. AUD/USD jumped above the psych. barrier of 0.80.
In Europe, trading in interest rate markets and in the dollar entered calmer waters after yesterday's brisk moves in the wake of the Fed policy statement. In technical trading, the dollar regained slightly ground after yesterday's sell-off. EUR/USD drifted to the low 1.17 area. Interest rate differentials were again no relevant factor for the EUR/USD swings. USD/JPY traded in the 111.40 area around noon.
Over the previous days, the sentiment on the dollar tended to worsen in the run-up to the US trading session. This wasn't the case today. If anything, the dollar gained a few more ticks going into the US eco data. The US data were very diffuse. Durables were marginally better than expected, given upward revision of the previous month figures, claims were slightly higher than expected and the trade deficit was a bit smaller than expected. Too many conflicting signals to trigger a directional USD move. The focus turns to tomorrow's US Q2 GDP report. EUR/USD hovers near the 1.17 level. USD/JPY trades in the 111.50 area. The USD sell-off took pause, but the gains are insignificant from a technical point of view. The test of the key 1.1714/35 LT resistance is ongoing and there no clear indication to what side the balance will tilt.
Among the smaller currencies, the decline of the Swiss franc accelerates. Low global volatility and expectations that the SNB will lag the policy normalisation in the EMU (and globally) triggers some kind of 'CHF long squeeze'.
Sterling extends cautious rebound
Yesterday and this morning sterling performed rather well given the overall USD weakness. There was only a modest and temporary spill-over effect of the overnight the EUR/USD rally into EUR/GBP. In technical trading, cable slightly outperformed EUR/USD this morning, pushing EUR/GBP lower in the 0.89 big figure. The CBI July retail data were stronger than expected. The indictor is often ignored in sterling trading. This time, the report triggered a small further strengthening of sterling. EUR/GBP dropped temporary below 0.89., but the move petered out soon. Cable is changing hands at about 1.3130/40. The BOE named Dave Ramsden as deputy governor of the BoE, replacing Charlotte Hogg. Ramsden was chief economic adviser at the Treasury.
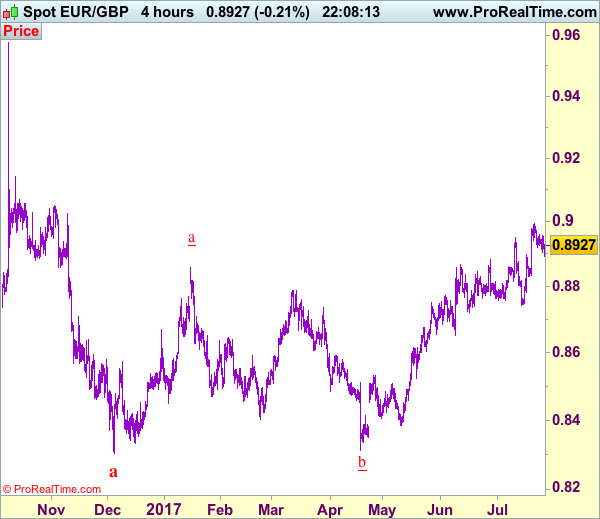
Trade Idea: EUR/GBP – Buy at 0.8865
EUR/GBP - 0.8921
Recent wave: Major double three (A)-(B)-(C)-(X)-(A)-(B)-(C) is unfolding and 2nd (A) has possibly ended at 0.6936.
Trend: Near term up
Original strategy :
Buy at 0.8875, Target: 0.8995, Stop: 0.8835
Position : -
Target : -
Stop : -
New strategy :
Buy at 0.8865, Target: 0.8995, Stop: 0.8825
Position : -
Target : -
Stop : -
Euro’s retreat after last week’s rally to 0.8995 has retained our view that consolidation below this level would be seen and pullback to 0.8880 cannot be ruled out, however, reckon downside would be limited to 0.8860-65 and bring another rise later, above psychological resistance at 0.9000 would extend recent rise to 0.9020 and possibly towards 0.9050 but overbought condition should prevent sharp move beyond latter level, risk from there has increased for a retreat later.
In view of this, would not chase this rise here and would be prudent to buy euro on pullback as 0.8860-65 should limit downside. Only break of support at 0.8829 would abort and confirm top is formed instead, bring correction to 0.8800 first.
Our preferred count is that, after forming a major top at 0.9805 (wave V), (A)-(B)-(C) correction is unfolding with (A) leg ended at 0.8400 (A: 0.8637, B: 0.9491 and 5-waver C ended at 0.8400. Wave (B) has ended at 0.9413 and impulsive wave (C) has either ended at 0.8067 or may extend one more fall to 0.8000 before prospect of another rally. Current breach of indicated resistance at 0.9043 confirms our view that the (C) leg has ended and bring stronger rebound towards 0.9150/54, then towards 0.9240/50.
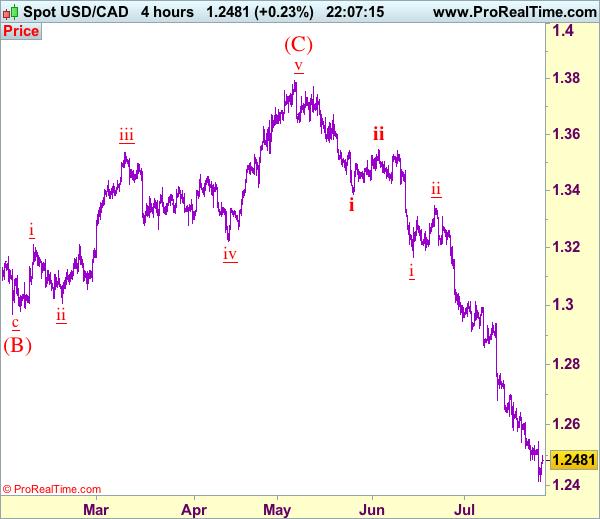
Trade Idea: USD/CAD – Sell at 1.2690
USD/CAD - 1.2480
Recent wave: Only wave v of c has ended at 0.9407 and wave C of major A-B-C correction is underway with wave iii ended at 1.4690, wave v of C may bring one more marginal rise probably in 2018
Trend: Down
Original strategy :
Sell at 1.2690, Target: 1.2490, Stop: 1.2750
Position: -
Target: -
Stop: -
New strategy :
Sell at 1.2690, Target: 1.2490, Stop: 1.2750
Position: -
Target: -
Stop:-
As the greenback has recovered after brief fall to 1.2414, suggesting consolidation above this level would be seen and corrective bounce to 1.2555-60 and then 1.2600 is likely, however, reckon upside would be limited to 1.2690-00 and bring another decline, below said support at 1.2414 would add credence to our view that recent downtrend is still in progress, we are keeping our count that wave v as well as wave (C) ended at 1.3794 and impulsive wave (i ii, i ii) is now unfolding with minor wave iii still in progress, hence bearishness remains for this fall to extend weakness to 1.2400, however, oversold condition should prevent sharp fall below 1.2350-60 and reckon 1.2300 would hold, risk from there is seen for a rebound later.
In view of this, would not chase this fall here and would be prudent to sell the pair again on recovery as 1.2690-95 should limit upside. Above 1.2745-50 would defer and risk a stronger rebound to 1.2800-10 but only break of latter level would signal a temporary low is formed instead, bring retracement of recent decline to 1.2850, then 1.2900, however, price should falter below 1.3000 and the greenback shall head south again from there.
To recap, wave B from 1.3066 is unfolding as an a-b-c and is sub-divided as a: 1.2192, b: 1.2716 and wave c is a 5-waver with i: 1.1983, ii: 1.2506, extended wave iii with minor iii at 1.0206, wave iv ended at 1.0781 and wave v as well as wave iii has ended at 0.9931, hence the subsequent choppy trading is the wave iv which is unfolding as (a)-(b)-(c) with (a) leg of iv ended at 1.0854, followed by (b) leg at 1.0108 and (c) leg as well as the wave iv ended at 1.0674. The wave v is sub-divided by minor wave (i): 0.9980, (ii): 1.0374, (iii): 0.9446, (iv): 0.9913 and (v) as well as v has possibly ended at 0.9407, therefore, consolidation with upside bias is seen for major correction, indicated target at 1.3700 and 1.4000 had been met and further gain to 1.4700 would be seen later.
Copper Maintains Firm Tone and Heads Higher
Copper contract for July delivery maintains firm tone and heads higher after Wednesday's upside rejection at $2.9040 (2-year high) and subsequent shallow pullback on profit taking. Strong bullish sentiment supports for further advance, as the price eyes targets at 2.9434 (FE 123.6% of current wave C from 2.4720) and 2.9550 (Fibo 138.2% projection). Conditions on daily chart remain strongly overbought but indicators are so far not showing signs of reversal. However, pullback on profit-taking of steep in past few sessions could be anticipated in the near-term. Thick hourly cloud (currently spanned between 2.8611 and 2.8105) continues to underpin near-term action and should contain corrective dips.
Res: 2.9040; 2.9310; 2.9434; 2.9550
Sup: 2.8790; 2.8611; 2.8435; 2.8305
WTI Hits the Upper Bound of a Medium-Term Downside Channel
Oil prices extended their latest gains on Wednesday, on the weekly US EIA crude inventory data. Inventories fell by 7.2 million barrels, far more than the consensus for a decline of 2.6 million barrels. The precious liquid began to recover earlier this week, following announcements by Saudi Arabia that it plans to limit its oil exports, and by Nigeria that it will cap its production. In addition, the consistent plunge in the US dollar in recent days probably boosted oil prices even further.
Even if oil prices remain supported on the back of this sentiment over the next few days, we do not believe that the latest rally will develop into a longer-term healthy uptrend in oil. Continued gains in prices would probably invite more US shale producers back into the market, something that could increase supply even further and thereby, put a lid on prices.
WTI continued trading higher in the aftermath of Saudi's and Nigeria's announcements. Nevertheless, today the precious liquid hit resistance at the crossroads of the 49.00 (R1) level and the upper bound of the medium-term downside channel that has been containing the price action since the beginning of February. Although the price is still trading above the short-term upside support line taken from the low of the 21st of June, the fact that it hit resistance at the upper bound of the channel makes us mindful that a slide may be on the cards soon.
The possibility for a setback is also supported by our short-term momentum indicators. The RSI just exited its above-70 territory and is pointing down, while the MACD, although above both its zero and trigger lines, shows signs of topping. A decisive close above the aforementioned crossroads is needed to make us confident oil is likely to continue higher in the next days.
Switching to the daily chart, given that WTI remains within the channel that has been containing the price action since February, we maintain our view that the longer-term path is cautiously negative and that the latest recovery is just a corrective phase.
Even if the bulls manage to overcome the upper bound of the channel, we are hesitant to call for a reversal and a newborn long-term uptrend. We expect any further gains to remain capped by the 51.00-55.00 range, where we believe US shale producers may be attracted to increase production.
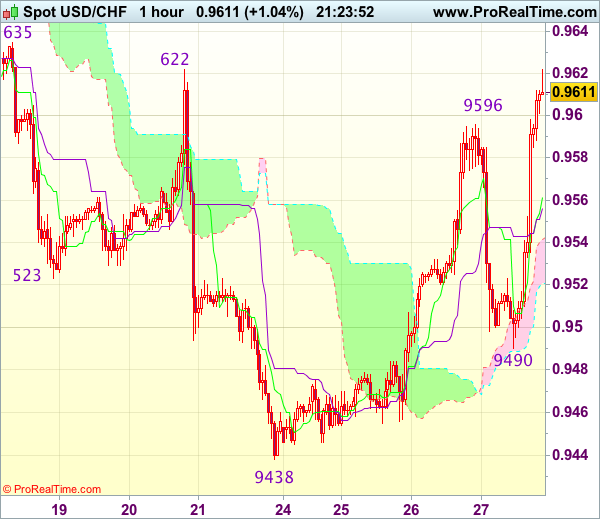
Trade Idea Update: USD/CHF – Stand aside
USD/CHF - 0.9503
Original strategy :
Sold at 0.9570, stopped at break-even
Position : - Short at 0.9570
Target : -
Stop : - 0.9570
New strategy :
Stand aside
Position : -
Target : -
Stop : -
Although the greenback slipped to 0.9490 earlier today, renewed buying interest emerged and dollar has rallied from there, dampening our bearishness and suggesting a test of resistance at 0.9622 would be seen, however, break there is needed to confirm a temporary low has been formed at 0.9438, bring retracement of recent decline to 0.9655-60 but price should falter well below resistance at 0.9701.
In view of this, would not chase this rise here and would be prudent to stand aside in the meantime. Below 0.9580 would bring test of the Kijun-Sen (now at 0.9556) but break there is needed to signal an intra-day top is formed, bring weakness to the lower Kumo (now at 0.9521) but said support at 0.9490 should remain intact.
GBPUSD: Risk Points Higher On Trend Resumption
GBPUSD: The pair continues to retain its upside threats though with caution. Support lies at the 1.3100 level where a break will turn attention to the 1.3050 level. Further down, support lies at the 1.3000 level. Below here will set the stage for more weakness towards the 1.2950 level. Conversely, resistance stands at the 1.3200 levels with a turn above here allowing more strength to build up towards the 1.3250 level. Further out, resistance resides at the 1.3300 level followed by the 1.3350 level. On the whole, GBPUSD continues to face upside risk though with caution.
NZD/USD is this a Valid Breakout?
NZD/USD touched new highs today, has climbed as much as 0.7557 level, much above the 0.7528 yesterday's high, but failed to stay there and now is challenging the third warning line (WL3). Only a valid breakout above this line will confirm a further increase in the upcoming period, we may have a buying opportunity if will close above the WL3 and if will come back to retest the 0.7484 level. A selling opportunity will appear if will slip and will stabilize below the 0.7484 static support.
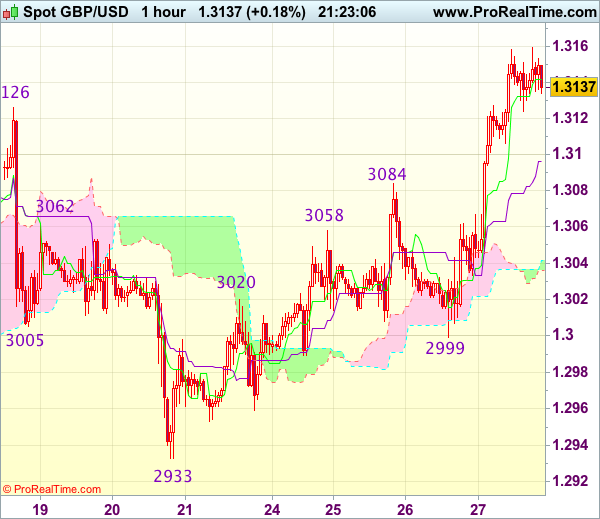
Trade Idea Update: GBP/USD – Buy at 1.3085
GBP/USD - 1.3133
Original strategy :
Buy at 1.3085, Target: 1.3185, Stop: 1.3050
Position : -
Target : -
Stop : -
New strategy :
Buy at 1.3085, Target: 1.3185, Stop: 1.3050
Position : -
Target : -
Stop : -
Cable found decent demand just below 1.3000 level and has rallied on back of dollar’s broad-based selloff, signal recent upmove is still in progress and upside bias is seen for further gain to 1.3160, then 1.3185-90, however, near term overbought condition should prevent sharp move beyond 1.3210-20 and price should falter below 1.3240-50, risk from there is seen for a retreat later.
In view of this, would not chase this rise here and we are looking to buy sterling on subsequent pullback as previous resistance at 1.3084 should turn into support and contain cable’s downside, bring another rise. Below 1.3050 would risk weakness to 1.3030-35 but break of latter level is needed to signal top is formed, then correction to 1.2999 support would follow.