Sample Category Title
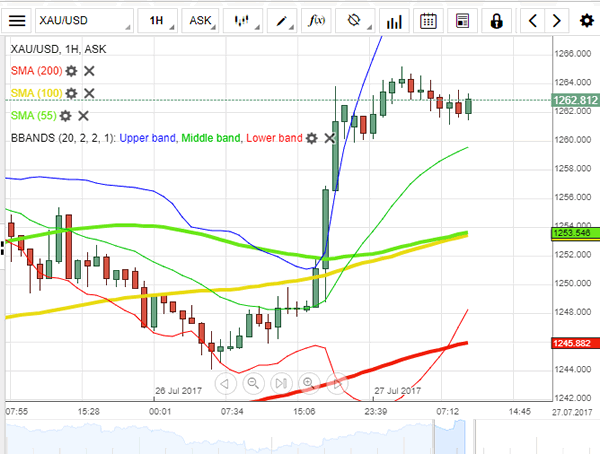
XAU/USD Analysis: Propelled Higher By Fed
Most patterns and technical analysis in general has become obsolete on the XAU/USD chart. As the FOMC Statement was released, the US Dollar fell all across the trading board. In regards to the price of the yellow metal, the commodity price jumped from levels below the 1,250 mark and reached above the 1,264 level. Although a surge was previously expected, such sharp jump was not expected. Due to the changes in the fundamental situation first a consolidation period will begin, which means that the metal's price might decline by the end of Thursday's trading session. Afterwards the Dukascopy Research team will do a full review of the technical situation on the metal's charts.
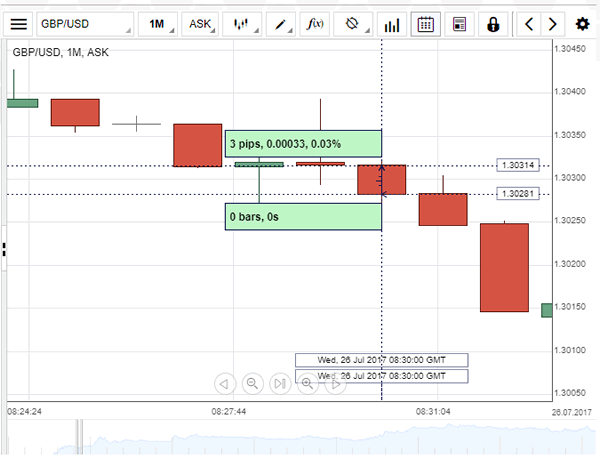
GBP/USD: UK Prelim GDP Q/Q
Wednesday's preliminary estimate of the UK's gross domestic product for the second quarter matched analysts' estimates, but signalled that the expansion lost some momentum from the previous year. This reflected in the instant fall of the GDP/USD exchange rate, which was seen trading at 1.3028 just after the data were published. The Office for National Statistics reported that Britain's GDP rose 0.3% in the June quarter as anticipated, while the yearly growth slowed from 2% to 1.7% in the same period. The UK services sector, which makes up the largest part of the economy, remained the main contributor to the growth, offsetting weakness in manufacturing and construction.
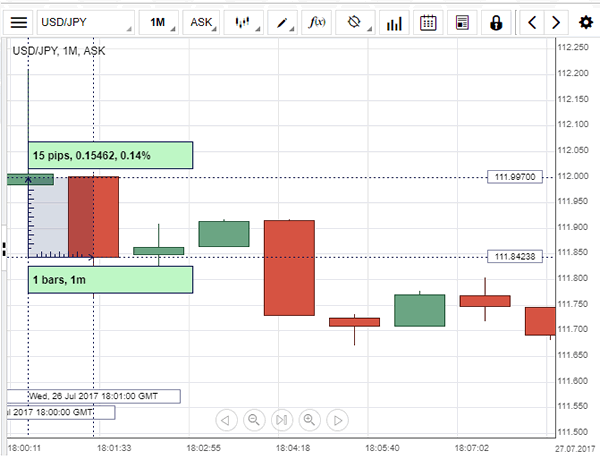
USD/JPY: FOMC Statement
Following the release of the FOMC statement, the US Dollar lost ground against the Japanese Yen, sending the currency pair to the 111.84 area from earlier highs of above 112.0. As it was widely expected by the market, the Federal Reserve decided to leave its interest rates unchanged, keeping the target range for the federal funds rate between 1.00% and 1.25%. However, the FOMC appeared to be once again concerned over inflation, saying that, overall, inflation has declined and is running below the Fed's 2% target. Furthermore, due to a lack of hawkishness of the statement and no clear hints on how the process of the balance sheet shrinkage will evolve, the market sentiment regarding the US economic outlook remained relatively subdued.
Earnings Dominate And US Stocks Eye More Record Highs
- Earnings filling the void left by Trump's failures;
- USD softer as Fed inflation concerns grow;
- GBPUSD trades at 10-month high on USD weakness.
US futures are pointing to a stronger open on Thursday, with the NASDAQ seen leading the way boosted by earnings from Facebook as we await results from a number of other companies on what is likely to be one of the biggest days of earnings reports this year.
Earnings season has arguably taken on additional importance this quarter due to the inability of Donald Trump to, so far, deliver on the growth agenda that won him the White House back in November. While US Treasury yields have come off their post-election highs and the dollar has fallen to a more-than one year low, the three major stock indices – which are up around 20% since early November – continue to trade at record highs.
Even in the absence of tax cuts and fiscal stimulus, corporate America has continued to perform well as is once again evident in this seasons results, with companies exceeding expectations on both the top and bottom line. With so many companies reporting today – 73 of those on the S&P 500 – a continuation of this performance could see more record highs being registered in the US, even as investors continue to question whether there remains value in the country compared to other areas such as Europe.
The US dollar is under pressure again on Thursday after the FOMC statement on Wednesday failed to convince traders that the pace of tightening won't slow in the years ahead. While the Fed did suggest that the unwinding of its balance sheet will begin relatively soon, it also repeatedly referred to inflation running below target, a concern that has been highlighted by policy makers in recent months. With traders already not convinced that we'll see another rate hike this year, these statements don't do anything to change that.
The pound hit a new 10-month high against the dollar, aided by the weakness in the greenback and a break through 1.31 which had previously been a strong resistance zone. While gains today have been more moderate, the break could be quite a bullish signal for the pair and see it possibly heading back towards last summer's levels of 1.35 in the months ahead. The move has also seen the pound make gains against the euro and yen, although the former still appears to be very much in the driving seat at the moment.
Earnings aside, we'll get some data from the US today with durable goods orders and jobless claims being released. The more closely watched core durable goods orders number can be quite volatile from month to month but the last few have disappointed and it will be interesting to see whether this trend can be broken today.
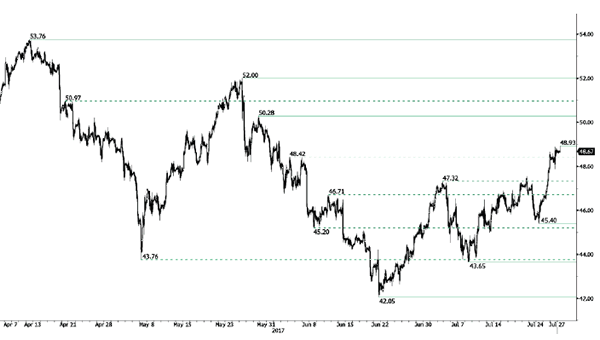
CRUDE OIL Strong Bullish Momentum
Crude Oil is trading higher Hourly support is given at 45.40 (24/07/2017 low). Strong resistance given at 50.28 (29/05/2017). Expected to show further bearish consolidation before another leg higher.
In the long-term, crude oil has recovered after its sharp decline last year. However, we consider that further weakness are very likely. Strong support lies at 35.24 (05/04/2016) while resistance can now be found at 55.24 (03/01/2017 high).
SILVER Renewed Bullish Pressures
Silver is pushing higher after the bounce from hourly support given at 15.18 (10/07/2017 low). Key resistance is given at a distance at 17.75 (06/06/2017 high). The commodity continues its short-term bullish increase.
In the long-term, the death cross indicates that further downsides are very likely. Resistance is located at 25.11 (28/08/2013 high). Strong support can be found at 11.75 (20/04/2009).

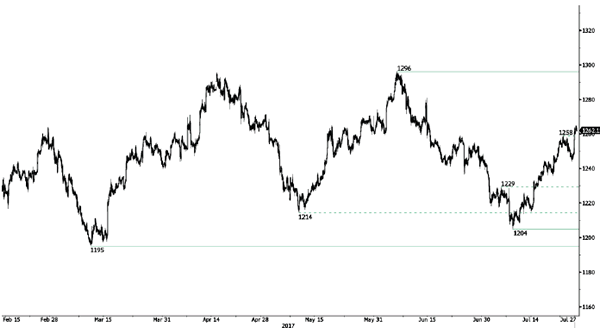
GOLD Bullish
Gold continues to grow. Strong support is given at 1204 10/07/2017 high). Hourly resistance at 1258 (23/06/2017 high) has been broken. Expected to show continued strengthening.
In the long-term, the technical structure suggests that there is a growing upside momentum. A break of 1392 (17/03/2014) is necessary ton confirm it, A major support can be found at 1045 (05/02/2010 low)
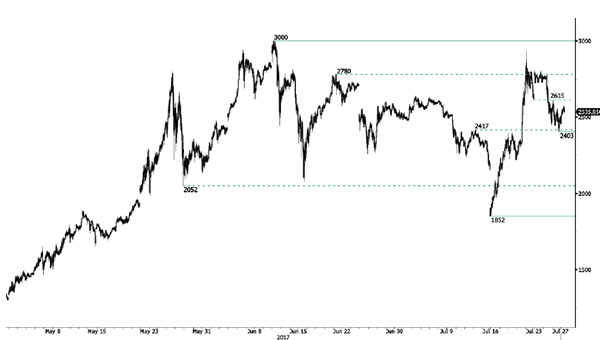
BITCOIN Consolidating Around $2500
Bitcoin's volatility has declined. Strong resistance can be found at 3000 (12/06/2017 high) and hourly support lies at 2403 (26/07/2017 low). Further retracement are expected.
In the long-term, the digital currency has had an exponential growth. There are decent likelihood that the asset will consolidate above $1500. Long-term support is given at $1464 (04/05/2017 low).
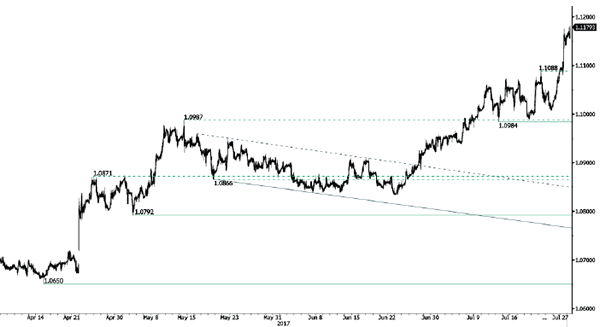
EUR/CHF Reaching 1.1200
EUR/CHF is still trading above psychological level at 1.1000 and the pair is headong towards 1.1200. Selling pressures will likely grow around those levels. Hourly support is located at a distance at 1.0984 (13/07/2017 low). Expected to inch higher.
In the longer term, the technical structure is mixed. Resistance can be found at 1.1200 (04/02/2015 high). Yet,the ECB's QE programme is likely to cause persistent selling pressures on the euro, which should weigh on EUR/CHF. Supports can be found at 1.0184 (28/01/2015 low) and 1.0082 (27/01/2015 low).
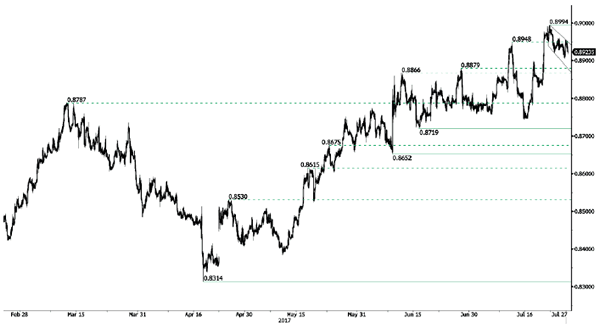
EUR/GBP Weakening
EUR/GBP is very volatile. The pair is consolidating lower. Hourly support is given at a distance at 0.8742 (16/06/2017 low). Downside risks are important.
In the long-term, the pair has largely recovered from recent lows in 2015. The technical structure suggests a growing upside momentum. The pair is trading above from its 200 DMA. Strong resistance can be found at 0.9500 psychological level.