
Sample Category Title
Gold Bullish Bias, Hits 1½-Month High
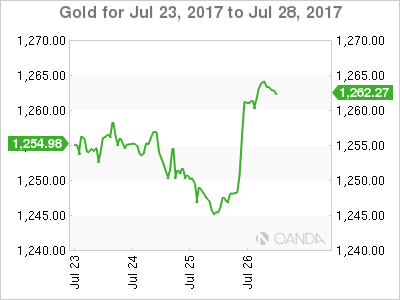
Gold has been advancing it today's trading, hitting a near one-and-a-half-month high of 1264.79.
The RSI is comfortably in bullish territory at 63 and keeps heading higher, indicating that momentum in the very short-term is positive. The overall bias is also to the upside as the MACD is positive and above the red signal line.
If the price continues climbing, the area around the 1270 handle, a rather congested one in the recent past, could provide resistance. Further up, the June 6 eight-and-a-half-month high of 1295.97 would be eyed for additional resistance.
On the downside, the area around the 1255 handle and current level of the 50-day moving average (MA) at 1250.13 could offer support. The region around 1255 has also been a congested one recently. Further declines would shift the focus to the 200-day MA at 1230.05 for additional support.
Regarding the medium-term outlook, given the considerable sideways movement over the last number of months, it looks predominantly neutral though with a bullish tilt after the recent crossing of the price above both the 50- and 200-day MAs.
Overall, the precious metal looks bullish in the short-term and mostly neutral in the medium-term.
Fed’s Inflation Concern Weakens Dollar, Aussie, Kiwi At Two-Year High
It was a relatively quiet data day in forex markets prompting traders to dwell over yesterday's events, namely the Federal Open Market Committee (FOMC) meeting. As a result of the Federal Reserve's dovish tone, the weakness in the US dollar unfolded, with the dollar index hitting a fresh 13-month low. The Australian and New Zealand dollars jumped to two-year highs as traders sold off the greenback.
The Fed confirmed market anticipations of the federal funds rate remaining at the same target range of 1%-1.25% last night. Also, investors got a nod from the FOMC meeting on the reduction of the Fed's balance sheet that will start “relatively soon”. However, the change in the US central bank's tone on inflation, specifically expressing less confidence on the recent weakness in inflation being just temporary, induced a sell-off in the dollar. Dollar/yen slipped below the 111 level during Asian trading but managed to slightly recover to just above the 111 mark as European traders were starting the day. Later in the day, markets will be monitoring monthly orders of durable goods in June, which could impact the dollar significantly.
The Australian and New Zealand dollars hit a two-year high against their US counterpart with the aussie last trading at $0.8039 and the kiwi at $0.7536. The surge in the aussie comes after the currency initially plunged against the greenback on softer than expected inflation data yesterday morning.
The euro continued yesterday's rally on the back of the soft dollar, hitting a fresh high of $1.1776, a position it last held in January 2015. As the Asian session was about to close, the euro retraced some of its earlier gains and was last broadly flat at 1.1730. At 10.8, the Gfk German Consumer Climate index came in above expectations and the prior month's value of 10.6. The euro rose on the news, however the gains didn't last long as the single currency fell soon after.
Sterling continued strengthening against the dollar, with pound/dollar last trading at 1.3141 as the European session was about to start. The uptrend in the pair came despite strong dissatisfaction among Britain's car producers, as they start to feel the strains of Brexit. The number of cars made in the UK in June fell by almost 14% year-on-year to 136,901. Car manufacturers are seeking more clarity from the UK government on its plans for the sector once the country departs the EU. More than half of the cars exported from the UK go to the EU, while domestic demand for cars has weakened in the first half of the year.
Oil prices rose supported by news that US stockpiles decreased more than expected. At 7.2 million barrels, crude oil inventories fell more than analysts' forecasts of 2.62 million barrels, the Energy Information Administration (EIA) said yesterday. WTI was last up 0.3% at $48.88 a barrel and Brent was at $51.11.
Gold continued strengthening following yesterday's jump on the softness in the US dollar. The precious metal was last trading at $1,261.36 an ounce.
Foreign Exchange Market Commentary: EUR/USD, USD/JPY, GBP/USD, GOLD, WTI CRUDE, DJIA, FTSE100, DAX
EUR/USD
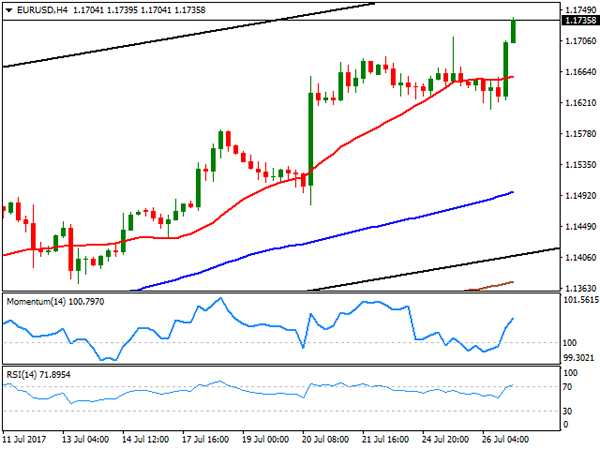
The EUR/USD pair traded uneventfully around the 1.1640 level, and after falling down to 1.1612, its lowest for the week, but resumed its advance breaking higher and settling at its highest since January 2015, in the 1.1730 region, following the US Federal Reserve monetary policy meeting. The Central Bank failed to surprise investors, keeping rates unchanged, as largely expected and barely changing the wording on the statement, particularly when it comes to reducing the $4.5 billion balance sheet, saying that it will start "relatively soon," and the market understanding it as September. As for inflation, policy makers still believe that it will “stabilize around the Committee’s 2% objective over the medium term," while the labor market has continued to strengthen. With no signs of accelerating its tightening pace, the market resumed dollar's selling, with the greenback now trading near its recent multi-month lows against most of its major rivals.
As for the EUR/USD pair technical outlook, the price has regained ground above its 20 SMA in the 4 hours chart, whilst technical indicators turned sharply higher, maintaining their upward slopes within positive territory, and supporting further gains ahead on a break above the 1.1710 price zone, where the pair topped this week and back in 2015. Beyond the level, the rally could extend up to the 1.1800 price zone, where the pair has its 200 SMA in the weekly chart, and the top of the daily ascendant channel coming from mid-April with little in the way. A reversal in the ongoing bullish trend has become more unlikely, but intraday downward corrective movements can't be disregarded. Still, the pair will remain bullish even in the case of a decline down to 1.1580.
Support levels: 1.1690 1.1650 1.1615
Resistance levels 1.1745 1.1790 1.1840
USD/JPY
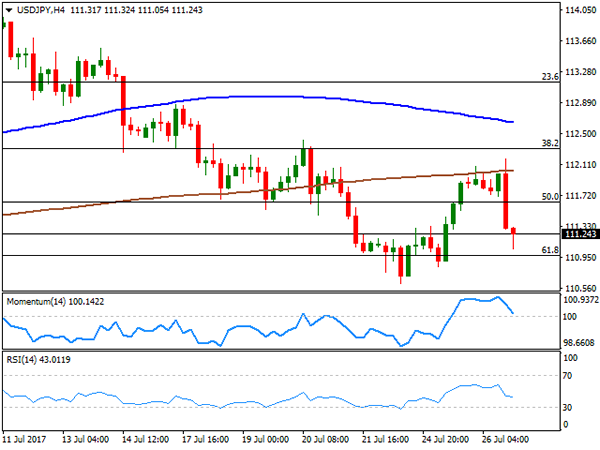
The USD/JPY pair fell down to 111.05, down after flirting with levels above 112.00 ahead of Fed's statement. As the US Central Bank failed to surprise, market players resumed dollar's selling, with Treasury yields coming back under pressure. By the end of the US session, the yield on the benchmark 10-year Treasury note slipped to 2.28% from previous 2.33%, while the yield on the 30-year Treasury bond was down to 2.90% from 2.91%. The Japanese calendar had little to offer on Wednesday, and will remain light this Thursday, which means that the pair will keep taking clues from yields and stocks. The decline is being limited by Wall Street's gains, but the risk is clearly towards the downside, although an extension below 110.90 is required to confirm so. The 4 hours chart shows that the pair faltered around its 200 SMA, while the 100 SMA turned modestly lower above the largest, and technical indicators head sharply lower, with the RSI indicator already at 42, supporting the bearish case.
Support levels: 110.90 110.60 110.25
Resistance levels: 111.60 112.00 112.45
GBP/USD
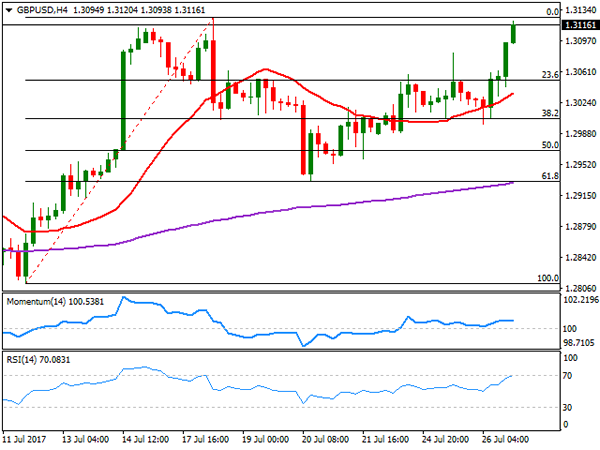
The GBP/USD pair settles above the 1.3100, its highest for the week, compliments to a neutral Fed monetary policy statement. The pair recovered from a daily low of 1.2998, achieved early London. UK data released this Wednesday failed to boost the Pound as the preliminary Q2 GDP figures were soft, as expected. The kingdom is estimated to have grew by 0.3% in the three months to June, with the annual rate resulting then at 1.7%. While the figures were in-line with market's forecast, were also supportive of the current on-hold stance of the BOE, cooling further hopes for a rate hike in the UK. After the release, Finance Minister Hammond, said that while the UK can be proud of the continued growth seen over the past four years, they now need to focus on "restoring productivity growth to deliver higher wages and living standards for people across the country." Anyway, gains came as usual on the back of dollar's broad weakness, with the pair now poised to challenge its yearly high, set this July at 1.3125. The 4 hours chart shows that the price has accelerated above a now bullish 20 SMA, whilst the RSI indicator advances around 69, although the Momentum indicator remains flat within positive territory, all of which supports some further gains ahead. A break above the mentioned yearly high exposes the 1.3180 price zone, where the pair has multiple daily highs and lows from August/September 2016.
Support levels: 1.3090 1.3050 1.3010
Resistance levels: 1.3125 1.3180 1.3230
GOLD
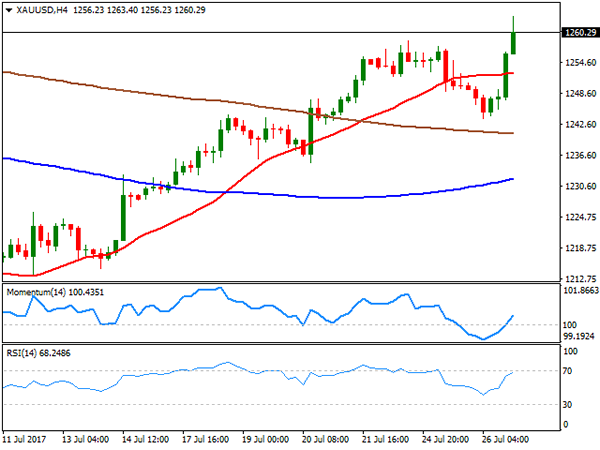
Gold prices rallied to settle at their highest in over a month, with spot ending the day at $1,266.20 a troy ounce after trading as high as 1,263.40. The commodity slipped at the beginning of the day amid a cautious stance among investors, and continued demand for high yielding assets, but turned north after the US Central Bank gave relief to dollar bears. Odds for another rate hike this year diminished after this meeting, now closer to 35%, backing the case for further gold gains. The commodity has regained the bullish stance after some consolidation earlier on the week, as the daily chart shows that the price settled above its 100 DMA, while technical indicators resumed their advances, and stand at fresh monthly highs with strong upward slopes. In the shorter term, and according to the 4 hours chart, the bright metal is also biased higher, as technical indicators re-entered positive territory, heading higher early Asian session, and with the price back above all of its moving averages.
Support levels: 1,258.80 1,245.20 1,236.30
Resistance levels: 1,266.60 1,274.10 1,283.30
WTI CRUDE OIL
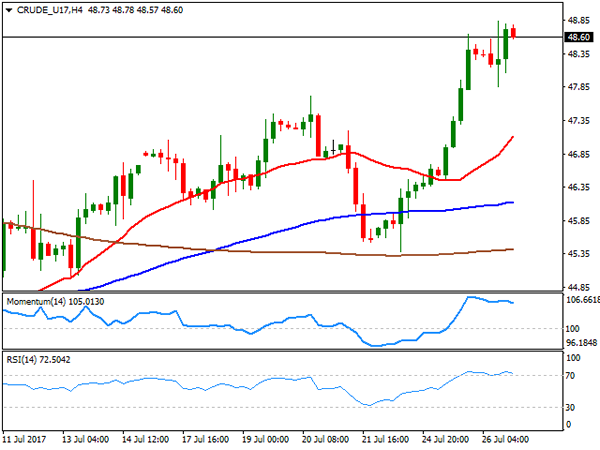
Crude oil prices extended their recent rallies on the back of fresh market news, with West Texas Intermediate futures up to $48.84 a barrel intraday, its highest since early June, after the EIA weekly report showed a surprise draw-down in US stocks. According to the report, domestic crude supplies fell by 7.2 million barrels for the week ended July 21, well beyond the 2.6 million barrels' decline expected. WTI closed the day barely below that high at 48.60, maintaining the positive tone according to technical readings, as in the daily chart, the price bounced from its 100 DMA, now a strong dynamic support at 47.86, whilst technical indicators have lost upward strength near overbought levels, but are far from indicating a downward move ahead. In the 4 hours chart, technical indicators are currently consolidating within overbought readings, whilst the price stands far above all of its moving averages. Unless the market offers a negative surprise, WTI can extend up to the 50.00 level during the upcoming sessions, but gains beyond this last are still seen limited.
Support levels: 47.84 47.20 46.60
Resistance levels: 48.80 49.50 50.10
DJIA
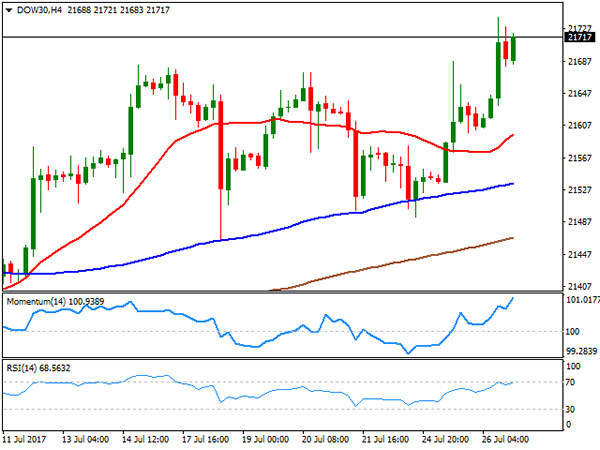
Wall Street had a stellar performance this Wednesday with the three major indexes closing at all-time highs. The Dow Jones Industrial Average added 97 points, and settled at 21,711.01, while the Nasdaq Composite gained 0.16%, to 6,442.75. The S&P was up barely 0.03%, to close at 2,477.83. US stocks rallied ahead of the opening, on the back of strong earnings, retreating ahead of the Fed, but resuming their advances afterwards. Boeing was the best performer within the Dow, up 9.91%, after reporting per-share earnings of $2.89, well above market's consensus of $2.58. Nike led decliners with a 1.77% loss, followed by McDonald's that shed 1.63%. The daily chart maintains the bullish stance seen on previous updates, with technical indicators extending their advances within positive territory and the benchmark further above bullish moving averages. In the 4 hours chart, the Momentum indicator heads north almost vertically within overbought territory, the RSI also aims higher around 66, whilst the 20 SMA gained upward strength far below the current level, supporting additional gains for this Thursday.
Support levels: 21,681 21,649 21,598
Resistance levels: 21,741 21,785 21,830
FTSE100
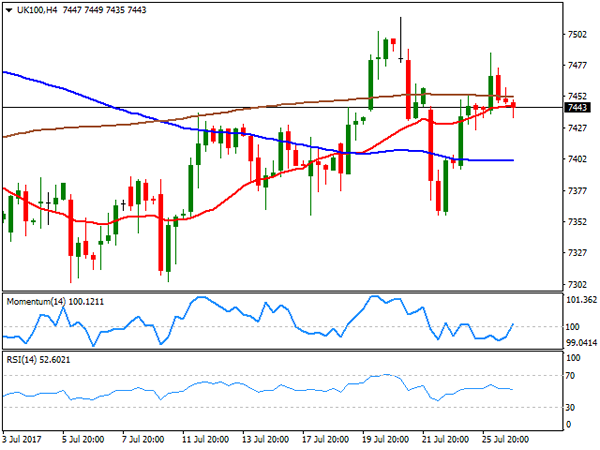
The Footsie closed the day in the green at 7,452.32, up 17 points, amid gains in the mining sector, also up after ITV raised its dividend saying its 16% fall in first-half pretax profit was in line with its expectations. The share led advancers with a 2.44% gain, while Anglo American added 2.01%. Paddy Power Betfair was the worst performer, ending the day down 2.95%, followed by Glaxo Smith that shed 2.55%. Pound's strength after London's close pressure the index in electronic trading, now around 7,440 and with the daily chart showing that it retains its positive tone, as it still stands above its 20 and 100 DMAs, both converging around 7,385, whilst the Momentum indicator continues heading higher above its 100 level. The RSI indicator in the mentioned time frame is, however, anticipating a probable bearish extension, having turned flat around 52. In the 4 hours chart, the index struggles around its 20 SMA and below the 200 SMA, while technical indicators lack directional strength, hovering around their mid-lines, and in line with the longer term view.
Support levels: 7,485 7,435 7,390
Resistance levels: 7,482 7,518 7,561
DAX
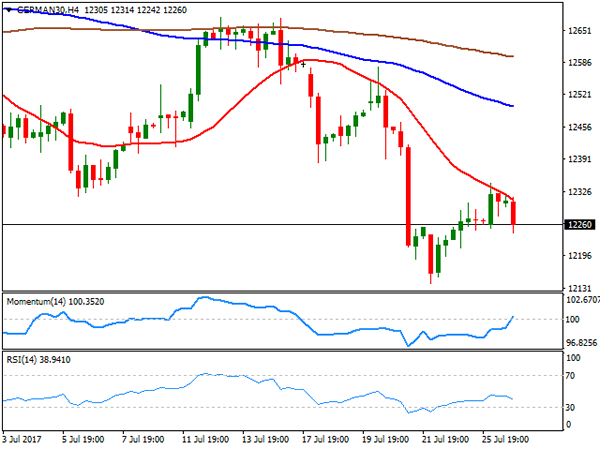
European equities closed higher this Wednesday, with the German DAX adding 41 points to 12,305.11, as banks remained buoyed, although the advance was moderate ahead of the Fed's monetary policy meeting outcome. Within the German benchmark, Commerzbank was the best performer, adding 2.61%, followed by Volkswagen that gained 1.81%. On the negative side, Merck was the worst performer, ending the day 3.30% lower, followed by Daimler that shed 1.22%. The index fell in after-hours trading, following EUR soaring to fresh 2-year highs, now hovering around 12,260 and with the daily chart showing that the index remains below its 20 and 100 DMAs, with the shortest gaining downward strength around the largest, and ready to break higher, and technical indicators hovering within negative territory, with limited upward momentum, maintaining the risk towards the downside. In the 4 hours chart, a bearish 20 SMA capped the upside, while the Momentum aims higher around 100, but the RSI indicator turned south, currently around 39, supporting a bearish extension ahead.
Support levels: 12,234 12,190 12,153
Resistance levels: 12,303 12,354 12,398
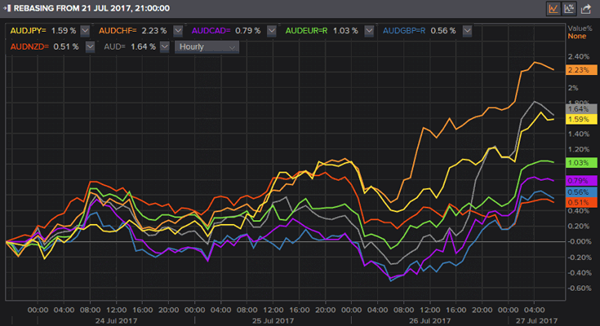
AUD Crosses Break High In Tandem Whilst ASX Remains Stuck In Mud
Only the Swiss Franc has underperformed the USD in relation to AUD this week the 1.9% positive carry takes it to new heights. Whilst ASX continues to frustrate, we lean slightly towards an eventual downside break out of range.
We highlighted this potential trade yesterday and, whilst the downside has indeed begun, thought it worthy of putting it back on your radars as there may be other opportunities to join in. The resistance zone around 1.65 to the monthly S1 perfectly capped yesterday's high and presented a shooting star candle. For those that took the break of yesterday's low or used a sell-limit below 1.65, you're likely in the trade assuming you have not been stopped out. Had the stop been above the monthly S1 then we assume you're still in.
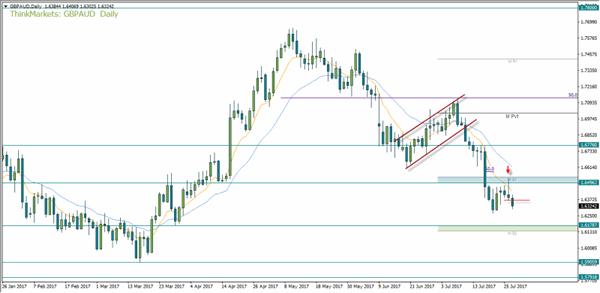
Yesterday's is likely a resistance level which could be used to aid with sell-limit placement. Ideally the stop would be above this level and closer towards 1.65. As the shooting star respected the 8eMA we favour a shallow pullback before the decline continues. The target is around the 1.618 / monthly S1, although we prefer to exit or scale out somewhere above this level.
Sentiment on AUD is annoying bullish (to the RBA) and as AUD is outperforming Sterling, GBPAUD is one of your preferred shorts.
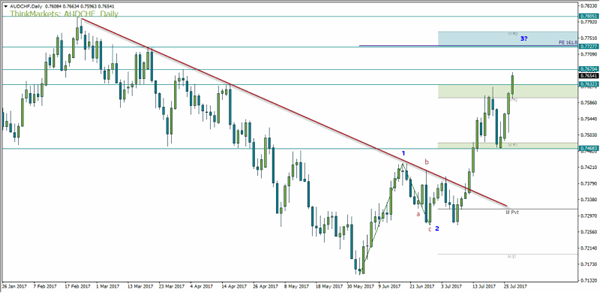
AUDCHF continues to climb higher as AUD takes advantage of the low yielders. Currently on its 5th bullish session we think the move may eventually makes its way up to 0.7727. This area houses the 161.8% projection and March high which may provide an ending for wave 3. As the supposed wave 1-2 was around 50%, it's possible that wave 4 may be shallow (83.2% or higher). Either way momentum favours the bulls and intraday longs are the preferred choice under the current sentiment. If we are to see the rally cool then today's low sits on the monthly R2 which makes it viable support or an area to aid with stop placement.
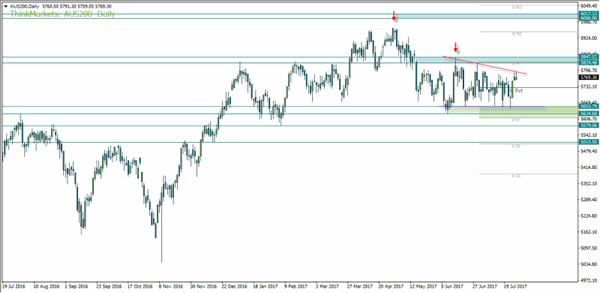
The ASX200 continues to frustrate and has spent the best part of June and July between 5650-5825. The multiple spikes lower which respected 5653.80 initially suggest solid support, yet the lower highs suggest bears have a slight edge which makes the potential for an eventual downside break. Moreover, the June high forms a lower high which failed to test the psychological number of 6000. Therefor our bias is for an eventual downside break.
We really want to see a break below 5625 although a close beneath 5653 could tip us off to such a move. If the bulls are to regain control we would require a break of the red trendline before considering long positions yet, even then, a break of 5825 would be preferred for added confirmation.
AUD On A Tear To RBA’s Despair, 83.40 In Focus
The haevy losses of the USD have undone any efforts from RBA to cap gains with ease, as it breaks milestone after milestone. Technically we could now be headed for 83.40. The haevy losses of the USD have undone any efforts from RBA to cap gains with ease, as it breaks milestone after milestone. Technically we could now be headed for 83.40.
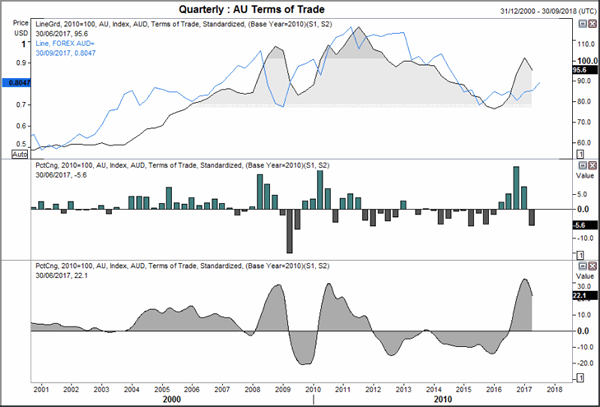
Australia's terms of trade, a measure of export price competitiveness, declined by -5.6% in Q2 to erode some of the 7.6% increase in Q1. This breaks a 4-quarter streak of gains which helped the annual rate move as high as 32.4% in Q1, which has now edged lower to 22.1% YoY.
Export prices were the main culprit as they declined -5.7% QoQ versus +9.4% previously. Imports only declined -0.1% QoQ following a +1.2% gain in Q1. This now brings exports down to 22.5% YoY versus 31.7% previously.
The correlation with the raw terms of trade index compared with the Australian Dollar is strong over the longer-term. They don't always match up in terms of gains on a quarterly basis but the trend is resected. Even with Q2's decline, one could argue that AUD remains below fair value in relation to the terms of trade. If so, then it is another reason the RVA are to be concerned with a rising AUD.
We previously showed the long-term chart for AUD inverted to show the bigger picture. Once flipped upside down the topping pattern appears much clearer when price touched the original neckline. Since breaking above the neckline, the 2016, the 200 wk eMA and now 80c with apparent ease, we think there could be much more upside to come. The milestones it has cut through lie butter are usually levels one would expect to prompt more resistance. And it is this ease of upside breaks alongside the trajectory of the current leg higher which make us think this is the breakout of a large-scale macro move.
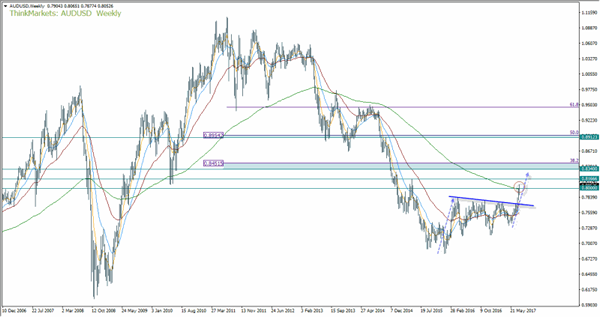
If we continue to follow the momentum path of the original leg higher from the 2015 lows, AUD could be headed straight for 0.834. It may find resistance around 0.8466 (2014 high) but we expect it to remain above 80 unless USD can make a quick recovery. If 0.834 is broken then 0.8450 is a viable area for a correction as it marks the 38.2% retracement form the 2015 low to 2011 high.
And this is where the RBA have real issues as they want their currency lower, not higher. We saw the reaction Guy Debelle provided below 80c and we doubt he has changed his mind since. Therefor we must seriously consider the potential for the RBA to cut once more despite fears of further stoking the fire for hot property prices.
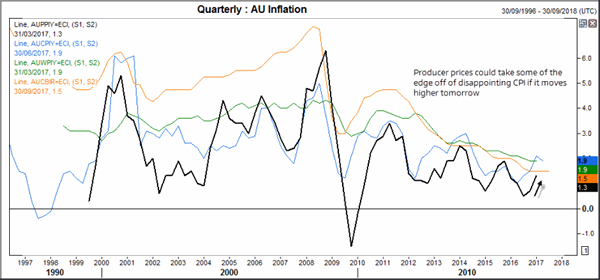
Producer prices will be in focus tomorrow to see if they can throw some support under this week's CPI set. We doubt it will have much of an impact on AUD in the grand scheme of thigs because that is simply hurtling higher due to a great macro unwind of the US Dollar.
EUR/GBP Elliott Wave Analysis
EUR/GBP – 0.8925
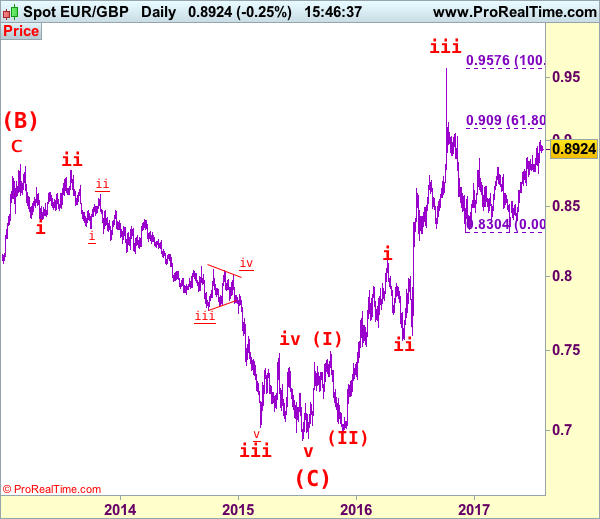
EUR/GBP – The major (A)(B)(C)-(X)-(A)(B)(C) correction from 0.9805 is unfolding and 2nd (A) has possibly ended at 0.6936.
As the single currency found renewed buying interest at 0.8743 earlier this month and has surged again, breaking above previous resistance at 0.8950, adding credence to our bullish view that recent rise from 0.8304 (Dec 2016) is still in progress and upside bias remains for further gain to psychological resistance at 0.9000, break there would encourage for headway to 0.9090 (61.8% Fibonacci retracement of 0.9576-0.8304), having said that, break of previous resistance at 0.9142 is needed to signal the retreat from 0.9576 top (2016 high) has ended at 0.8304, bring headway to 0.9200-10 first.
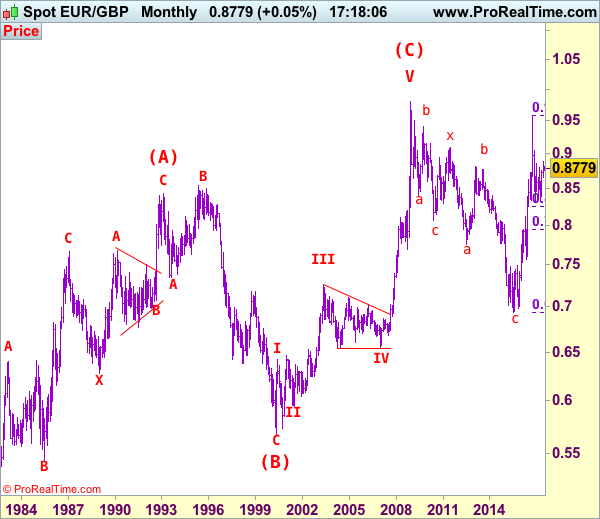
Our latest preferred count is that the wave V of a 5-wave series from 0.5682 ended at 0.9805 earlier and major from there has possibly ended at 0.8067 as A-B-C-X-A-B-C. We are keeping our view that the entire correction from 0.9805 has possibly ended at 0.7756 and as labeled as the attached daily chart and impulsive move from 0.9084 has ended at 0.7756 as a 5-waver which marked either the (C) wave or the A leg of (C), a daily close above resistance at 0.8831 would suggest (C) leg has ended and headway towards 0.9084.
On the downside, whilst initial pullback to 0.8845-50 cannot be rule out, reckon 0.8825-30 would limit downside and bring another rise later. A daily close below 0.8780-85 would defer and suggest a temporary top is possibly formed, bring test of support at 0.9743 but break there is needed to add credence to this view, bring retracement of recent upmove to 0.8700, then towards previous support at 0.8652 which is likely to hold from here.
Recommendation: Buy at 0.8830 for 0.9030 with stop below 0.8730
Euro's long term uptrend started in Feb 1981 at 0.5039 and is unfolding as a (A)-(B)-(C) move with (A): 0.8433 (Feb 1993), (B): 0.5682 (May 2000) and impulsive wave (C) should have ended at 0.9805 with wave III ended at 0.7254 (May 2003), triangle wave IV at 0.6536 (23 Jan 2007) and wave V as well as wave (C) has ended at 0.9805.
We are keeping an alternate count that only wave III ended at 0.9805 and the correction from there is the wave IV and may extend weakness to 0.7700, however, it is necessary to see a daily close above resistance at 0.9143 would change this to be the preferred count.
FOMC Deflates Dollar Inflates Oil And Gold
A dovish FOMC keeps oil's bull run alive and boosts gold's march higher.
OIL
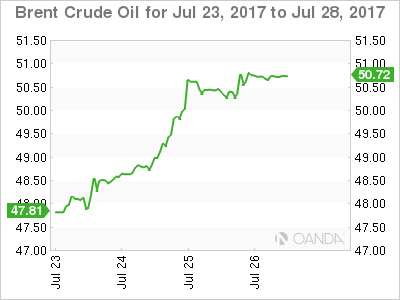
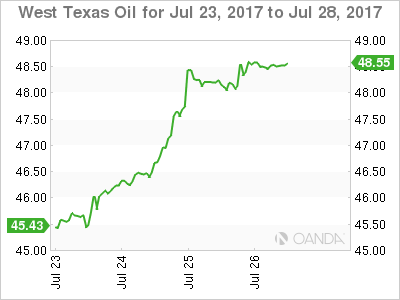
Much was made overnight of oil's positive price action but in fact it has left me somewhat underwhelmed. With the U.S. DOE Crude Inventories delivering a mighty 7.2 million drawdown against an expected 2.6 million drawdown, and following a dovish FOMC, all Brent and WTI spot could do was make back the losses they had suffered on the day to finish mostly unchanged.
In itself this should not be construed as bearish. As previously stated, more agressive cuts from Saudi Arabia and most importantly, a possibly impending bankruptcy of Venezuela, along with an increasingly clear trend of inventory drawdowns in the U.S. should be constructive for prices. Or at least hold them around the $50.00 a barrel. The fact that we could not rally on such a large drawdown overnight though, may suggest that after a mighty run higher in prices over the last week, perhaps a lot of good news is built into the price for now. This may be cause for shorter term Traders to pause for breath for now.
On a positive note, both contracts held their 100-day moving averages on the pre inventory pull back action yesterday. Although we note that the 200-day moving averages remain unchallenged on both contracts suggesting chopping price action between the two for now.
Brent spot is trading at 50.75 with the 100-day average nearly at 50.40 lending support followed by the 50.00 level. Resistance is at the 200-day average at 51.40 with the next resistance at 52.70.
WTI spot trades at 48.50 with the 100-day supporting at 47.70. The 200-day lies above at 49.15 followed by the mystical 50.00 pivot point.
GOLD
The FOMC came to gold's rescue overnight as the yellow metal unwound what was potentially a profit taking day and rose a healthy 0.90% to close in New York around 1261.00 from a 1250.00 opening. The FOMC's admission that inflation remains 'subdued' and that balance sheet unwinding with start 'soon' saw the U.S. Dollar red carded and stretchered off the pitch in both the FX and metals markets.
In addition to gold's much higher close, it also tested but held its 100-day moving average at 1249.10 before closing much higher. This is a pleasing technical development for gold bulls out there. The U.S. Senate's latest failure to repeal Obamacare and their impending Russian sanctions vote should also be enough to keep the uncertainty premium in gold percolating nicely in the back ground.
Asian demand has seen gold drift higher by three dollars to 1264.00 this morning as the FOMC fallout continues across the G-10 currency space. Supports lies at 1259.60 initially followed by the 100-day average at 1249.10. Resistance is at 1267.00 intra-day with a daily close above implying a march to the 1281.00 regions is on the cards.
USD/CAD Elliott Wave Analysis
USD/CAD – 1.2475
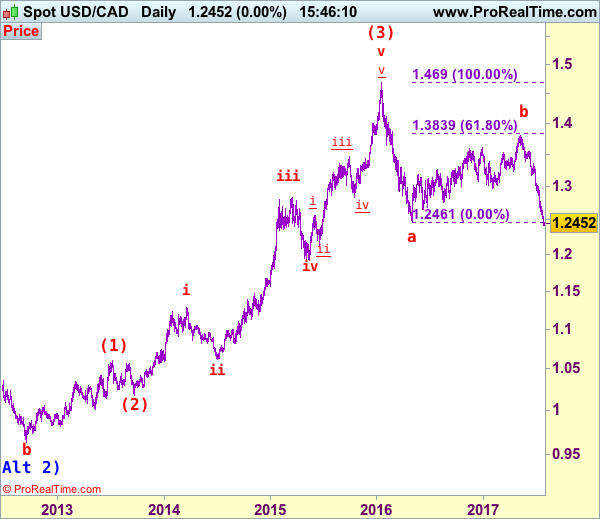
USD/CAD – Wave v ended at 0.9407 and only wave (3) of c ended at 1.4690 and one more rise cannot be ruled out.
The greenback has continued heading south after recent selloff, adding credence to our bearish count that wave b has ended at 1.3794 and wave c has commenced for a retest of wave a trough at 1.2461, break there would provide confirmation and encourage for the major fall from 1.4690 (wave (3) top) to extend further fall in wave c of (4) to 1.2390-00, then towards 1.2300, however, near term oversold condition should limit downside to 1.2200-10 and price should stay above 1.2000 level, bring rebound later.
We are keeping our view that the wave b from 1.0657 (a leg top) has possibly ended at 0.9633 with (a): 0.9800, wave (b): 1.0447 and wave c at 0.9633, the subsequent rise from there is now treated as wave c exceeded indicated upside target at 1.3770-80 and 1.4000 and wave (3) has possibly ended at 1.4690 and wave (4) correction has commenced for retracement back to 1.2832 support, then 1.2410-20.
On the daily chart, our latest preferred count remains that the A of (B) rally from 0.9059 low (7 Nov 2007) unfolded into an impulsive wave with i: 0.9059-1.0380, ii ended at 0.9819, iii at 1.3019 followed by triangle wave iv at 1.2026 , then wave v formed a top at 1.3066 and also ended the wave A. The wave B is unfolding as an double three a-b-c-x-a-b-c and is sub-divided as a: 1.2192, b: 1.2716 and wave c at 1.0784, followed by wave x at 1.1725, another set of a-b-c unfolded with 2nd a at 0.9931, 2nd b at 1.0674. the 2nd c has possibly ended at 0.9407, therefore, consolidation with upside bias is seen for major correction, indicated target at 1.3900 had been met and gain to 1.4700 would follow.
On the upside, whilst initial recovery to 1.2640-40 cannot be ruled out, reckon upside would be limited to 1.2700-05 and price should falter below resistance at 1.2771, bring another decline to aforesaid downside targets. Above previous support at 1.2859 would defer and risk a stronger rebound to resistance at 1.2944 but upside should be limited to psychological resistance at 1.3000 and price should falter well below another previous support at 1.3165 (now resistance), bring another decline later.
Recommendation: Sell at 1.2700 for 1.2400 with stop above 1.2800.
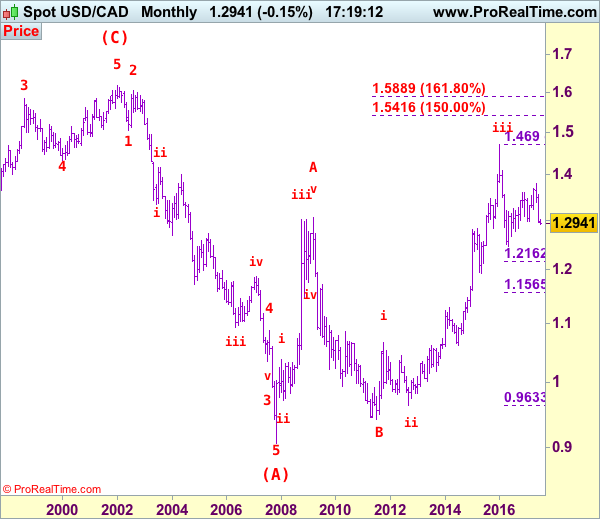
Longer term - The selloff from 1.6194 (21 Jan 2002) to 0.9059 (07 Nov 2007) is viewed as (A) wave which is a 5-waver as labeled on the monthly chart as below, the subsequently rally is labeled as (B) with impulsive A leg of (B) ended at 1.3066, wave B of (B) is unfolding which has either ended at 0.9407 or would extend one more fall but downside should be limited to 0.9200 and 0.9000 should hold.
Trade Idea: GBP/USD – Stand aside
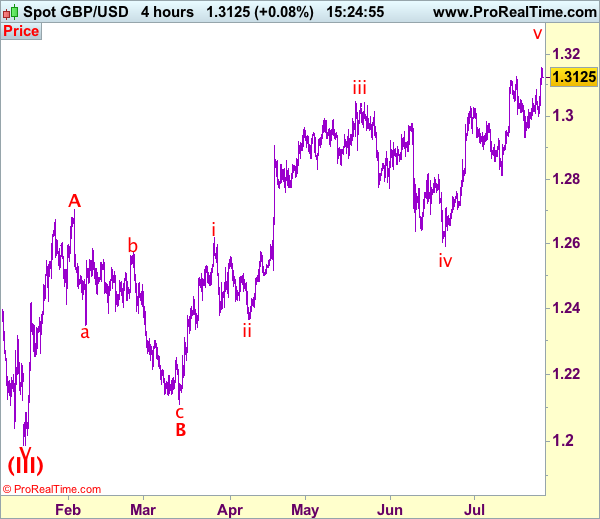
GBP/USD – 1.3143
Recent wave: Wave V of larger degree wave (III) has ended at 1.1986 and major correction has commenced from there for gain to 1.3000 and 1.3140-50
Trend: Near term up
Original strategy :
Sold at 1.3100, stopped at 1.3160
Position: - Short at 1.3100
Target: -
Stop: - 1.3160
New strategy :
Stand aside
Position: -
Target: -
Stop:-
Cable has surged again and broke above previous resistance at 1.3126, confirming recent upmove has finally resumed and upside risk remains for further gain to 1.3190-00, however, as this move is still viewed as the final wave v of larger degree wave C, reckon upside would be limited to 1.3240-50 and price should falter below 1.3300-10, then sterling shall retreat sharply from there.
Our preferred count on the daily chart is that cable's rebound from 1.3500 (wave (A) trough) is unfolding as a wave (B) with A ended at 1.7043, followed by triangle wave B and wave C as well as wave (B) has ended at 1.7192, the subsequent selloff is the larger degree wave (C) which is still unfolding with minor wave (III) of larger degree wave 3 ended at 1.1986, hence wave (IV) correction is in progress which could either be a triangle wave (IV) of a complex formation but upside should be limited to 1.3500 and price should falter well below 1.4000, bring another decline in wave (V) of 3 for weakness to 1.1500, then 1.1200.
On the downside, whilst pullback to 1.3090-00 cannot be ruled out, below 1.3060-65 is needed to signal a temporary top is possibly formed, bring weakness to 1.3030 but break of support at 1.2999 is needed to provide confirmation, bring retracement of recent rise to 1.2980, then 1.2950-55 but previous support at 1.2933 should hold from here.
Currencies: Dollar Hammered Even As Fed Maintains Its Policy Guidance
Sunrise Market Commentary
- Rates: Very important session – Follow through or not?
The US Note future gained ground yesterday on the subtlest of changes in the FOMC statement even if it keeps the Fed on track to announce the start of a BS run-off in September and to hike rates in December. If the US Note future can't build on yesterday's momentum, it suggests that there's little wiliness to attack the topside. - Currencies: Dollar hammered even as Fed maintains its policy guidance
Yesterday, the Fed took notice of inflation dropping below 2%, but didn't change its policy guidance. Still, the dollar was hammered across the board. The EUR/USD 1.1735 resistance is under heavy strain. The dollar desperately needs good news. For now, it isn't available.
The Sunrise Headlines
- The S&P 500, Dow Jones and Nasdaq closed at record highs following a day of strong corporate earnings. Most Asian stock markets trade positive despite dollar weakness. Strong Facebook/Samsung earnings boosted risk sentiment.
- The Fed kept policy unchanged, but the central bank said that it expects to begin shrinking its balance sheet “relatively soon”, using a phrase that often has preceded action at the next policy meeting (September).
- The ECB could reduce asset purchases from the start of next year but should not completely stop bond buys, Austrian central bank governor Nowotny said, adding that policymakers need a flexible, careful plan without a pre-fixed end.
- Amber Rudd, the UK home secretary, promised business that she would not close the door to European workers after Brexit, in a significant softening of the government's tone on EU migration.
- Brazil cut the benchmark Selic rate by a full percentage point, keeping up its aggressive pace as falling prices and tepid growth outweighed concern over political instability. The move to 9.25% is the third straight 100 bps decline.
- Dissident Republicans voted down a plan to repeal Obamacare and find a replacement later, less than 24 hours after senators had rejected an alternative bill to abolish Obamacare and put a new system in place immediately.
- Today's eco calendar contains EMU M3 money supply data, US durable goods orders, weekly jobless claims and trade balance data. The US holds a 7-yr Note auction, while the earnings calendar is in full swing
Currencies: Dollar Hammered Even As Fed Maintains Its Policy Guidance
Dollar tumbles even as Fed leaves guidance unchanged
Yesterday, USD trading initially developed in wait-and-see modus ahead of the Fed policy statement. The Fed took notice that inflation dropped below 2%, but maintained its guidance on future policy and expects inflation to return to 2% in the medium term. The Fed also indicated that the normalisation of its balance sheet can start relatively soon. The changes in the Fed statement were very limited. Even so, the reaction of the dollar was violent. US yields reversed most of Tuesday's rise and the dollar was sold aggressively. EUR/USD closed the session at 1.1734, near at the key 38% LT retracement level. USD/JPY lost a full big figure and finished the day at 111.18.
Overnight, the dollar remains under pressure, but the pace of decline is less aggressive than after yesterday's Fed statement. EUR/USD trades north of the key 1.1714/35 resistance. USD/JPY slipped below 111. AUD/USD jumped above the psychological barrier of 0.80 (currently at 0.8055). Asian equities perform rather well despite the decline of the dollar.
Today, US the durable orders, the jobless claims and the trade balance will be published. Durable goods orders are expected to have sharply rebounded (3.5% M/M) in June following a 0.8% M/M decline in May. The sharp monthly rise is a transportation (Boeing) issue. Excluding the volatile transportation sector, orders are expected up 0.4% after a 0.3% M/M increase in June. Orders are difficult to forecast, but should core orders rise as expected or slightly more, it would suggest a re-acceleration of investment. Initial claims fell last week to a low 233K. Some increase is expected this week (240K). Finally, the trade deficit (goods) is expected to have narrowed slightly in June ($65.5B). The orders data might have some intraday impact on the dollar. Given current negative USD sentiment, the data probably have to be very strong to give the dollar some support. Yesterday's price action tells more about the dollar than about the Fed's assessment. The Fed only took notice of the fact that inflation has dropped below 2%. The paragraph with its assessment/guidance was completely left intact. We don't expect US yields to decline much further. However, in the current context, this might not be enough to stop the USD decline. We don't think that the current sharp USD decline is 'justified' by the fundamentals/Fed intentions. Nevertheless, the dollar was and remains a falling knife and there is no reason to try to catch it. The US currency desperately needs high profile good news and that isn't available. This good news clearly doesn't come from US politics. The debate on Obamacare fell again in a stalemate. Regarding the data, decent activity data are probably not enough to save the dollar. Prices also need to go up. In this respect, the PCE deflator in tomorrow's US GDP report will be at least as important as the headline growth figure.
EUR/USD is pushing for a break of key 1.1735 level
Over the previous two months, EUR/USD cleared several intermediate resistance levels. The pair is currently pushing for a break of the 1.1714/36 resistance. A sustained break would end the long consolidation that followed the sharp decline of EUR/USD in 2014/early 2015 and change the broader picture for the dollar. EUR/USD is clearly moving into overbought territory (RSI near 75), but this is no guaranty that the move will stop right here. The break still needs to be confirmed, but if the pair doesn't return below 1.16 soon, the way to 1.20 is open. This is not our favourite scenario from an fundamental point of view, but momentum indicators indicate that the dollar remains in trouble. We wait for a technical sign before adding USD long exposure
EUR/USD: top MT consolidation pattern under heavy strain
EUR/GBP
EUR/GBP little changed despite EUR/USD rally
Yesterday's weak UK Q2 GDP growth printed exactly as expected. It was one of the last important data series before next week's BoE policy decision. Sterling hardly reacted on the GDP report. In technical trade, the pair drifted to the low 0.89 area, but rebounded after the Fed decision (EUR/USD driven) and closed the session little changed at 0.8943. Cable was propelled by the decline of the dollar and closed the session at 1.3122;
Today, CBI retail data will be published. A modest easing is expected. Markets will look out whether sales get more headwinds from the pressure on disposable income (due to higher inflation).
In a short-term perspective, sterling entered a consolidation pattern (against the euro). The market largely priced out the chances of an August rate hike. In this respect, the bad interest rate news should be discounted. Brexit is also temporary off the radar. Over the previous days, EUR/GBP didn't rise much further despite the overall EUR/USD rally. This suggest some relative sterling strength shortterm. From a technical point of view, EUR/GBP broke above the 0.8854/66 resistance (2017 top) to set a new correction high north of 0.89, but the rally slowed at the end of last week. A break below 0.8720 would suggest that upside momentum is easing. For now, we don't see a trigger for a sustained rebound of sterling against the euro. We still look to buy EUR/GBP on more pronounced dips. For that to happen, EUR/GBP probably needs some help from a correction in EUR/USD
EUR/GBP: consolidation near recent top