
Sample Category Title
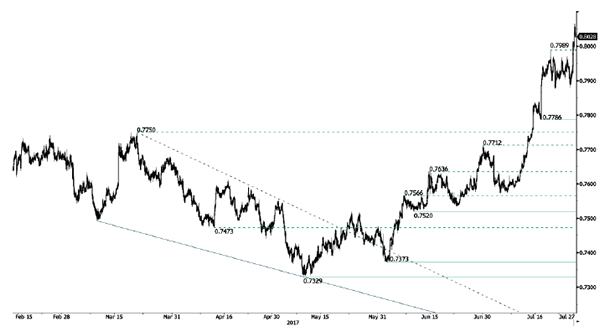
AUD/USD Sky Is The Limit !
AUD/USD's technical structure has finnaly not reversed. Hourly resistance given at 0.7989 (19/07/2017 high) has been broken. Hourly support given at 0.7875 (21/07/2017 low). There is no sign that the momentum will reverse.
In the long-term, we are waiting for further signs that the current downtrend is ending. Key supports stand at 0.6009 (31/10/2008 low) . A break of the key resistance at 0.8295 (15/01/2015 high) is needed to invalidate our long-term bearish view.
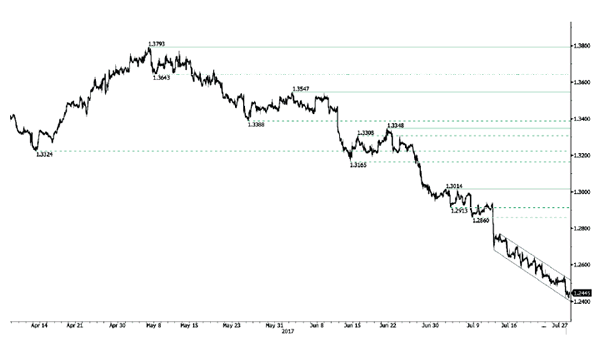
USD/CAD Continued Decline
USD/CAD is going lower and the pair remains in a strong bearish momentum. Hourly resistance is given at 1.2544 (26/07/2017). Expected to show continued bearish pressures.
In the longer term, the pair is now monitoring long-term support that can be found at 1.2461 (16/03/2015 low). Strong resistance is given at 1.4690 (22/01/2016 high). The pair should head lower.
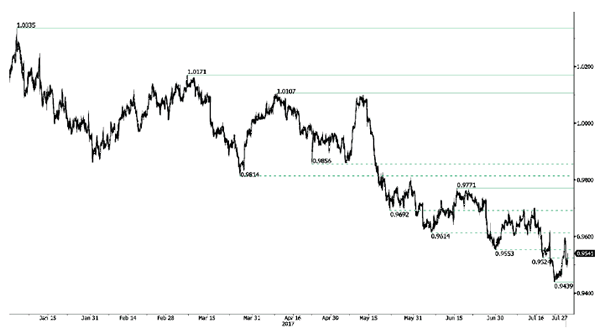
USD/CHF Bearish Momentum Is Not Over
USD/CHF is trading lower. Hourly support can be found at 0.9439 (21/07/2017 high). Strong resistance is given at 0.9771 (15/06/2017 high). Expected to to show further bearish consolidation
In the long-term, the pair is still trading in range since 2011 despite some turmoil when the SNB unpegged the CHF. Key support can be found 0.8986 (30/01/2015 low). The technical structure favours nonetheless a long term bullish bias since the unpeg in January 2015
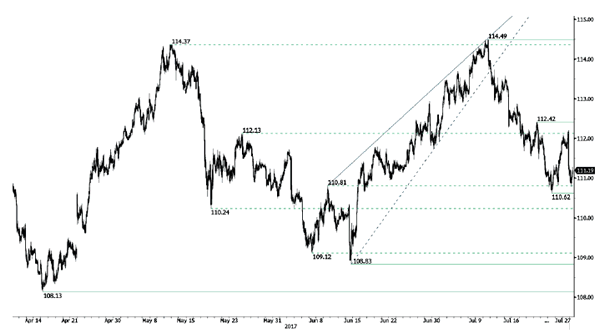
USD/JPY Ready For Further Decline
USD/JPY has failed to go any higher. Hourly support is given at 110.62 (24/06/2016 low). Stronger support is located at a distance at 108.83 (17/04/2017 low). Expected to show continued bearish pressures in case support at 110.62 breaks.
We favor a long-term bearish bias. Support is now given at 96.57 (10/08/2013 low). A gradual rise towards the major resistance at 135.15 (01/02/2002 high) seems absolutely unlikely. Expected to decline further support at 93.79 (13/06/2013 low).
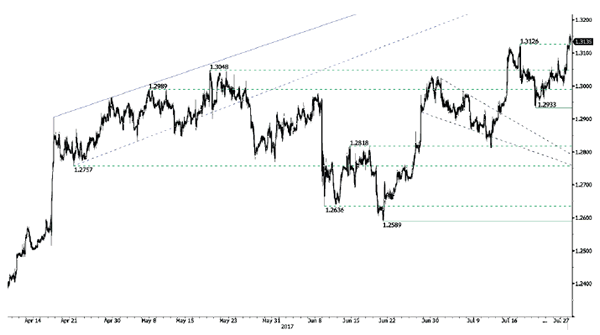
GBP/USD Strong Bullish Pressures
GBP/USD has broken hourly resistance is given at 1.3126 (16/07/2017 high). Hourly support is given at 1.2933 (20/07/2017 low). Expected to show continued bullish pressures.
The long-term technical pattern is even more negative since the Brexit vote has paved the way for further decline. Long-term support given at 1.0520 (01/03/85) represents a decent target. Long-term resistance is given at 1.5018 (24/06/2015) and would indicate a long-term reversal in the negative trend. Yet, it is very unlikely at the moment.
EUR/USD Heading Towards Long-Term Resistance
EUR/USD bullish pressures continue. Hourly resistance given at 1.1712 (25/07/2017 high) has been broken. Hourly support can be found at 1.1371 (13/07/2017 high). Stronger support lies at 1.1292 (28/06/2017 low). Expected to show continued bullish pressures.
In the longer term, the momentum is now turning largely positive. We favour a continued bullish bias. Key resistance is now holding at 1.1871 (24/08/2015 high)t while strong support lies at 1.0341 (03/01/2017 low).
US Dollar Falls Amid Dovish FOMC, VIX At All-Time Low
Dollar under pressure as US yields slide amid dovish FOMC statement
As broadly expected, FOMC members decided to leave monetary policy unchanged, maintaining the target range for the federal funds rate to 1% to 1.25% and not providing a clear timing about its balance sheet reduction plan. Little changes were made to the statement compared to the June version. The Federal Reserve acknowledged that inflation measures have declined and are now running below the 2% target. Most importantly, changes were made to the expected start of the balance sheet normalization program. In June statement, the Fed expected the program to be launched this year and it expects to be implemented 'relatively soon'. Does the market has to worry about such a change?
From our standpoint, we think this is definitely a dovish adjustment to the statement as it removes clarity regarding the timing, giving more room to start the balance sheet run off. In reaction to this dovish modification, the US dollar was heavily sold off yesterday amid the release. The dollar index fell another 1.10% to 93.15, the lowest level since mid-June last year. Higher yielding currencies were the big winners with the New Zealand and Australian dollar rising 1.60% and 1.15% respectively.
A fresh batch of US data is due for release later today. Initial jobless claims should come in at 1960k versus 1977k a week ago. More importantly, after shrinking two months in a row, durable goods orders should have risen 3.7%m/m in June. Excluding transportation, the indicators should rise by 0.4%m/m compared to 0.3% in July.
After months of lacklustre data, investors have a real need to see some solid and uninterrupted flow of encouraging data from the US. This only under these conditions that we’ll see a bounce back of the US dollar and the pursuit of recovery in US yields.
VIX at an all-time low
The news did not make massive headlines. The VIX, the US volatility index which is also known as the 'Fear Index', just collapsed to an all-time low below 10. We recall that the 20-year average is above 20 for the index. A few weeks ago, Janet Yellen, Fed Chairman, warned markets about asset valuation which she considers as too high. Fed definitely believes that stocks markets are in a bubble. This is ironic as the Fed largely participated to underpin asset prices with free money.
While the volatility is at an all-time low, stocks prices are at an all-time high. There is then the potential relation between low volatility and high stock prices which could drive investors towards a sell-off. Markets are now in a pausing mode certainly fearing that consequence. However, stocks markets are not losing steam and may further head higher.
All eyes are on Fed now which balance sheet reduction should be discussed in November. Currency-wise the dollar is now trading at 14-month low on recent disappointment of Trump expected fiscal policies and Fed failing to fully deliver what was expected.
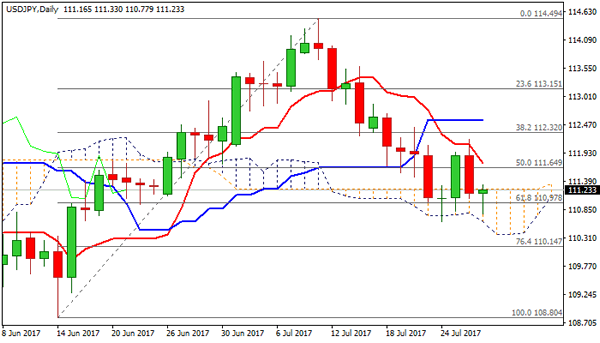
Technical Outlook: USDJPY – Near-Term Risk Is Turned Lower
The pair bounced above 111.00 handle after dipping to 110.77 low in Asia but struggles to firmly break above daily cloud top (111.23).
Near-term focus remains shifted lower after previous rally’s rejection at strong 112.10 barrier and subsequent weakness on profit-taking, accelerated by Fed.
While daily cloud caps upside attempts, risk of further weakness and retest of key supports at 110.62 (24 July low / daily cloud base) will remain in play, with break here to trigger fresh extension of larger downleg from 114.49.
Initial requirement for bearish resumption is close below 110.97 (Fibo 61.8% of 108.80/114.49 rally) after several probes below support proved to be false breaks.
Conversely, lift above daily cloud needs to regain minimum 111.74 (falling daily Tenkan-sen) to sideline immediate downside risk and open way towards key resistance at 112.10 barrier (Fibo 38.2% of 114.49/110.62 downleg / 200SMA).
Res: 111.33, 111.74, 111.95, 112.10
Sup: 110.77, 110.62, 110.23, 110.00
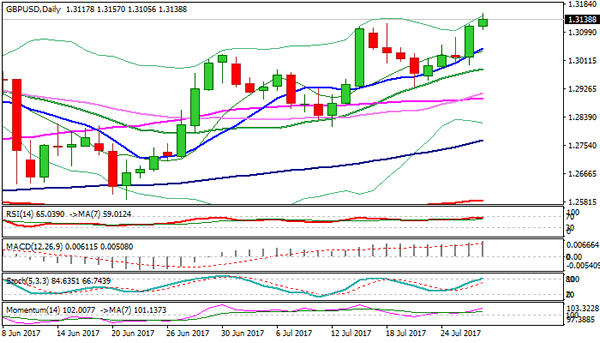
Technical Outlook: GBPUSD – Bulls May Extend Towards 1.3225 Fibo Expansion
Cable posted fresh multi-month high at 1.3157 on Thursday and eventually broke above previous high at 1.3125, after Wednesday's strong post-Fed rally peaked at 1.3122.
Strong bullish signal has been generated on eventual close above important barrier at 1.3109 (Fibo 38.2% of 1.5106/1.1930 descend) which resisted several attacks in past two weeks.
Close above 1.3125 barrier would signal fresh bullish extension towards Fibo 138.2% projection at 1.3225, with corrective action to be anticipated in the near-term as daily indicators are approaching overbought zone.
Initial support lies at 1.3105 (session low/near Fibo 38.2% of Wed/Thu 1.2998/1.3157 rally), followed by 1.3060 (Fibo 61.8%) and key near-term support at 1.3000.
Res: 1.3157, 1.3200, 1.3225, 1.3245
Sup: 1.3120, 1.3105, 1.3060, 1.3000
Fed Expects B/S Normalization ‘Relatively Soon’, Dollar Crashes
The FOMC kept its policy unchanged yesterday as was widely anticipated, while the statement accompanying the decision had very few changes compared to the previous. The only changes related to the inflation outlook and the timing of the balance sheet normalization. With regards to inflation, the Committee acknowledged that it is 'running below 2%', a downgrade from the previous description that it was 'running somewhat below' 2%. This may be a signal that the Fed is somewhat more concerned with persistently sluggish inflation. However, officials still expect it to stabilize around 2% over the medium term.
With regards to the balance sheet, the FOMC changed its language to signal that its reduction will begin 'relatively soon' instead of 'this year' as it was noted in the previous statement. Even though this may look like a hawkish upgrade, the dollar collapsed. This suggests to us that some market participants may have expected a direct reference to a B/S reduction announcement in September, or some may have even expected an announcement yesterday for the reduction to begin in September. In our view, 'relatively soon' is not a direct reference to September, but rather leaves the Committee some maneuvering room, which may have disappointed some overly optimistic investors.
As for the dollar, we maintain our view that it could remain on the back foot for a while, amid low expectations for another rate hike this year, soft economic data, and elevated uncertainty over whether Trump's fiscal plans will be implemented at all. The probability for another hike this year is roughly 50% according to the Fed funds futures. We think that a material rebound in inflation and economic growth is needed for that probability to rise and help the greenback recover somewhat. In this respect, the preliminary estimate of GDP for Q2 due out tomorrow will be closely watched.
EUR/USD rallied following the FOMC decision, breaking above the all-important barrier of 1.1710 (S1), which acted as the upper bound of the long-term sideways range that had been in place since January 2015. In our view, the clearing of that level combined with the fact that both the short-term and medium-term outlooks remain positive, opens the door for further advances. Even if the rate corrects lower on a possible increase in US durable goods rates today (see below), we expect the bulls to regain control soon and perhaps aim for the 1.1880 (R1) resistance.
USD/JPY tumbled yesterday in the aftermath of the Fed meeting. The pair fell after it hit resistance near the 112.25 (R3) resistance zone to stop slightly above the key support of 110.60 (S1). In our view, the short-term outlook remains negative, but we stay mindful that a corrective rebound from near 110.60 (S1) may be on the cards before the bears decide to shoot again. The catalyst for such a rebound may be today's US durable goods orders.
Today's highlights:
During the European morning, we get lots Swedish economic indicators. The unemployment rate for June is expected to have risen notably, which may hurt SEK somewhat. We also get the consumer and manufacturing confidence indices for July, but neither of these is usually a major market mover. In Eurozone, the M3 money supply for June is due out.
From the US, as we already noted, we get durable goods orders for June. The forecast is for both the headline and the core rates to have risen. The case for solid durable goods is supported by the nation's ISM manufacturing PMI for June, the new orders sub-index of which rose notably, indicating accelerating growth in orders. Such durable goods prints may help the dollar to recover some of its latest losses, but given the negative sentiment currently surrounding the currency, any positive reaction may remain relatively short-lived. We also get initial jobless claims for the week ended July 21st.
EUR/USD
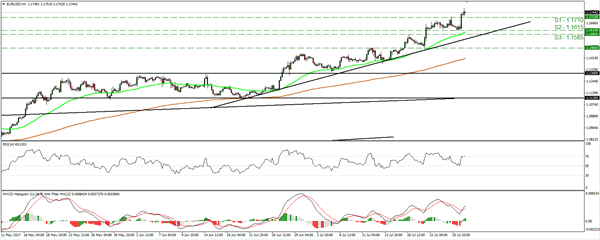
Support: 1.1710 (S1), 1.1615 (S2), 1.1585 (S3)
Resistance: 1.1880 (R1), 1.1980 (R2), 1.2110 (R3)
USD/JPY
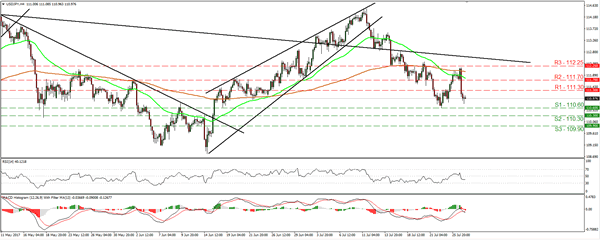
Support: 110.60 (S1), 110.30 (S2), 109.90 (S3)
Resistance: 111.30 (R1), 111.70 (R2), 112.25 (R3)