
Sample Category Title
Forex Technical Analysis: EUR/USD, USD/JPY, GBP/USD
EUR/USD
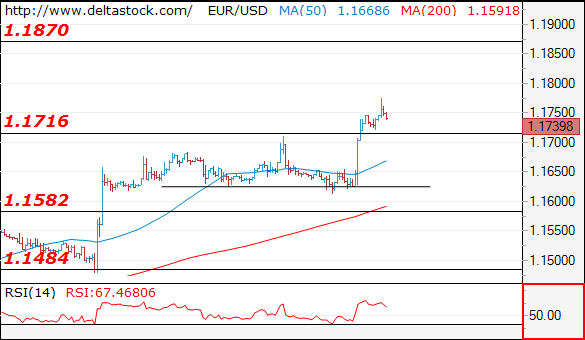
Current level - 1.1739
The corrective pattern below 1.1716 was a shallow one and the general uptrend has been renewed, heading towards 1.1870 hurdle. Initial intraday support lies at 1.1716 and crucial on the downside is the recent low at 1.1611.
| Resistance | Support | ||
| intraday | intraweek | intraday | intraweek |
| 1.1780 | 1.1870 | 1.1716 | 1.1580 |
| 1.1870 | 1.2000 | 1.1611 | 1.1480 |
USD/JPY
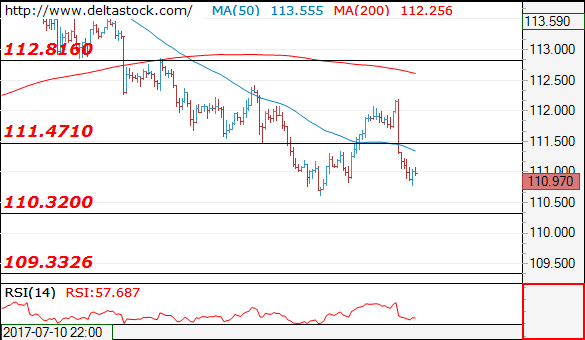
Current level - 110.97
The corrective rebound above 111.60 is over with yesterday's peak at 112.20 and the outlook is bearish, for a slide towards 109.30. Minor intraday resistance lies at 111.47.
| Resistance | Support | ||
| intraday | intraweek | intraday | intraweek |
| 111.47 | 114.50 | 110.30 | 110.30 |
| 112.80 | 115.50 | 109.30 | 108.10 |
GBP/USD
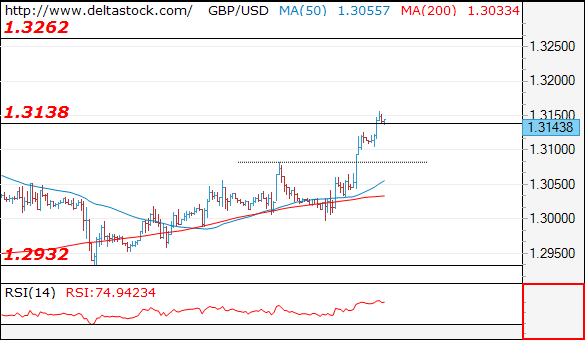
Current level - 1.3148
The test at 1.3000 has failed and the uptrend has been renewed, currently heading towards 1.3260 area. Key intraday support is projected at 1.3080.
| Resistance | Support | ||
| intraday | intraweek | intraday | intraweek |
| 1.3160 | 1.3260 | 1.3080 | 1.2930 |
| 1.3260 | 1.3500 | 1.2930 | 1.2810 |
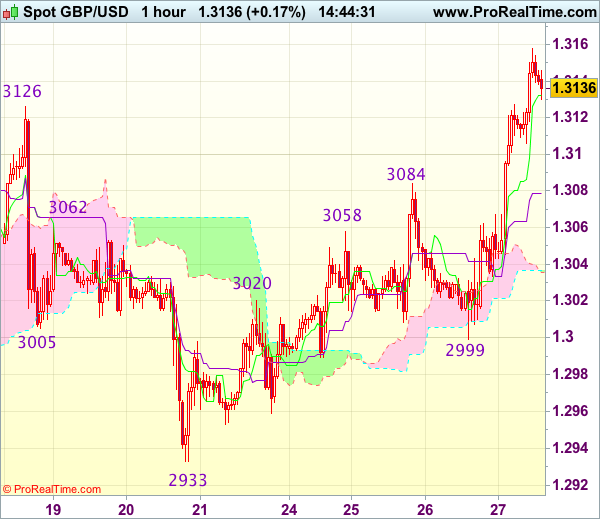
Trade Idea : GBP/USD – Buy at 1.3085
GBP/USD - 1.3135
Most recent candlesticks pattern : N/A
Trend : Near term up
Tenkan-Sen level : 1.3132
Kijun-Sen level : 1.3079
Ichimoku cloud top : 1.3037
Ichimoku cloud bottom : 1.3036
Original strategy :
Sold at 1.3100, stopped at 1.3135
Position : - Short at 1.3100
Target : -
Stop : - 1.3135
New strategy :
Buy at 1.3085, Target: 1.3185, Stop: 1.3050
Position : -
Target : -
Stop : -
Cable found decent demand just below 1.3000 level and has rallied on back of dollar’s broad-based selloff, signal recent upmove is still in progress and upside bias is seen for further gain to 1.3160, then 1.3185-90, however, near term overbought condition should prevent sharp move beyond 1.3210-20 and price should falter below 1.3240-50, risk from there is seen for a retreat later.
In view of this, would not chase this rise here and we are looking to buy sterling on subsequent pullback as previous resistance at 1.3084 should turn into support and contain cable’s downside, bring another rise. Below 1.3050 would risk weakness to 1.3030-35 but break of latter level is needed to signal top is formed, then correction to 1.2999 support would follow.
Daily Technical Analysis: US Dollar Continues Downtrend After Fed Leaves Rates Unchanged
Currency pair EUR/USD
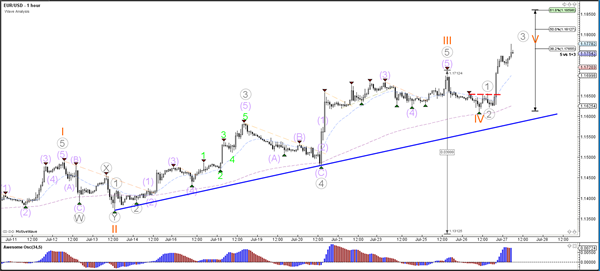
As expected the Federal Reserve (Fed) left the interest rates unchanged for the US, which caused the US Dollar to weaken against multiple currencies, including the Euro. Prior to the FOMC statement in the US, the EUR/USD retraced back to the 23.6% Fibonacci level of wave 4 vs 3 but price bounced strongly soon after. The EUR/USD has now reached the 1.1750 resistance level and a break above it could see price challenge the Fibonacci targets of wave 5 vs 1+3.
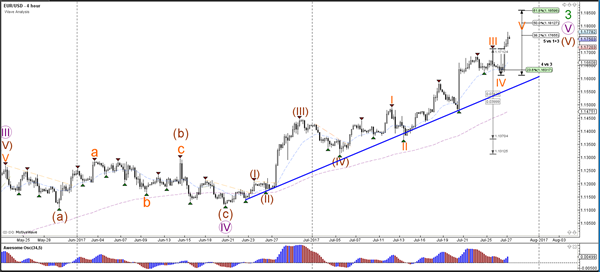
The EUR/USD completed a wave 4 (orange) retracement and is now building strong bullish momentum. This is probably part of a wave 3 (grey) within wave 5 (orange). Once the wave 3 is completed, it is likely to see a wave 4 and 5 (grey) continuation.
Currency pair USD/JPY
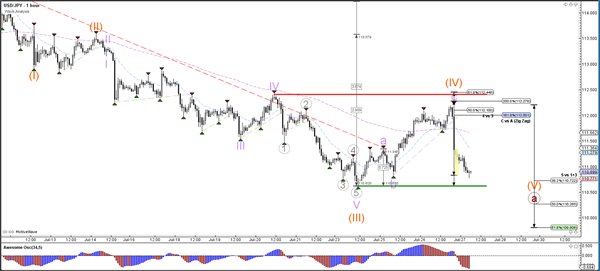
The USD/JPY respected and bounced at the Fibonacci levels of wave 4 (orange) and the resistance from the previous top (red). The bearish turn is most likely part of the wave 5 (orange).
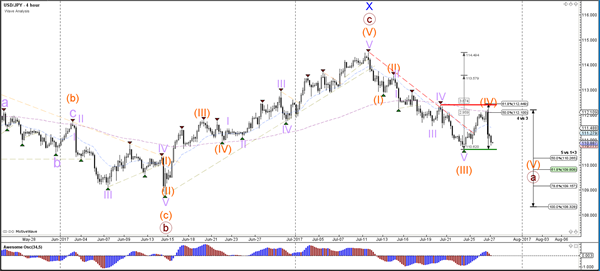
The USD/JPY could move towards the round level of 110 once price breaks below the bottom (green).
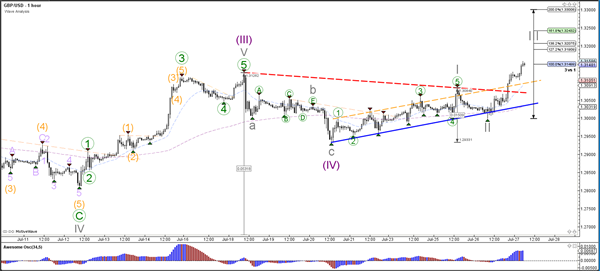
Currency pair GBP/USD
The GBP/USD broke above the resistance trend lines (dotted orange/red) with strong bullish momentum. This makes a bullish wave structure more likely and price could be heading towards the Fibonacci targets of wave 5 vs 1+3.
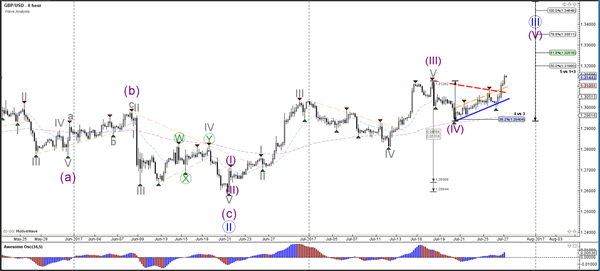
The GBP/USD seems to be in a wave 3 (grey) breakout. Price needs to reach the 161.8% Fibonacci target before confirming the development of a wave 3.
Daily Technical Outlook And Review: EUR/USD, GBP/USD, AUD/USD, USD/JPY, USD/CAD, USD/CHF, DOW 30, GOLD
A note on lower timeframe confirming price action...
Waiting for lower timeframe confirmation is our main tool to confirm strength within higher timeframe zones, and has really been the key to our trading success. It takes a little time to understand the subtle nuances, however, as each trade is never the same, but once you master the rhythm so to speak, you will be saved from countless unnecessary losing trades. The following is a list of what we look for:
- A break/retest of supply or demand dependent on which way you're trading.
- A trendline break/retest.
- Buying/selling tails ... essentially we look for a cluster of very obvious spikes off of lower timeframe support and resistance levels within the higher timeframe zone.
- Candlestick patterns. We tend to only stick with pin bars and engulfing bars as these have proven to be the most effective.
We typically search for lower-timeframe confirmation between the M15 and H1 timeframes, since most of our higher-timeframe areas begin with the H4. Stops are usually placed 1-3 pips beyond confirming structures.
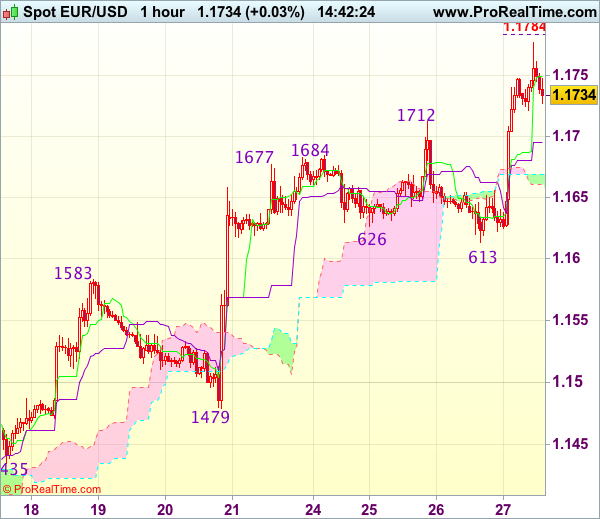
EUR/USD
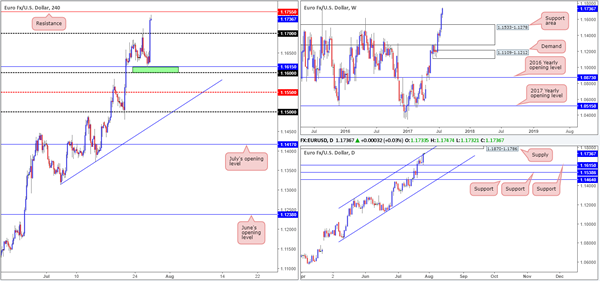
For those who read Wednesday's report you may recall our team highlighting the green H4 area at 1.16/1.1615 as a potential buy zone. The area comprised of a psychological band at 1.16, a H4 38.2% Fib support level at 1.1606 pegged from the low 1.1479 and a daily support at 1.1615.
As can be seen from the chart the zone responded beautifully, and was made stronger after the Federal Reserve decided to leave interest rates unchanged, as expected. With offers likely cleared from 1.17, we're likely going to be crossing swords with H4 resistance at 1.1755 sometime today.
Also of particular interest, daily price ended the day marginally closing above the upper channel resistance line extended from the high 1.1263, and chalked in a reasonably strong-looking bullish candle. In the event that this move has cleared the majority of offers here, the next area of interest can be seen around a supply zone located nearby at 1.1870-1.1786.
Our suggestions: As price is nearing the underside of a major daily supply right now, we feel upside momentum may begin to diminish. In fact, we would refrain from taking any long positions at this time given that the unit is now only inches away from the noted H4 resistance which happens to sit only thirty pips beneath the current daily supply. Therefore, at least for the time being, our desk will remain on the sidelines.
Data points to consider: US Core durable goods numbers and US Weekly unemployment claims at 1.30pm GMT+1.
Levels to watch/live orders:
- Buys: Flat (stop loss: N/A).
- Sells: Flat (stop loss: N/A).
GBP/USD
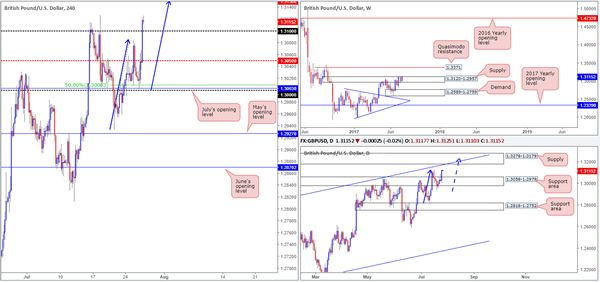
During the course of Wednesday's sessions, the GBP/USD retested the 1.30 neighborhood and was met by strong buying pressure (influenced by the Fed's decision to leave interest rates unchanged). In yesterday's report, we placed 1.30 under the spotlight given that it fused nicely with July's opening level at 1.3003 and a 50.0% support at 1.3008 taken from the low 1.2932. Well done to any of our readers who managed to jump in on this move.
With H4 price now clear above the 1.31 handle, we feel it's reasonable to assume that the mid-level number 1.3150 will likely be the next target in the firing range today. What's also notable here is the approach: there is a nice-looking AB=CD bearish formation taking shape which terminates at exactly 1.3150 (see blue arrows).
Over on the bigger picture, the weekly candles remain trading around the upper edge of a supply zone pegged at 1.3120-1.2957, suggesting weakness in the sellers' camp right now. On the other side of the field, however, the daily chart shows price action to be trading from a support area coming in at 1.3058-1.2979. What's also interesting on this scale is the potential AB=CD bearish pattern that completes within the supply zone marked at 1.3278-1.3179 that converges with a channel resistance line drawn from the high1.2774.
Our suggestions: Although we believe a bounce will be seen from 1.3150 today, the market will likely look to strive to reach the 1.3180 mark since this price level represents the underside of the said DAILY supply and channel resistance line, which could, if it falls within your trading parameters, be a nice zone to look for shorts.
Data points to consider: US Core durable goods numbers and US Weekly unemployment claims at 1.30pm GMT+1.
Levels to watch/live orders:
- Buys: Flat (stop loss: N/A).
- Sells: 1.3180 region ([waiting for a H4 bear candle to form – preferably a full, or near-full-bodied candle – before pulling the trigger is advised] stop loss: ideally beyond the candle's wick).
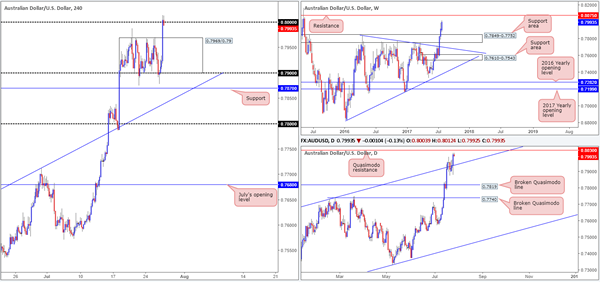
AUD/USD
In recent trading, the commodity currency rallied to the upside following the Fed's decision to leave interest rates unchanged. The move lifted H4 price out of its range at 0.7969/0.79, and is now seen aggressively challenging the large psychological band 0.80.
Weekly action on the other hand, shows there's space for the unit to advance up to resistance marked at 0.8075. Down on the daily timeframe, nevertheless, the candles have now relocated above the channel resistance line taken from the high 0.7732, and opened up the possibility of a move being seen towards a nearby Quasimodo resistance at 0.8030.
Our suggestions: With 0.80 being a watched number in the market, there was likely a truckload of stop-loss orders (buy stops) triggered above this number in recent hours. This may be enough liquidity for the big boys to sell this market back down to the top edge of the H4 range at 0.7969. However, this is not something our team would feel comfortable trading, due to the room seen to advance higher on the bigger picture.
Ultimately, we have decided to wait and see if price can drive north into the 0.8075/0.8030 area (weekly resistance/daily Quasimodo resistance) and then go about looking to sell this market (a slightly different outlook from Wednesday).
Data points to consider: US Core durable goods numbers and US Weekly unemployment claims at 1.30pm GMT+1.
Levels to watch/live orders:
- Buys: Flat (stop loss: N/A).
- Sells: 0.8075/0.8030 ([waiting for a H4 bear candle to form – preferably a full, or near-full-bodied candle – before pulling the trigger is advised] stop loss: ideally beyond the candle's wick)
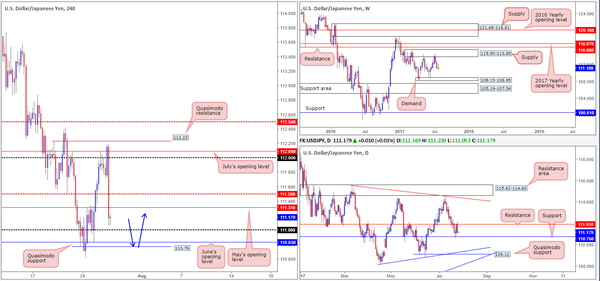
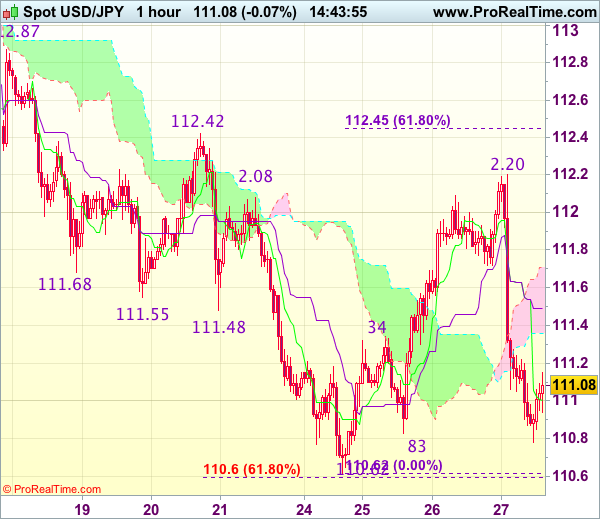
USD/JPY
Beginning this morning's report with a look at the weekly timeframe, we can see that the unit is ranging between supply at 115.50-113.85 and demand at 108.13-108.95. Along similar lines, daily price is also seen sandwiched between support coming in at 110.76 and resistance at 111.91.
Looking across to the H4 candles, the market failed to generate much follow through buying above July's opening level at 112.09 yesterday, and went on to aggressively trade lower. The move, influenced by the Fed's decision to leave interest rates unchanged, saw price take out multiple H4 supports, before ending the day closing just ahead of the 111 handle.
Our suggestions: On account of the above notes, this is how we are looking at this market right now. The 111 handle will likely possess willing buyers who will place stops 10-20 pips beneath this number. Below 111 is June's opening level at 110.83, shadowed closely by a Quasimodo support at 110.76. Take note that this Quasimodo also aligns perfectly with the current daily support. So, given the stops (sell stops from both buyers looking to long 111 and also sellers looking to sell the breakout) planted beneath 111, we feel the big boys will breach 111 today and look to attack the 110.76 neighborhood for a trade long. The only grumble we have here, of course, is the fact that weekly price provides little support until we reach the 108.95 region. Despite this, we still feel the odds of a bounce being seen from the 110.76 level is relatively high.
Therefore, we have placed a pending buy order at 110.77, with a stop pegged below the Quasimodo apex at 110.60. With this position requiring a 17-pip stop and the first take-profit target being set at 111, this gives us over one times our risk to the first target on this trade.
Data points to consider: US Core durable goods numbers and US Weekly unemployment claims at 1.30pm GMT+1.
Levels to watch/live orders:
- Buys: 110.77 ([pending order] stop loss: 110.60).
- Sells: Flat (stop loss: N/A).
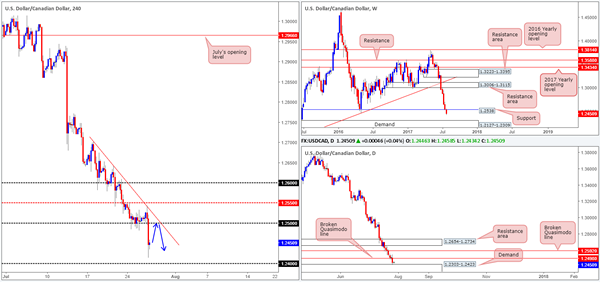
USD/CAD
Following the FOMC statement, the USD/CAD fell sharply. The move erased bids from the 1.25 handle and went on to clock a fresh low of 1.2413 on the day. Why price found support ahead of 1.24 is likely due to the fact that daily price connected with the top edge of a demand base coming in at 1.2303-1.2423. Despite this, the bulls appear incredibly weak on the weekly timeframe at the moment. The weekly support at 1.2538 has put up little to no fight so far, therefore allowing the unit to trade a considerable distance below it!
Our suggestions: The strength of the current downtrend – coupled with the noted weekly support showing no signs of bullish intent – does not really instill much confidence for those wishing to long from the aforesaid daily demand area.
With this in mind, today's spotlight will firmly be focused on 1.25 for a possible sell trade. 1.25 is not only a watched psychological number in this market, it is also a level that converges with a H4 trendline resistance extended from the high 1.2701 and a daily broken Quasimodo line at 1.2498.
Data points to consider: US Core durable goods numbers and US Weekly unemployment claims at 1.30pm GMT+1.
Levels to watch/live orders:
- Buys: Flat (Stop loss: N/A).
- Sells: 1.25 region ([waiting for a H4 bear candle to form – preferably a full, or near-full-bodied candle – before pulling the trigger is advised] stop loss: ideally beyond the candle's wick).
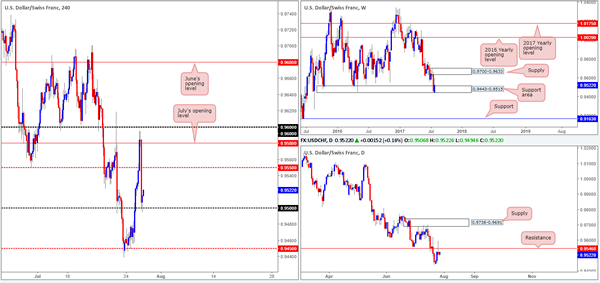
USD/CHF
H4 price failed to sustain gains beyond July's opening level at 0.9580 on Wednesday, after the Fed decided to leave interest rates unchanged. In one fell swoop, the H4 mid-level support at 0.9550 was aggressively taken out, leaving price free to challenge the 0.95 handle, which, for now, is holding firm.
Yesterday's sharp move to the downside helped form a beautiful-looking daily selling wick, which, as you can see, pierced resistance at 0.9546. To a lot of traders, this will be a sell signal! However, until price has cleared the 0.96 handle, and also (for you long-term traders) the major weekly support area at 0.9443-0.9515, selling this market is difficult, in our humble opinion.
Our suggestions: Buying from 0.95, although you will be trading in-line with potential weekly flow, is challenging given the nearby daily resistance and selling wick. And, as we've already mentioned, selling is problematic given the 0.95 level and current weekly support area.
As far as we can see, technical elements are mixed at the moment, leaving us with little choice but to remain on the sidelines for now.
Data points to consider: US Core durable goods numbers and US Weekly unemployment claims at 1.30pm GMT+1.
Levels to watch/live orders:
- Buys: Flat (stop loss: N/A).
- Sells: Flat (stop loss: N/A).
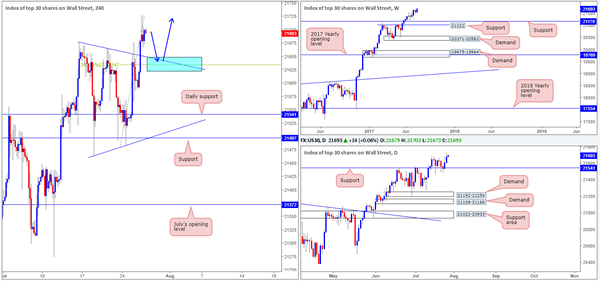
DOW 30
As was noted in Wednesday's report, we have seen the US equity market chalk up a potential H4 bullish pennant formation (21677/21462) over the past few weeks. Yesterday's action, however, pushed to the upside and clocked a fresh all-time high of 21727, consequently breaking the top edge of the said pennant pattern. We also mentioned in yesterday's analysis that a breakout to the upside would be a valid buy signal, but would not be a move we'd consider trading until the unit has retested the broken pennant edge (the blue area) as support. Of particular interest here is that the pennant edge also aligns nicely with a H4 38.2% Fib support at 21633.
Our suggestions: Should the H4 candles retest the pennant edge today (as per the blue arrows) and print a full, or near-full-bodied H4 bull candle, this would be enough for us to enter into a long position with stops pegged below the H4 bull candle's tail.
Data points to consider: US Core durable goods numbers and US Weekly unemployment claims at 1.30pm GMT+1.
Levels to watch/live orders:
- Buys: Watch for H4 price to retest the current H4 pennant upper edge ([waiting for a full, or near-full-bodied H4 bull candle to form following the retest is advised] stop loss: ideally beyond the candle's tail).
- Sells: Flat (stop loss: N/A).
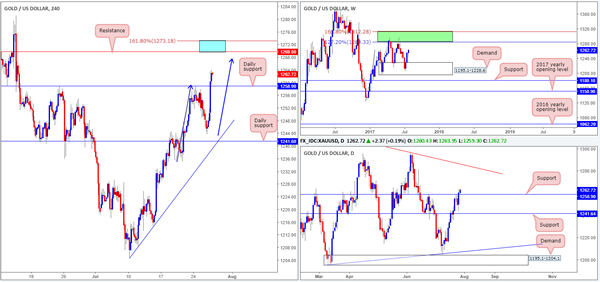
GOLD
Across the board we saw the US dollar plummet on Wednesday after the Fed decided to keep interest rates unchanged. This lifted the appeal to own gold and thus raised the metal's price, consequently breaking through a daily resistance line at 1258.9. What this also achieved was potentially clearing the path north up to H4 resistance at 1269.8, which is located nearby a H4 AB=CD (see blue arrows) 161.8% Fib ext. point at 1273.1.
While 1273.1/1269.8 appears to be a relatively strong-looking sell zone (blue area), one always has to take into account where he/she is on the bigger picture. Weekly price shows room to advance all the way back up to an area comprised of two Fibonacci extensions 161.8/127.2% at 1312.2/1284.3 taken from the low 1188.1 (green zone). By the same token, the daily candles also now show space to extend up to a trendline resistance taken from the high 1337.3.
Our suggestions: A bounce from 1273.1/1269.8 will likely take shape should price connect with it today. How much of a bounce though is difficult to judge, given the bigger picture showing that the bulls currently have the upper hand. Personally, we will not be trading short from this barrier. Even with additional candle confirmation, we feel the risk is too great here.
Levels to watch/live orders:
- Buys: Flat (stop loss: N/A).
- Sells: Flat (stop loss: N/A).
Trade Idea : EUR/USD – Stand aside
EUR/USD - 1.1730
Most recent candlesticks pattern : N/A
Trend : Near term up
Tenkan-Sen level : 1.1749
Kijun-Sen level : 1.1695
Ichimoku cloud top : 1.1669
Ichimoku cloud bottom : 1.1658
Original strategy :
Sold at 1.1680, stopped at 1.1715
Position : - Short at 1.1680
Target : -
Stop : - 1.1715
New strategy :
Stand aside
Position : -
Target : -
Stop : -
The single currency rallied on dollar’s broad-based weakness after Fed, the breach of previous resistance at 1.1712 confirms recent upmove has resumed, hence gain to 1.1780-85 (50% projection of 1.1370-1.1712 measuring from 1.1613) cannot be ruled out, however, loss of near term upward momentum should prevent sharp move beyond 1.1820-25 (61.8% projection), risk from there has increased for a retreat later.
In view of this, would not chase this rise here and would be prudent to stand aside in the meantime. Below the Kijun-Sen (now at 1.1695) would suggest an intra-day top is formed, bring test of the lower Kumo (now at 1.1658) but break there is needed to bring correction of recent rise towards support at 1.1613 first.
Trade Idea : USD/JPY – Sell again at 111.45
USD/JPY - 111.11
Most recent candlesticks pattern : N/A
Trend : Near term down
Tenkan-Sen level : 111.00
Kijun-Sen level : 111.49
Ichimoku cloud top : 111.71
Ichimoku cloud bottom : 111.36
Original strategy :
Exit short entered at 112.00
Position : - Short at 112.00
Target : -
Stop : -
New strategy :
Sell at 111.45, Target: 110.45, Stop: 111.80
Position : -
Target : -
Stop : -
The greenback ran into renewed selling interest at 112.20 and has tumbled after Fed, reviving our bearishness and signaling the rebound from 110.62 has ended at 112.20, hence consolidation with downside bias remains for another test of said support, break there would confirm recent decline has resumed and extend weakness to 111.34 (previous resistance turned support) but reckon downside would be limited to 111.10-15 and support at 110.83 should hold from here.
In view of this, we are looking to reinstate short on recovery as the Kijun-Sen (now at 111.49) should limit upside and bring another decline later. Above 111.75-80 would defer and prolong choppy trading, however, price should still falter below said resistance at 112.20, bring retreat later.
European Open Briefing: The US Dollar Came Under Renewed Pressure Following The FOMC Statement
Global Markets:
- Asian stock markets: Nikkei up 0.10 %, Shanghai Composite fell 0.30 %, Hang Seng rose 0.35 %, ASX 200 rallied 0.30 %
- Commodities: Gold at $1264 (+1.20 %), Silver at $16.71 (+1.50 %), WTI Oil at $48.65 (-0.20 %), Brent Oil at $50.90 (-0.20 %)
- Rates: US 10-year yield at 2.28, UK 10-year yield at 1.24, German 10-year yield at 0.55
News & Data:
- South Korea GDP q/q 0.6 % vs 0.6 % expected
- Australia Export Price Index q/q -5.7 % vs -6.3 % expected
FOMC Meeting:
- Fed to start balance sheet unwind 'relatively soon'
- Repeats that inflation seen rising to 2%
- Says will reinvest holdings 'for the time being'
- Repeats that overall inflation measures ex food and energy have declined
- No dissents
- Says job gains 'have been solid'
- Household spending and business investment have continued to expand
- Repeats that near-term risks to the economy appear 'roughly balanced' but it is monitoring inflation developments closely
Markets Update:
The US Dollar came under renewed pressure following the FOMC statement. The central bank was more dovish than expected, and lowered its inflation expectations. Market participants are now questioning whether there will be another rate hike this year at all.
EUR/USD broke back above 1.17 and extended gains to 1.1775. There is now little resistance until 1.20, although the pair is already heavily overbought in the short-term. Support is now seen at 1.17 and 1.1620.
GBP/USD cleared resistance at 1.31 and reached a high of 1.3160. However, the Pound is likely to struggle to extend gains given the uncertainty around Brexit and the recent low inflation numbers.
USD/JPY is holding quite well given the broad Dollar weakness, but a test of 110 seems inevitable. Should that level break, a decline towards 108 seems likely.
AUD/USD caught a bid overnight and broke above 0.80 resistance without much struggle. There is now no major resistance until 0.82 and the pair is likely to test that level soon. Positive risk sentiment and rising commodity prices should keep the Aussie Dollar supported in the near-term.
Upcoming Events:
- 13:30 BST – US Core Durable Goods Orders
- 13:30 BST – US Initial Jobless Claims
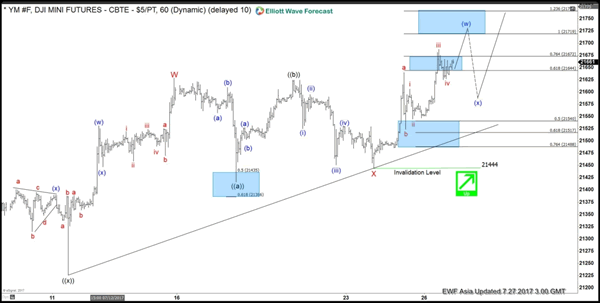
Elliott Wave View: Dow Futures
Short term YM_F (Dow E-Mini Future) Elliott Wave view suggests the rally from 6/29 low is unfolding as a double three Elliott wave structure and ended with Minor wave W at 21628. Down from there, Minor wave X pullback unfolded as a running Elliott Wave flat. Minute wave ((a)) ended at 21457, Minute wave ((b)) ended at 21624, and Minute wave ((c)) of X ended at 21444. Index has since made a new high suggesting the next leg higher has started. Up from 21444 low, Sub Minutte wave a ended at 21640. And Sub Minutte wave b pullback ended at 21524, while above there expect Index to extend higher again.
Near term focus remains towards 21719-21769 100%-123.6% extension area from 21444 low to end the Minutte wave (w) higher. The index then has scope to see a pullback, which should then find buyer’s again in sequence of 3, 7 or 11 swings for further upside provided the pivot at 21444 low remains intact. We don’t like selling the Index and favors buying the dips against 21444 low in the first degree. If pivot at 21444 low fails, then the move higher from 6/29 (21138) can be seen as a 5 waves diagonal. In this case, Index should pullback in 3, 7, or 11 swing to correct cycle from 6/29 low before the rally resumes.
Dow E-Mini Future 1 Hour Elliott Wave View
Polish Zloty Remains Firmly Bullish As The USD Crumbles
Key Points:
- The PLNUSD has been powering higher over recent weeks.
- Technically, the pair is well placed to rally further.
- USD weakness will only help to spur the bulls into action.
Just for something different, we are looking at the Polish Zloty today as the currency has been making some solid gains on the greenback and it looks as though it could extend further still. Indeed, this exotic cross has been powering higher over the past few months – on par with even the Swiss Franc's solid performance.
From a technical perspective, it's easy to see why further gains are expected for this highly bullish pair. As shown below, the EMA bias is in the most bullish configuration possible and in little danger of seeing a shift in momentum any time soon. Additionally, momentum indicators such as the ADX are certainly suggesting that a very strong trend is in play which means it would likely take a decent fundamental upset to slow the accent.
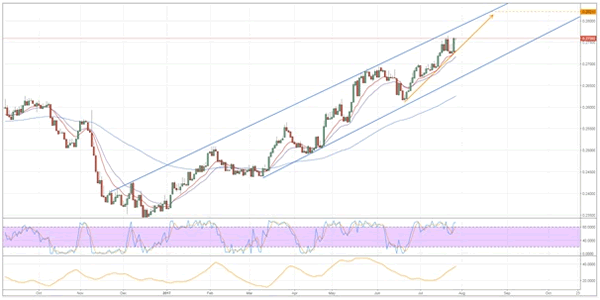
What's more, whilst it is currently bearish, the parabolic SAR reading is on the cusp of inverting to bullish which could mean that we don't see the pair cool off for some time. Instead, we could see yet another push higher before the PLNUSD decides to return to the downside of the channel. Of course, this largely makes sense as the pair hasn't managed to fully test the upside constraint of the broader ascending channel since May.
If we do continue to see the pair advance, the Zloty could eventually reach as high as the 0.2821 mark over the next few weeks. At this point, there is a very distinct chance that it will be highly oversold and in need of a slip back to support. Exactly how far it will stumble is not yet clear, nevertheless, it should be able to hold above the 0.2750 level without too much trouble.
Ultimately, the outlook is fairly good for the PLNUSD moving forward and we can expect to see it enjoy the market's favour. This will especially be the case as the USD remains besieged by negative sentiment stemming from political turmoil in the US and recently refreshed concerns that the Fed cannot deliver on its long-touted rate hikes.
Market Update – Asian Session: Broad Dollar Weakness Reigns
Asia Summary
Equities markets in the region opened generally higher absorbing the Fed rate decision in stride. Earnings season is now in full swing around the globe with Nintendo in Japan putting out strong results after the close yesterday, in Korea Samsung Electronics reported final Q2 results a bit higher than prelim. The dollar saw a broad sell off over the session, with the biggest moves coming about mid-day. EUR/USD rose to 1.1777, AUD/USD 0.8066 and USD/JPY tested 110.78. Korea's won gained 1% against the USD, while copper held steady around a 2-year high in London as markets process China's scrap import ban.
The PBOC shifted its OMO to using just 7-days, dropping its use of 14-day reverse repos, operations were small with a total net injection of CNY20B. Chinese press said that China is exploring a multi-tiered reserve requirement system in order to address liquidity strains. Offshore yuan nearly reached a 2-month high. Markets were little impacted by economic data in the session.
Key economic data
(BR) BRAZIL CENTRAL BANK (BCB) CUTS SELIC TARGET RATE BY 100BPS TO 9.25%; AS EXPECTED
(KR) SOUTH KOREA Q2 PRELIM GDP Q/Q: 0.6% V 0.6%E; Y/Y: 2.7% V 2.7%E
(CN) CHINA JUN SWIFT GLOBAL PAYMENTS (CNY): 1.98% V 1.6% PRIOR
(JP) Japan investors net bought ¥1.18T in foreign bonds v bought ¥947B in prior week; Foreign investors net bought ¥292B in Japan stocks v bought ¥377B in prior week
(AU) AUSTRALIA Q2 IMPORT PRICE INDEX Q/Q: -0.1% V 0.7%E; EXPORT PRICE INDEX Q/Q: -5.7% V -5.5%E
(CN) CHINA JUN INDUSTRIAL PROFITS Y/Y: 19.1% V 16.7% PRIOR
Speakers and Press
China
(CN) Chinese Academy of Social Sciences (CASS) and former PBOC Adviser Yu: capital outflows are more likely to be a larger source of systemic risk in China than high debt - China press
(CN) China Ministry of Finance (MOFCOM): China to keep increasing imports from US
(CN) Moody's revises outlook on China banking system to stable from negative
Korea
(KR) Intelligence authorities see Kim Jong Un's motorcade near missile site, seen as a sign launch is imminent at missile site in northwestern North Korea
(KR) Bank of Korea (BOK) OfficialChung: consumption and investment led to Q2 GDP growth; see private consumption to continue improving
Japan
(JP) Japan Govt recommends minimum wage increase of 3% or ¥25 to ¥848/hr (same rate as last year)
(JP) Luxury goods brands such as Chanel and Cartier said to raise prices in Japan in Aug due to FX rate shifts - Nikkei
Other
(TW) Taiwan and US to focus on medical sector in trade talks - Taiwan press
Asian Equity Indices/Futures (00:00ET)
Nikkei +0.2%, Hang Seng +0.5%, Shanghai Composite -0.3%, ASX200 +0.3%, Kospi +0.2%
Equity Futures: S&P500 +0.2%; Nasdaq +0.5%, Dax +0.1%, FTSE100 +0.2%
FX ranges/Commodities/Fixed Income (00:00ET)
EUR 1.1776-1.1721; JPY 111.22-110.78; AUD 0.8065-0.7992; NZD 0.7558-0.7517
Aug Gold +1.2% at 1,264/oz; Sept Crude Oil -0.1% at $48.69/brl; Sept Copper +0.2% at $2.88/lb
USD/CNY *(CN) PBOC SETS YUAN REFERENCE RATE AT 6.7307 V 6.7529 PRIOR
(NZ) New Zealand sells NZ$150M in 3.5% 2033 bonds; avg yield 3.2996%
(CN) China PBOC OMO injects CNYB in 7 day reverse repos v CNY130B in 7 and 14 day prior
(JP) Japan MoF sells ¥400.1B v ¥400B indicated in 2-yr 0.1% (prior 0.1%) JGBs; Avg yield: -0.1150% v -0.103% prior; bid to cover: 5.35x v 6.79x prior
Equities notable movers
Hong Kong/China
Sands China, 1928.HK Reports Q2 Net profit $326M v $237M y/y, Rev $1.82B v $1.48B y/y; -0.3%
Dongfang Electric ,1072.HK Guides H1 Net CNY370M; +7.6%
Japan
Nintendo, 7974.JP Reports Q1 Net ¥21.3B v ¥7.6Be; Op ¥16.2B v ¥10.6Be; Rev ¥154.1B v ¥62.0B y/y; +7.1%
Korea
Samsung Electronics,005930.KR Reports final Q2 (KRW) Net 10.8T v 9.8Te; Op 14.07T v 14.0T prelim; Rev 61.0T v 60.0T prelim; to buy back KRW1.67T of shares; flat
Other
United Microelectronics, UMC Reports Q2 net (NT$) 2.10B v 1.27Be, Rev 37.5B v 37.0B y/y; -8.1%
US markets on close: Dow +0.5%, S&P500 flat, Nasdaq +0.2%, Russell -0.6%