
Sample Category Title
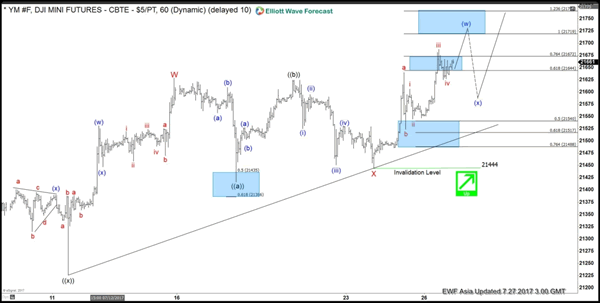
Elliott Wave View: Dow Futures
Short term YM_F (Dow E-Mini Future) Elliott Wave view suggests the rally from 6/29 low is unfolding as a double three Elliott wave structure and ended with Minor wave W at 21628. Down from there, Minor wave X pullback unfolded as a running Elliott Wave flat. Minute wave ((a)) ended at 21457, Minute wave ((b)) ended at 21624, and Minute wave ((c)) of X ended at 21444. Index has since made a new high suggesting the next leg higher has started. Up from 21444 low, Sub Minutte wave a ended at 21640. And Sub Minutte wave b pullback ended at 21524, while above there expect Index to extend higher again.
Near term focus remains towards 21719-21769 100%-123.6% extension area from 21444 low to end the Minutte wave (w) higher. The index then has scope to see a pullback, which should then find buyer’s again in sequence of 3, 7 or 11 swings for further upside provided the pivot at 21444 low remains intact. We don’t like selling the Index and favors buying the dips against 21444 low in the first degree. If pivot at 21444 low fails, then the move higher from 6/29 (21138) can be seen as a 5 waves diagonal. In this case, Index should pullback in 3, 7, or 11 swing to correct cycle from 6/29 low before the rally resumes.
Dow E-Mini Future 1 Hour Elliott Wave View
Polish Zloty Remains Firmly Bullish As The USD Crumbles
Key Points:
- The PLNUSD has been powering higher over recent weeks.
- Technically, the pair is well placed to rally further.
- USD weakness will only help to spur the bulls into action.
Just for something different, we are looking at the Polish Zloty today as the currency has been making some solid gains on the greenback and it looks as though it could extend further still. Indeed, this exotic cross has been powering higher over the past few months – on par with even the Swiss Franc's solid performance.
From a technical perspective, it's easy to see why further gains are expected for this highly bullish pair. As shown below, the EMA bias is in the most bullish configuration possible and in little danger of seeing a shift in momentum any time soon. Additionally, momentum indicators such as the ADX are certainly suggesting that a very strong trend is in play which means it would likely take a decent fundamental upset to slow the accent.
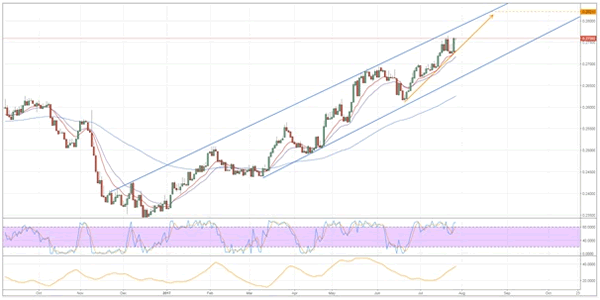
What's more, whilst it is currently bearish, the parabolic SAR reading is on the cusp of inverting to bullish which could mean that we don't see the pair cool off for some time. Instead, we could see yet another push higher before the PLNUSD decides to return to the downside of the channel. Of course, this largely makes sense as the pair hasn't managed to fully test the upside constraint of the broader ascending channel since May.
If we do continue to see the pair advance, the Zloty could eventually reach as high as the 0.2821 mark over the next few weeks. At this point, there is a very distinct chance that it will be highly oversold and in need of a slip back to support. Exactly how far it will stumble is not yet clear, nevertheless, it should be able to hold above the 0.2750 level without too much trouble.
Ultimately, the outlook is fairly good for the PLNUSD moving forward and we can expect to see it enjoy the market's favour. This will especially be the case as the USD remains besieged by negative sentiment stemming from political turmoil in the US and recently refreshed concerns that the Fed cannot deliver on its long-touted rate hikes.
Market Update – Asian Session: Broad Dollar Weakness Reigns
Asia Summary
Equities markets in the region opened generally higher absorbing the Fed rate decision in stride. Earnings season is now in full swing around the globe with Nintendo in Japan putting out strong results after the close yesterday, in Korea Samsung Electronics reported final Q2 results a bit higher than prelim. The dollar saw a broad sell off over the session, with the biggest moves coming about mid-day. EUR/USD rose to 1.1777, AUD/USD 0.8066 and USD/JPY tested 110.78. Korea's won gained 1% against the USD, while copper held steady around a 2-year high in London as markets process China's scrap import ban.
The PBOC shifted its OMO to using just 7-days, dropping its use of 14-day reverse repos, operations were small with a total net injection of CNY20B. Chinese press said that China is exploring a multi-tiered reserve requirement system in order to address liquidity strains. Offshore yuan nearly reached a 2-month high. Markets were little impacted by economic data in the session.
Key economic data
(BR) BRAZIL CENTRAL BANK (BCB) CUTS SELIC TARGET RATE BY 100BPS TO 9.25%; AS EXPECTED
(KR) SOUTH KOREA Q2 PRELIM GDP Q/Q: 0.6% V 0.6%E; Y/Y: 2.7% V 2.7%E
(CN) CHINA JUN SWIFT GLOBAL PAYMENTS (CNY): 1.98% V 1.6% PRIOR
(JP) Japan investors net bought ¥1.18T in foreign bonds v bought ¥947B in prior week; Foreign investors net bought ¥292B in Japan stocks v bought ¥377B in prior week
(AU) AUSTRALIA Q2 IMPORT PRICE INDEX Q/Q: -0.1% V 0.7%E; EXPORT PRICE INDEX Q/Q: -5.7% V -5.5%E
(CN) CHINA JUN INDUSTRIAL PROFITS Y/Y: 19.1% V 16.7% PRIOR
Speakers and Press
China
(CN) Chinese Academy of Social Sciences (CASS) and former PBOC Adviser Yu: capital outflows are more likely to be a larger source of systemic risk in China than high debt - China press
(CN) China Ministry of Finance (MOFCOM): China to keep increasing imports from US
(CN) Moody's revises outlook on China banking system to stable from negative
Korea
(KR) Intelligence authorities see Kim Jong Un's motorcade near missile site, seen as a sign launch is imminent at missile site in northwestern North Korea
(KR) Bank of Korea (BOK) OfficialChung: consumption and investment led to Q2 GDP growth; see private consumption to continue improving
Japan
(JP) Japan Govt recommends minimum wage increase of 3% or ¥25 to ¥848/hr (same rate as last year)
(JP) Luxury goods brands such as Chanel and Cartier said to raise prices in Japan in Aug due to FX rate shifts - Nikkei
Other
(TW) Taiwan and US to focus on medical sector in trade talks - Taiwan press
Asian Equity Indices/Futures (00:00ET)
Nikkei +0.2%, Hang Seng +0.5%, Shanghai Composite -0.3%, ASX200 +0.3%, Kospi +0.2%
Equity Futures: S&P500 +0.2%; Nasdaq +0.5%, Dax +0.1%, FTSE100 +0.2%
FX ranges/Commodities/Fixed Income (00:00ET)
EUR 1.1776-1.1721; JPY 111.22-110.78; AUD 0.8065-0.7992; NZD 0.7558-0.7517
Aug Gold +1.2% at 1,264/oz; Sept Crude Oil -0.1% at $48.69/brl; Sept Copper +0.2% at $2.88/lb
USD/CNY *(CN) PBOC SETS YUAN REFERENCE RATE AT 6.7307 V 6.7529 PRIOR
(NZ) New Zealand sells NZ$150M in 3.5% 2033 bonds; avg yield 3.2996%
(CN) China PBOC OMO injects CNYB in 7 day reverse repos v CNY130B in 7 and 14 day prior
(JP) Japan MoF sells ¥400.1B v ¥400B indicated in 2-yr 0.1% (prior 0.1%) JGBs; Avg yield: -0.1150% v -0.103% prior; bid to cover: 5.35x v 6.79x prior
Equities notable movers
Hong Kong/China
Sands China, 1928.HK Reports Q2 Net profit $326M v $237M y/y, Rev $1.82B v $1.48B y/y; -0.3%
Dongfang Electric ,1072.HK Guides H1 Net CNY370M; +7.6%
Japan
Nintendo, 7974.JP Reports Q1 Net ¥21.3B v ¥7.6Be; Op ¥16.2B v ¥10.6Be; Rev ¥154.1B v ¥62.0B y/y; +7.1%
Korea
Samsung Electronics,005930.KR Reports final Q2 (KRW) Net 10.8T v 9.8Te; Op 14.07T v 14.0T prelim; Rev 61.0T v 60.0T prelim; to buy back KRW1.67T of shares; flat
Other
United Microelectronics, UMC Reports Q2 net (NT$) 2.10B v 1.27Be, Rev 37.5B v 37.0B y/y; -8.1%
US markets on close: Dow +0.5%, S&P500 flat, Nasdaq +0.2%, Russell -0.6%
FX Market s’ Predisposition To Buy EUR/USD
FX Market s' Predisposition To Buy EUR/USD
Market Movers Today
In the euro area, the most important data release today is money supply and private sector bank lending. In June, lending to households and non-financial corporations continued their upward t rend, meaning t he ECB's accommodative monetary policy is feeding through to the private sect or. This should eventually generate higher inflation but t he ECB's is being challenged current ly by a stronger euro, which is a strong headwind to inflation.
US core capital goods orders are due for release and consensus is for another modest increase. Over the past months, the figure has disappointed, implying that fixed investments growth did not look like a strong contributor to GDP growth in Q2. As private consumption is also growing at a slower pace than anticipated, this paints a more modest picture for GDP growth than we had expected.
In scandi markets, we will get the release of the Norwegian LFS and Swedish unemployment rates together with the Swedish Economic Tendency Survey and household lending. Otherwise, focus will remain on Swedish politics.
Selected Market News
As expected, the Fed kept interest rates unchanged yesterday, leaving all eyes on the statement. Overall, our interpretation of the statement was that it was a little dovish even if we did not get that much new information apart from two phrases. The first was on the process of unwinding the balance sheet , which may st art ‘relatively soon' instead of ‘this year', which in fact is not new as it reflects the choice of words Fed Chair Janet Yellen used during the press conference in June. More significantly, the Fed stated t hat inflation is now running ‘below' 2% (before ‘somewhat below'), which supported FX market s' predisposition to buy EUR/USD, sending the cross above the multi-year top from 2015. Overall, we think the Fed statement supports our call that the Fed will make an announcement on quantitative tightening at the next meeting in September and on the back of a strong belief in the Phillips curve, st ill hike rates in December. Importantly, we think risks are skewed towards the Fed pausing its hiking cycle further into 2018. For more information, see our full FOMC review here.
Yesterday's EIA data showed a larger-than-expected drop in US oil inventories, which aided Brent crude temporarily above USD 51/bbl for the first time since early June. The rebound in the oil price has supported the traditional oil currencies including the NOK. Despite the latest NOK rally, however, we see positioning, technicals and short -term valuation as increasing headwinds. As such, even if we remain medium- to long-term bullish on the NOK, we do see a risk of a temporary setback over the next month.
In Sweden, the four Alliance Parties said they will request a vote of confidence for three of the Red/Green governments SDP ministers (infrastructure, interior and defence) because of their wrong handling of the IT scandal in the Swedish Transport Agency, which has had big implicat ions for possible leaks about national security. The ministers have also been criticised for not giving this information to the Riksdag. Prime Minister Stefan Lövfven has announced a press conference today at 10:00 CET. He basically has four opt ions: (1) to dismiss the three ministers, (2) to dismiss the infrastructure minister but let the other two stay (supported by the Left Party), (3) to announce an elect ion and (4) the government resigns, letting the Riksdag speaker look for a government constellation (could be the same, could be a new). None of these are particularly appealing. Either way, we see no reason for a significant market reaction.
Aussie Dollar Trading On A Stronger Footing In The Asian Session
For the 24 hours to 23:00 GMT, the AUD rose 0.71% against the USD and closed at 0.7996.
LME Copper prices climbed 1.4% or $88.0/MT to $6238.0/MT. Aluminium prices rose 0.8% or $15.5/MT to $1912.0/MT.
In the Asian session, at GMT0300, the pair is trading at 0.8048, with the AUD trading 0.65% higher against the USD from yesterday's close.
Earlier today, data showed Australia's import price index unexpectedly eased 0.1% QoQ in 2Q 2017, compared to an advance of 1.2% in the previous quarter and defying market consensus for a gain of 0.7%. Moreover, the nation's export price index fell more-than-expected by 5.7% on a quarterly basis in 2Q 2017, compared to a revised rise of 8.8% in the previous quarter.
Elsewhere, in China, Australia's largest trading partner, industrial profits rose 19.1% an annual basis in June, after recording a rise of 16.7% in the prior month.
The pair is expected to find support at 0.7934, and a fall through could take it to the next support level of 0.7819. The pair is expected to find its first resistance at 0.8107, and a rise through could take it to the next resistance level of 0.8165.
The currency pair is trading above its 20 Hr and 50 Hr moving averages.

Euro Trading Higher, Ahead Of Germany’s GfK Consumer Confidence Data
For the 24 hours to 23:00 GMT, the EUR rose 0.71% against the USD and closed at 1.1729.
In economic news, Italy's consumer confidence index unexpectedly advanced to a level of 106.7 in July, compared to market expectations of a fall to a level of 106.2. In the prior month, the index had registered a reading of 106.4.
On the other hand, French consumer confidence index surprisingly dropped to a level of 104.0 in July, after rising to a decade high level of 108.0 in the prior month, while markets expected the index to record an unchanged reading.
The greenback lost ground against a basket of major currencies, after the Federal Reserve (Fed) hinted that it may start rolling back its $4.5 trillion balance sheet as soon as September and expressed concerns on subdued inflation.
The Federal Open Market Committee (FOMC) decided to leave interest rates unchanged, keeping its overnight lending rate at 1.00% to 1.25% as it remained slightly concerned about recent inflation trends. However, the central bank stated that it expects to start winding down its massive balance sheet “relatively soon”, provided that the economy evolves broadly as anticipated.
On the macro front, new home sales in the US climbed 0.8% on a monthly basis, to a level of 610.0K in June, while investors had anticipated for it to rise to a level of 615.0K. New home sales had registered a revised reading of 605.0K in the previous month. Moreover, the nation's MBA mortgage applications rose 0.4% in the week ended 21 July 2017, after recording a gain of 6.3% in the previous week.
In the Asian session, at GMT0300, the pair is trading at 1.1745, with the EUR trading 0.14% higher against the USD from yesterday's close.
The pair is expected to find support at 1.1656, and a fall through could take it to the next support level of 1.1567. The pair is expected to find its first resistance at 1.1791, and a rise through could take it to the next resistance level of 1.1837.
Going ahead, investors will look forward to Germany's GfK consumer confidence index for August, slated to release in a few hours. Additionally, in the US, initial jobless claims as well as flash durable goods orders, advance goods trade balance and flash wholesale inventories, all for June, slated to release later in the day, will keep investors on their toes.
The currency pair is trading above its 20 Hr and 50 Hr moving averages.

UK’s Economic Growth Slightly Faster In The Second Quarter Of 2017
For the 24 hours to 23:00 GMT, the GBP rose 0.66% against the USD and closed at 1.3116.
Macroeconomic data indicated that Britain's preliminary gross domestic product (GDP) advanced 0.3% on a quarterly basis in the second quarter of 2017, meeting market expectations and compared to an advance of 0.2% in the prior quarter, suggesting that Brexit continues to damage the nation economically and politically.
Meanwhile, the nation's BBA mortgage approvals dropped less-than-anticipated to a level of 40.2K in June, compared to a revised level of 40.3K in the prior month, while markets anticipated it to ease to a level of 40.0K.
In the Asian session, at GMT0300, the pair is trading at 1.3144, with the GBP trading 0.21% higher against the USD from yesterday's close.
The pair is expected to find support at 1.3046, and a fall through could take it to the next support level of 1.2949. The pair is expected to find its first resistance at 1.3195, and a rise through could take it to the next resistance level of 1.3247.
Moving ahead, traders will look forward to Britain's GfK consumer confidence index for July, slated to release overnight.
The currency pair is trading above its 20 Hr and 50 Hr moving averages.

Japanese Yen Extends Its Gains In The Asian Session
For the 24 hours to 23:00 GMT, the USD declined 0.64% against the JPY and closed at 111.16.
Macroeconomic data revealed that Japan's small business confidence index registered a rise to a level of 50.0 in July, exceeding market expectations for an advance to a level of 49.8. In the previous month, the index had registered a reading of 49.2.
In the Asian session, at GMT0300, the pair is trading at 110.89, with the USD trading 0.24% lower from yesterday's close.
The pair is expected to find support at 110.45, and a fall through could take it to the next support level of 110. The pair is expected to find its first resistance at 111.77, and a rise through could take it to the next resistance level of 112.64.
Looking ahead, Japan's jobless rate, national consumer price index, retail trade and large retailers' sales, all for June, slated to release overnight, will be on investors' radar. Additionally, a summary of opinions of the Bank of Japan's July meeting, will also be eyed by traders.
The currency pair is trading below its 20 Hr and 50 Hr moving averages.

Switzerland’s ZEW Expectations Index Advanced In July
For the 24 hours to 23:00 GMT, the USD declined 0.13% against the CHF and closed at 0.9515.
In economic news, data indicated that Switzerland's ZEW economic expectations index climbed to a level of 34.7 in July. In the prior month, the index had registered a reading of 20.7. Moreover, the nation's UBS consumption indicator rose to a level of 1.38 in June, compared to a revised level of 1.32 in the prior month.
In the Asian session, at GMT0300, the pair is trading at 0.9506, with the USD trading 0.09% lower against the CHF from yesterday's close.
The pair is expected to find support at 0.9472, and a fall through could take it to the next support level of 0.9437. The pair is expected to find its first resistance at 0.9568, and a rise through could take it to the next resistance level of 0.9629.
The currency pair is trading below its 20 Hr moving average and showing convergence with its 50 Hr moving average

Loonie Trading Higher This Morning
For the 24 hours to 23:00 GMT, the USD declined 0.46% against the CAD and closed at 1.2453.
In the Asian session, at GMT0300, the pair is trading at 1.2434, with the USD trading 0.15% lower against the CAD from yesterday’s close.
The pair is expected to find support at 1.2384, and a fall through could take it to the next support level of 1.2334. The pair is expected to find its first resistance at 1.2514, and a rise through could take it to the next resistance level of 1.2594.
In absence of any macroeconomic releases in Canada today, investor sentiment will be governed by global macroeconomic factors.
The currency pair is trading below its 20 Hr and 50 Hr moving averages.
