
Sample Category Title
USD/JPY Daily Outlook
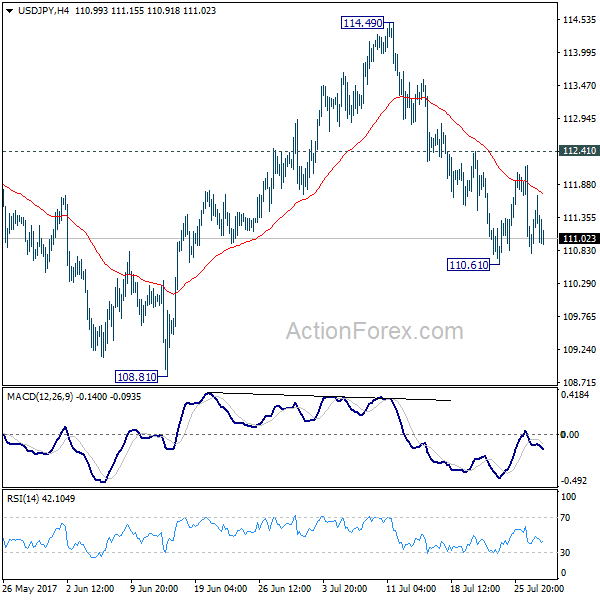
Daily Pivots: (S1) 110.79; (P) 111.25; (R1) 111.72; More...
Intraday bias in USD/JPY remains neutral as it's staying in consolidation above 110.61 temporary low. With 112.41 intact, further decline is expected. Below 110.61 will target 108.81. Break there will resume whole correction from 118.65 and target 61.8% retracement of 98.97 to 118.65 at 106.48. Nonetheless, break of 112.41 will dampen this bearish view and turn focus back to 114.49 resistance instead.
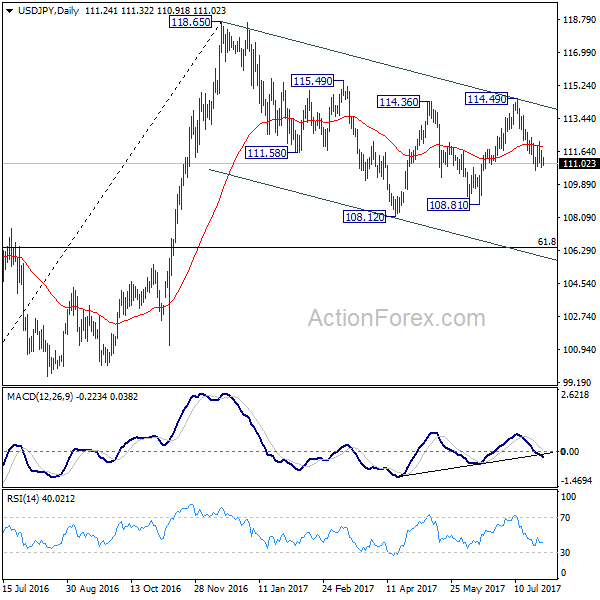
In the bigger picture, the corrective structure of the fall from 118.65 suggests that rise from 98.97 is not completed yet. Break of 118.65 will target a test on 125.85 high. At this point, it's uncertain whether rise from 98.97 is resuming the long term up trend from 75.56, or it's a leg in the consolidation from 125.85. Hence, we'll be cautious on topping as it approaches 125.85. If fall from 118.65 extends lower, down side should be contained by 61.8% retracement of 98.97 to 118.65 at 106.48 and bring rebound.
USD/CHF Daily Outlook
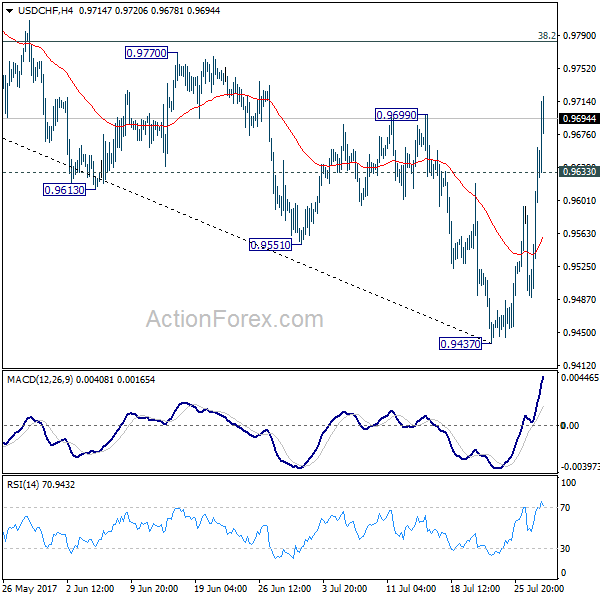
Daily Pivots: (S1) 0.9538; (P) 0.9600; (R1) 0.9709; More...
USD/CHF's rebound from 0.9437 accelerated to as high as 0.9720 so far. The break of 0.9699 resistance now suggests that it has bottomed at 0.9437 after defending 0.9443 key support level. This is also supported by bullish convergence condition in daily MACD. Intraday bias is on the upside for 38.2% retracement of 1.0342 to 0.9437 at 0.9783 first. Break will target channel resistance (now at 0.9912). On the downside, below 0.9633 minor support will turn intraday bias neutral and bring consolidations first.
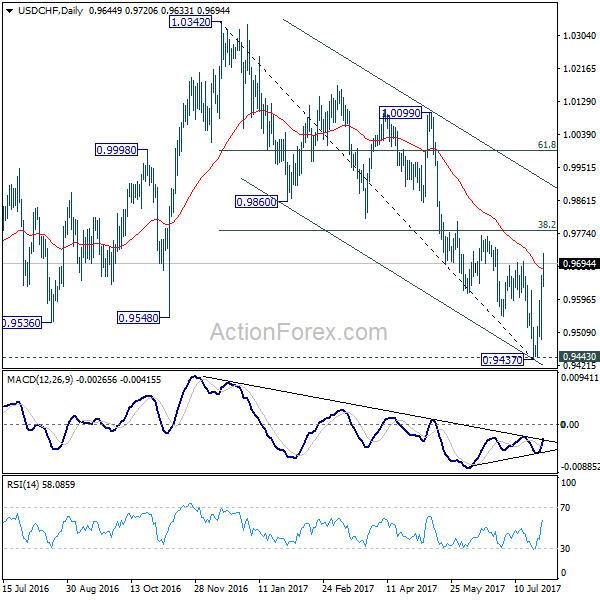
In the bigger picture, current development argues that USD/CHF has successfully defended 0.9443 key support level. And long term range trading in 0.9443/1.0342 is extending with another rising level. At this point, there is no sign of an up trend yet. Hence, while further rise is expected in USD/CHF, we'll start to be cautious on loss of momentum above 61.8% retracement of 1.0342 to 0.9437 at 0.9996.
Franc Weakness Continues as Focus Turns to US Q2 GDP
Selloff in Swiss Franc continued overnight and weakness extends into Asian session. EUR/CHF is trading up over 300 pts, or 2.75% for the week. As we noted before, the strong break of 1.12 handle is now setting up the stage for EUR/CHF to head back to prior SNB floor at 1.2. USD/CHF's break of 0.9699 resistance also argues that the down trend from 1.0342 has completed and reversed after defending 0.9443 key support level. Oversold condition could start to limit selling in the Swiss Franc and we might see Franc crosses slow down a little bit before ending the week. Focus will be turned back to US with Q2 GDP data featured.
Japan national CPI core unchanged at 0.4% yoy
A bunch of economic data is released from Japan today. National CPI core was unchanged at 0.4% yoy in June. Tokyo CPI core rose to 0.2% yoy in July, up from 0.0% yoy and beat expectation of 0.1% yoy. Unemployment rate dropped to 2.8% in June versus expectation of 3.0%. Household spending rose 2.3% yoy, retail sales rose 2.1% yoy. Core inflation remained well below BoJ's 2% target. Indeed, the central bank has lowered inflation forecast for the current fiscal year to 1.1% and pushed back the timing for hitting the target by a year. And the summary of opinions of the July meeting also showed that one member is concerned that repeated delays would hurt BoJ's credibility. Based on current outlook, there is little chance for BoJ to follow other major global central banks to start exiting from stimulus.
Also released in Asian session, Australia PPI rose 0.5% qoq, 1.7% yoy in Q2. UK Gfk consumer confidence dropped to -12 in July.
US GDP to watch today
US GDP data will be the main focus for today. The US economy is expected to grow 2.5% annualized in Q2, a notable rebound from Q1's sluggish 1.4% growth. GDP price index, however is expected to slow to 1.3%. US will also release Q2 employment cost index. Dollar has been under selling pressure after the dovish FOMC statement. But that just confirmed markets view that Fed is concerned with the slowdown in inflation. And it will likely opt for starting to shrinking the balance sheet first in September. Fed will hold its card on rate hike and do it in December after seeing a few more months of data.
The dollar index is staying weak with recent fall from 103.82 still on course for 91.91 key support level. But for the moment, downside is held by the medium term channel support, indicating no further acceleration. There is prospect for a rebound should today's GDP data meets expectations.
Elsewhere, France will also release Q2 GDP in European session. German CPI, Eurozone confidence indicators and Swiss KOF will be featured. Canada will also release GDP.
USD/CHF Daily Outlook
Daily Pivots: (S1) 0.9538; (P) 0.9600; (R1) 0.9709; More...
USD/CHF's rebound from 0.9437 accelerated to as high as 0.9720 so far. The break of 0.9699 resistance now suggests that it has bottomed at 0.9437 after defending 0.9443 key support level. This is also supported by bullish convergence condition in daily MACD. Intraday bias is on the upside for 38.2% retracement of 1.0342 to 0.9437 at 0.9783 first. Break will target channel resistance (now at 0.9912). On the downside, below 0.9633 minor support will turn intraday bias neutral and bring consolidations first.
In the bigger picture, current development argues that USD/CHF has successfully defended 0.9443 key support level. And long term range trading in 0.9443/1.0342 is extending with another rising level. At this point, there is no sign of an up trend yet. Hence, while further rise is expected in USD/CHF, we'll start to be cautious on loss of momentum above 61.8% retracement of 1.0342 to 0.9437 at 0.9996.
Economic Indicators Update
| GMT | Ccy | Events | Actual | Forecast | Previous | Revised |
|---|---|---|---|---|---|---|
| 23:01 | GBP | GfK Consumer Confidence Jul | -12 | -11 | -10 | |
| 23:50 | JPY | BOJ Summary of Opinions July Meeting | ||||
| 23:30 | JPY | National CPI Core Y/Y Jun | 0.40% | 0.40% | 0.40% | |
| 23:30 | JPY | Tokyo CPI Core Y/Y Jul | 0.20% | 0.10% | 0.00% | |
| 23:30 | JPY | Jobless Rate Jun | 2.80% | 3.00% | 3.10% | |
| 23:30 | JPY | Household Spending Y/Y Jun | 2.30% | 0.50% | -0.10% | |
| 23:50 | JPY | Retail Trade Y/Y Jun | 2.10% | 2.30% | 2.00% | 2.10% |
| 1:30 | AUD | PPI Q/Q Q2 | 0.50% | 0.60% | 0.50% | |
| 1:30 | AUD | PPI Y/Y Q2 | 1.70% | 1.30% | ||
| 5:30 | EUR | French GDP Q/Q Q2 A | 0.50% | 0.50% | ||
| 7:00 | CHF | KOF Leading Indicator Jul | 106 | 105.5 | ||
| 9:00 | EUR | Eurozone Economic Confidence Jul | 110.8 | 111.1 | ||
| 9:00 | EUR | Eurozone Business Climate Indicator Jul | 1.14 | 1.15 | ||
| 9:00 | EUR | Eurozone Industrial Confidence Jul | 4.3 | 4.5 | ||
| 9:00 | EUR | Eurozone Services Confidence Jul | 13.4 | 13.4 | ||
| 9:00 | EUR | Eurozone Consumer Confidence Jul F | -1.7 | -1.7 | ||
| 12:00 | EUR | German CPI M/M Jul P | 0.20% | 0.20% | ||
| 12:00 | EUR | German CPI Y/Y Jul P | 1.50% | 1.60% | ||
| 12:30 | CAD | GDP M/M May | 0.20% | 0.20% | ||
| 12:30 | USD | GDP (Annualized) Q2 A | 2.50% | 1.40% | ||
| 12:30 | USD | GDP Price Index Q2 A | 1.30% | 1.90% | ||
| 12:30 | USD | Employment Cost Index Q2 | 0.60% | 0.80% | ||
| 14:00 | USD | U. of Michigan Confidence Jul F | 93.1 | 93.1 |
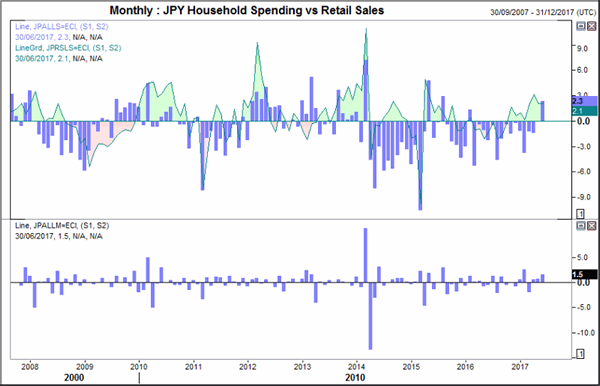
JP Households Reach For Their Wallets
Household spending has been a burden on inflation, so the recent pickup up is good news for the BoJ. Yet for this to be sustained, we need to see an increase in wages which BoJ say institutions are working on initiatives. Meanwhile CHFJPY breaks key support and looks to extend losses.
Household spending was one of the better surprises from today's data set, by expanding by 2.3% YoY to far exceed the 0.6% forecast and -0.1% prior. At 2.3% it is the fastest rate of expansion since August 2015 and has been helped higher by three consecutive monthly gains. In June, spending rose by 1.5%, its fastest increase in 4 months.
Consumer spending is a much-needed lubricant for inflation to pick up. Yet for this to sustain wages need to increase. Whilst wages have not yet materially increased, BoJ reported in the in recent meeting that many companies are looking at initiatives to provide this increase to provide support for the BoJ's 2% inflation target.
Inflation was underwhelming as ever and there is a long way to go to turn this sanguine ship around. Yet baby steps appear to be in the making and all turnarounds must start somewhere.
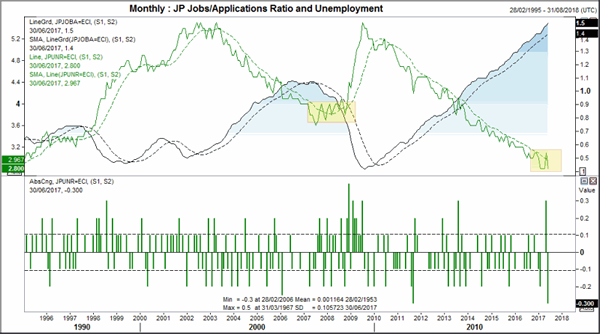
Unemployment dropped by 3 percentage points to remove the 3-point increase in May. Although this takes us to multi-year low and firmly below the 1yr average once more, we'll continue to keep an eye to see if a similar pattern occurs to that of 2007 to 2008. This period saw several crosses around the average before the trend turned and several years of rising unemployment ensued. Of course, we can also argue the famous last words that ‘it's different this time' because this era was the beginning of the GFC.
The job to application rate beat expectations of 1.5 to move to a fresh record high of 1.51. If we are to see this move lower whilst unemployment stutters at the lows then the case for an economic turnaround builds.
The Swiss Franc is in focus for traders after the SNB reiterated that their currency is significantly overvalued despite negative rates remaining in place. This has helped all majors to appreciate against the negative-yielding currency as we expect losses to be sustained into next week.
The weekly chart of CHFJPY is on track for a bearish engulfing candle and currently trades just above the low of the week. The break below 116.43 confirmed a double top pattern which, if successful, projects and an initial target at 114.26, just above the monthly S1. Yet as yesterday's candle was so bearish and the right peak of the double top is relatively small compared with the first peak, we think it may trade beyond this target in due course.
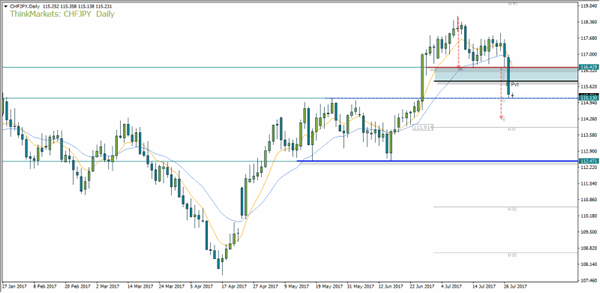
The 8 eMA has crossed below the 21 eMA on D1 to show near-term momentum is increasingly bearish and as they both point lower, near-medium term momentum is also turning bearish. 115.13 is currently holding as support and is likely a pivotal level going forward. The monthly pivot is a sensible place to assume resistance at this point but we can use the zone between the monthly pivot and the original neckline (116.430 as a zone to aid with either entry or stop placement if we seek to fade into rally.
As there are only two trading session left in the month, the pivots will be recalculated at Monday's close which will bring S1 lower. This may make the eventual 112.47 target more achievable.
EUR/USD Erased The Morning Gains
The greenback has managed to increase in the second part of the day and recovered a little after the massive drop. EUR/USD dropped significantly in the afternoon, even if the United States data have come in mixed, but the decrease was somehow expected because the pair was too overbought to continue the upside movement.
The currency pair climbed as much as 1.1776 today, much above the 1.1739 yesterday’s high, has rallied after the FOMC Statement, as you already know, the Federal Reserve has decided to keep the monetary policy unchanged, the Federal Funds Rate remains steady at 1.25%.
The traders were disappointed and have sent the greenback much lower versus all its rivals because there are rumors that said that we may not see another hike this year. Personally, I believe that the FED could take action again if the US data will impress from September.
USD climbed today, even if the Unemployment Claims increased unexpectedly higher in the previous week, from 234K to 244K, more versus the 240K estimate, the Core Durable Goods Orders increased only by 0.2%, less versus the 0.4% estimate and compared to 0.3% growth in the previous reporting period.
The Prelim Wholesale Inventories have surged by 0.6%, more versus the 0.3% estimate, this was bad for the USD.
Personally, I believe that the USD was driven higher by the technical factors today, has received a helping hand also from the Durable Goods Orders, which increased by 6.5% in June, beating the 3.5% estimate and from the Goods Trade Balance, the indicator increased from -66.3B to -63.9B, more compared to the -65.0B estimate.
On the other hand, the Euro wasn’t impressed by the Euro-zone data, the Spanish Unemployment Rate dropped from 18.8% to 17.2% , much below the 17.8% estimate, while the Euro-zone M3 Money Supply increased by 0.5%, matching expectations. The Gfk German Consumer Climate increased from 10.6 to 10.8 points in July, beating the 10.7 estimate, unfortunately the Euro-zone Private Loans have increased only by 2.6%, less versus the 2.7% estimate.
EUR/USD dropped today, but the perspective remains bullish on the Daily chart, remains to see what will happen tomorrow because the US and the Euro-zone are to release significant numbers, so you should keep an eye on the economic calendar to see what will move the price.
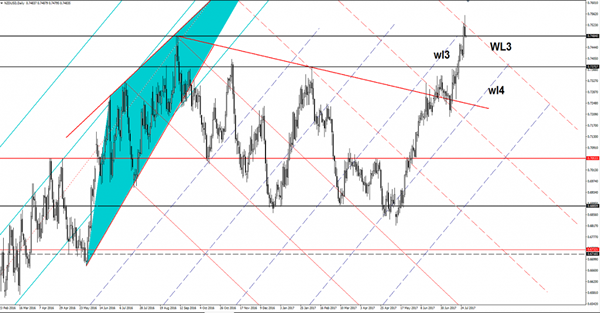
NZD/USD Selling Opportunity?
NZD/USD found strong resistance at the third warning line (WL3) of the former descending pitchfork and now is challenging the 0.7484 static support (resistance turned into support). We may have a selling opportunity if will close below the 0.7484 level and if will retest the warning line (WL3), the first downside target will be at the 0.7375 level.
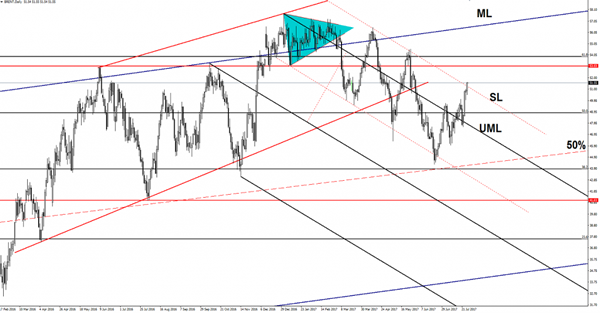
Brent Oil Breakout In Play
Brent rallied and looks determined to take out the dynamic resistance from the outside sliding parallel line (SL), a valid breakout will confirm a further increase towards the 53.03 resistance and towards the 61.8% retracement level. I’ve said in the previous analysis that is expected to increase further and now is trading right above the $51.50 per barrel. Was boosted also by the poor US Crude Levels, the indicator dropped to -7.2M in the previous week, much below the -3.3M estimate.
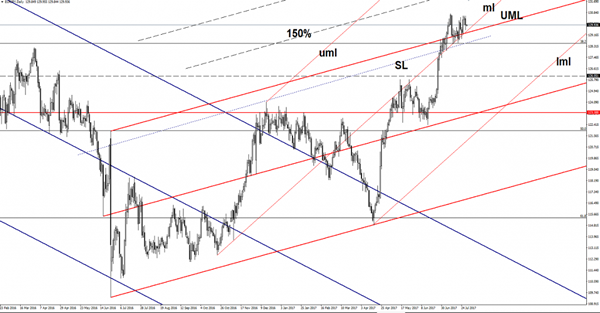
EUR/JPY Still Bullish
The currency pair dropped on Thursday, but continues to stay above important support levels and maintains a bullish perspective on the short term. Is moving somehow sideways on the Daily chart maybe because has tried to recapture more directional energy to be able to climb much higher in the upcoming period.
Is trading near the 129.90 level, but could retest some support level again today, we'll see how will react because the Yen looks undecided on the short term. Yen could increase significantly versus its rivals if the Nikkie stock index will drop in the upcoming days, the index failed once again to close and to stabilize above the 20058 static resistance, a drop towards the 19700 will force the EUR/JPY to decrease as well.
We'll see what impact will have the Japanese data, the Unemployment Rate could decrease from 3.1% to 3.0% in June, while the Retail Sales could increase by 2.3% and could exceed the 2.1% growth in the former reading period. The Tokyo Core CPI could increase by 0.1% in July, more versus the 0.0% in June, the National Core CPI by 0.4%, matching the 0.4% growth in the former reading period. The Household Spending will be released as well and could increase by 0.6% in the previous month after the 0.1% in May.
Price failed to reach the 130.76 previous high and now could come down to retest the median line (ml) of the minor ascending pitchfork and the upper median line (UML) of the major ascending pitchfork. The perspective remains bullish as long as is trading above these levels and above the 38.2% retracement level, we may have a buying opportunity if the support levels will hold, but only if the JP226 will climb and will stabilize above the 20058 level.
The next upside target will be at the 150% Fibonacci line (ascending dotted line), we'll have an important upside momentum if will close above the 130.76 previous high.
USD/CAD Retraces The Entire Daily Bullish Channel Rally
USD traders have been riding the Janet Yellen wave, with the USDX consistently getting clobbered day after day since peaking at the turn of the new year.
Nowhere has this broad USD weakness been felt more than in USD/CAD. Just take a look at the daily chart below.
USD/CAD Daily:
That bullish channel was looking SO good for so long too… But as we know in trading, all good things must come to an end, and when that channel broke, boy has that end been a reality check for the US Dollar!
Price has dropped all the way down to now settle at the horizontal level that formed the very beginning of the channel. Yep, a full 100% retrace.
But now we're here, could this be an opportunity to try and get long? Zoom into the intraday charts and lets have a look at what price action has been doing on the 30 minute chart below.
USD/CAD 30 Minute:
The head and shoulders pattern isn't my personal cup of tea, but it's a pretty obvious inverted one that we have here. Price has bounced so sharply, that it hasn't even been able to pull back into short term areas of previous resistance to turn into support!
The Roller Coaster
The roller coaster
Apprehension and lack of commitment lead to the overnight USD roller coaster.After the powerful response to an FOMC statement that was mostly unchanged other than some minor tweaks on the inflation language, a case of the jitters set in. More so for those that chased the Euro topside and after realising there was nowhere to go but down when momentum stalled, panic ensued after surprisingly strong US economic data.
It was an unexpectedly volatile session that had a bit of everything for everyone, but it was the strong U.S. durable goods data that set the tone for the greenback which enjoyed unusually robust demand. Certainly, the Greenback is not out of the woods just yet but the dollar bulls are seeing some light at the end of the tunnel, and with some significant data around the corner, it might be too early to throw in the towel just yet.
Also, the US dollar was supported by the news that Republicans a statement saying they’re scrapping the border tax proposal
While the overnight dollar move is more likely about positioning rather than a bullish USD revival, a solid GDP print tonight followed up with a robust NFP next Friday should reinforce the Feds telegraphed view that the September balance sheet run off is on as is a rate hike in December.
Euro
The market is obviously long EUR and after the strong US durable good print dealers are left mulling over saturated EURO position knowing there’s a lot of important data to deal with between now and December. After all had been said and done, EURUSD had retraced all its post-Federal Open Market Committee statement gains.
Australian Dollar
The markets decided that the Fed rate path is entirely CPI-dependent and with four consecutive misses on the book and a five just as likely, the Carry trade roared back life. But what the market giveth the market taketh away. The surging US durable good orders has the street now looking for a robust US Q2 GDP, and this pivot has sent an overbought Aussie dollar tumbling overnight