Sample Category Title
USD/CHF Continued Weakness
USD/CHF is pushing lower. Hourly resistance can be found at 0.9696 (09/06/2017 high). Strong resistance is given at 1.0107 (10/04/2017 high). Expected to to show further weakness.
In the long-term, the pair is still trading in range since 2011 despite some turmoil when the SNB unpegged the CHF. Key support can be found 0.8986 (30/01/2015 low). The technical structure favours nonetheless a long term bullish bias since the unpeg in January 2015
EUR/GBP Daily Outlook
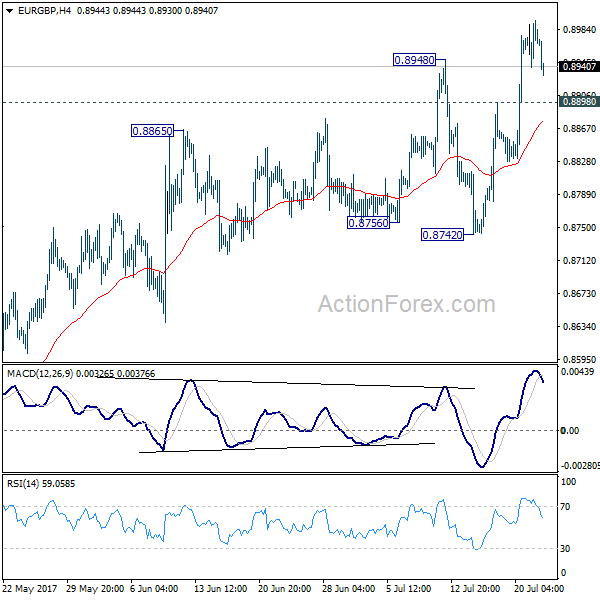
Daily Pivots: (S1) 0.8943; (P) 0.8969; (R1) 0.8998; More
With 0.8898 minor support intact, intraday bias in EUR/GBP remains on the upside first. Current rally would target a test on 0.9304 high. There is no clear sign of up trend resumption yet. Hence, we'll be cautious on strong resistance from 0.9304 to limit upside and bring another fall. On the downside, below 0.8898 minor support will turn intraday bias neutral first. But near term outlook will remain mildly bullish as long as 0.8742 support holds.
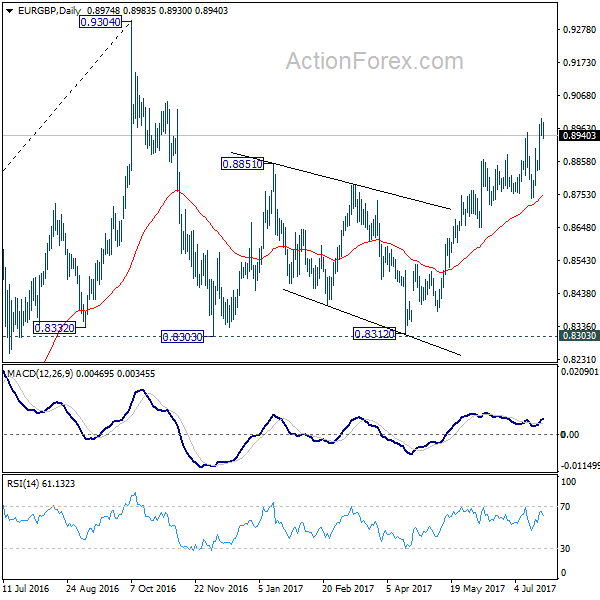
In the bigger picture, price actions from 0.9304 are viewed as a medium term corrective pattern. It's uncertain whether it is finished yet. But in case of another fall, we'd expect strong support from 0.8116 cluster support (50% retracement of 0.6935 to 0.9304 at 0.8120) to contain downside and bring rebound. Whole up trend from 0.6935 is expected to resume after consolidation from 0.9304 completes.
GOLD Bullish Momentum Continues
Gold's is trading higher after the precious metal reached the support given at 1204 10/07/2017 high). Hourly resistance lies at 1258 (23/06/2017 high). Expected to show further strengthening.
In the long-term, the technical structure suggests that there is a growing upside momentum. A break of 1392 (17/03/2014) is necessary ton confirm it, A major support can be found at 1045 (05/02/2010 low)
EUR/AUD Daily Outlook
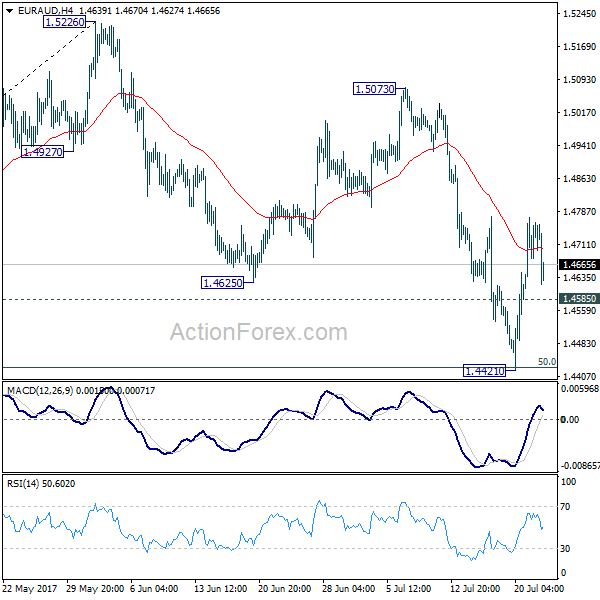
Daily Pivots: (S1) 1.4637; (P) 1.4705; (R1) 1.4801; More...
With 1.4585 minor support intact, intraday bias in EUR/AUD remains on the upside for the moment. Correction from 1.5226 could have completed with three waves down to 1.4421 already. Sustained trading above 55 day EMA (now at 1.4744) will target 1.5073 resistance. Break there will indicate resumption of whole rise from 1.3624. On the downside, below 1.4585 minor support will turn focus back to 1.4421 instead.
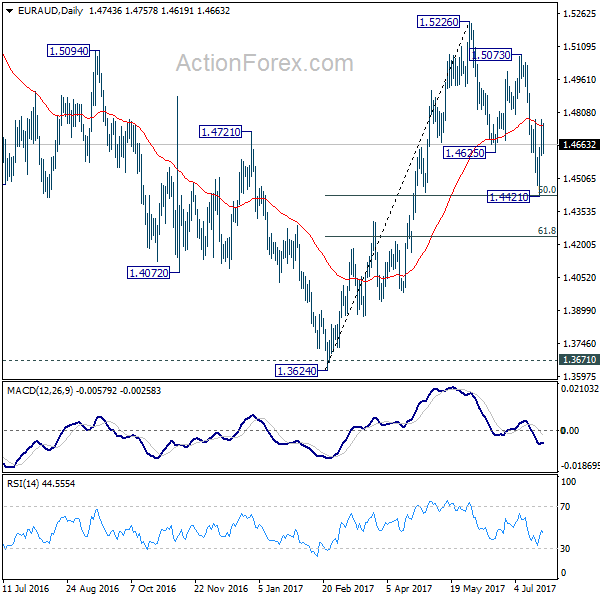
In the bigger picture, we're holding on to the view that corrective decline from 1.6587 medium term has completed at 1.3624. Rise from 1.3624 is expected to resume to retest 1.6587. The corrective structure of the fall from 1.5226 is affirming this view. Above 1.5226 will target a test on 1.6587 key resistance. However, further downside acceleration will dampen our view and would drag EUR/AUD lower to retest key support zone around 1.3624.
EUR/CHF Pushing Higher
EUR/CHF is still trading above psychological level at 1.1000 and the pair is ready to monitor 1.1100. Selling pressures are growing below 1.1100. Hourly support is located at a distance at 1.0922 (30/06/2017 low). Expected to inch higher.
In the longer term, the technical structure is mixed. Resistance can be found at 1.1200 (04/02/2015 high). Yet,the ECB's QE programme is likely to cause persistent selling pressures on the euro, which should weigh on EUR/CHF. Supports can be found at 1.0184 (28/01/2015 low) and 1.0082 (27/01/2015 low).
EUR/GBP Stalling Below 0.9000
EUR/GBP is very volatile. The pair has surged toward 0.9000. Hourly resistance is given at a distance at 0.8742 (16/07/2017 low). Downside risks are important.
In the long-term, the pair has largely recovered from recent lows in 2015. The technical structure suggests a growing upside momentum. The pair is trading above from its 200 DMA. Strong resistance can be found at 0.9500 psychological level.
Technical Outlook: USDJPY – Bears Extend Below Daily Cloud, 110.00 Support In Focus
The pair remains in red on Monday and extends last Friday's strong fall below key supports at 110.97 (Fibo 61.8% of 108.80/114.49 upleg) and 110.74 (daily cloud base). Fresh extension lower confirms firm bearish bias and opens psychological 110.00 support for test. Broken daily cloud now turned to resistance (spanned between 110.74 and 111.23), followed by cluster of broken daily SMA's (laying between and 111.68 and 112.11) marking next strong resistance zone (bear-crosses of 100/200 and 55/200 SMA's have been already formed) and maintaining downside pressure. Close below daily cloud is needed to confirm bears, however, corrective action could be anticipated in the near-term, as slow stochastic on daily chart is oversold.
Res: 110.74, 110.97, 111.23, 111.47
Sup: 110.50, 110.23, 110.14, 110.00
GBP/JPY Daily Outlook
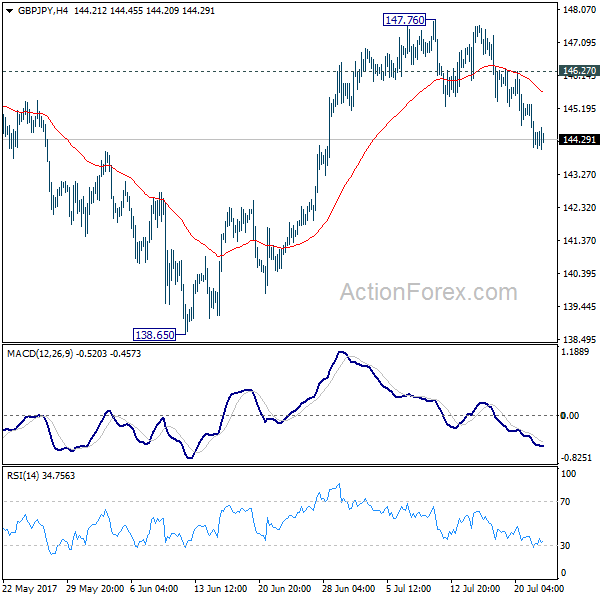
Daily Pivots: (S1) 143.84; (P) 144.59; (R1) 145.12; More
Intraday bias in GBP/JPY remains on the downside as fall from 147.76 is in progress. Sustained trading below 55 day EMA (now at 144.04) will target 138.65 support and below. But we'd expect strong support from 135.58 to contain downside and bring rebound. On the upside, above 146.27 minor resistance will turn bias back to the upside for 147.76 instead.
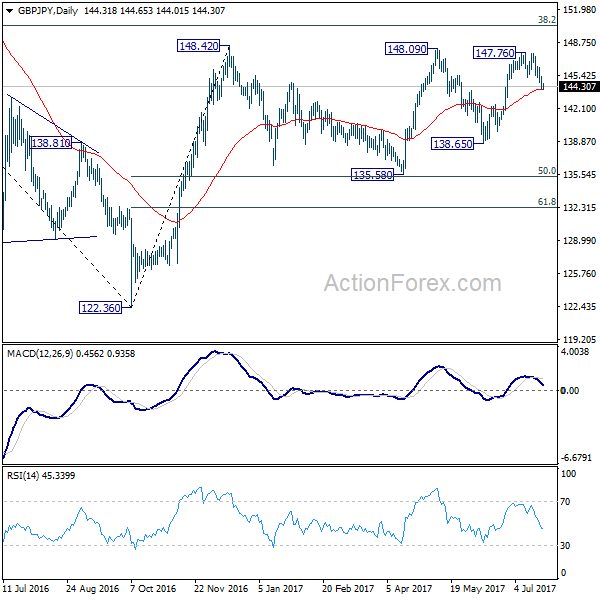
In the bigger picture, rise from medium term bottom at 122.36 is expected to continue to 38.2% retracement of 196.85 to 122.36 at 150.43. Decisive break there will carry long term bullish implications and pave the way to 61.8% retracement at 167.78. In case the sideway pattern from 148.42 extends, we'd be looking for strong support from 135.58 and 50% retracement of 122.36 to 148.42 at 135.39 to contain downside.
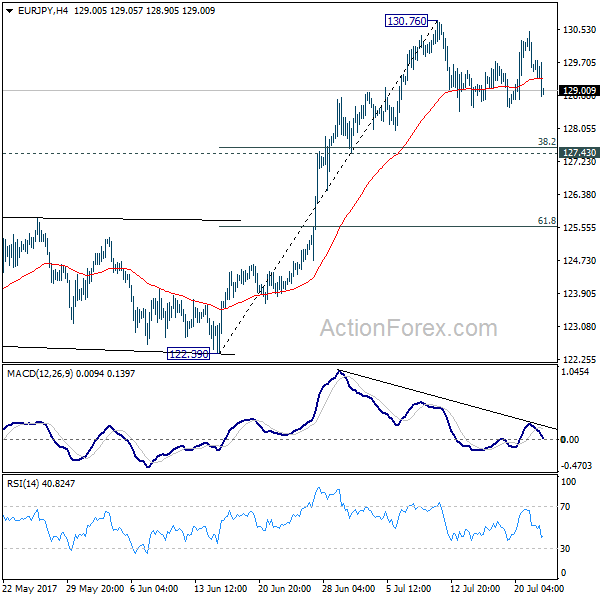
EUR/JPY Daily Outlook
Daily Pivots: (S1) 129.22; (P) 129.86; (R1) 130.23; More...
EUR/JPY is still bounded in consolidation from 130.76 and intraday bias remains neutral. Deeper fall could be seen. But downside should be contained by 127.43 cluster support (38.2% retracement of 122.39 to 130.76 at 127.56) and bring rebound. Above 130.76 will extend the larger rally to next key fibonacci level at 134.20.
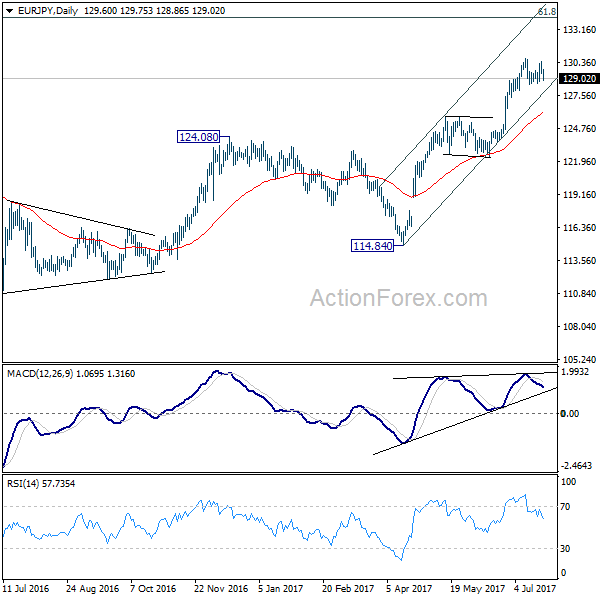
In the bigger picture, the down trend from 149.76 (2014 high) is completed at 109.03 (2016 low). Current rally from 109.03 should be at the same degree as the fall from 149.76 to 109.03. Further rise is expected to 61.8% retracement of 149.76 to 109.03 at 134.20. Sustained break there will pave the way to key long term resistance zone at 141.04/149.76. Medium term outlook will remain bullish as long as 124.08 resistance turned support holds.
USD/JPY Strong Bearish Pressures
USD/JPY still lies in a bearish momentum. Hourly support is given at 110.65 (16/06/2016 low). Stronger support is located at a distance at 108.13 (17/04/2017 low). Expected to show continued bearish pressures.
We favor a long-term bearish bias. Support is now given at 96.57 (10/08/2013 low). A gradual rise towards the major resistance at 135.15 (01/02/2002 high) seems absolutely unlikely. Expected to decline further support at 93.79 (13/06/2013 low).