Sample Category Title
GBP/USD Sideways Price Action
GBP/USD is around the 1.3000 mark. Hourly resistance is given at 1.3126 (16/07/2017 high). Hourly support is given at 1.2933 (20/07/2017 low). Expected to show renewed bearish pressures.
The long-term technical pattern is even more negative since the Brexit vote has paved the way for further decline. Long-term support given at 1.0520 (01/03/85) represents a decent target. Long-term resistance is given at 1.5018 (24/06/2015) and would indicate a long-term reversal in the negative trend. Yet, it is very unlikely at the moment.
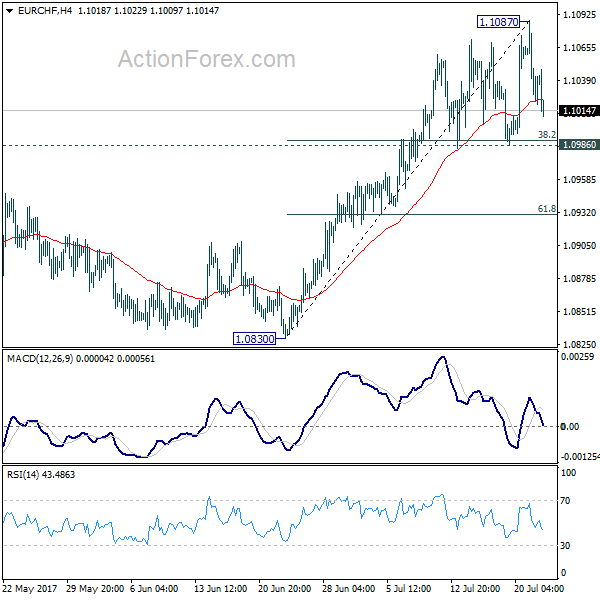
EUR/CHF Daily Outlook
Daily Pivots: (S1) 1.1004; (P) 1.1046; (R1) 1.1070; More...
Intraday bias in EUR/CHF remains neutral for consolidation below 1.1087. At this point, we'd expect downside to be contained by 1.0986 cluster support (38.2% retracement of 1.0830 to 1.1087 at 1.0989) and bring rise resumption. Break of 1.1087 will target key resistance at 1.1127/98. However, break of 1.0986/89 will indicate short term topping, possibly on bearish divergence condition in daily MACD. In such case, deeper fall would be seen back to 55 day EMA (now at 1.0918) and below.
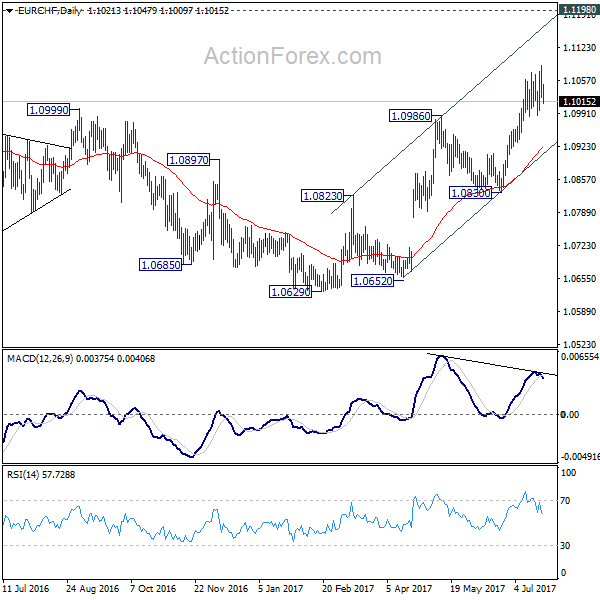
In the bigger picture, the price actions from 1.1198 are seen as a corrective move. Such correction could have completed after defending 38.2% retracement of 0.9771 to 1.1198 at 1.0653. Decisive break of 1.1198 will resume the long term rise from SNB spike low back in 2015. In such case, EUR/CHF could eventually head back to prior SNB imposed floor at 1.2000. We'll favor this bullish case as long as 1.0830 support holds. However, rejection from 1.1198 will extend the multi-year range trading with another fall.
EUR/USD Continued Bullish Momentum
EUR/USD bullish pressures continue. Hourly resistance given at 1.1584 (18/07/2017 high) has been broken. Hourly support can be found at 1.1371 (13/07/2017 high). Stronger support lies at 1.1292 (28/06/2017 low). Expected to show continued bullish pressures.
In the longer term, the momentum is clearly negative. We favour a continued bearish bias towards parity. Key resistance holding at 1.1714 (24/08/2015 high) is on target while strong support lies at 1.0341 (03/01/2017 low).
Euro Edges Lower As Euro, German Mfg. Reports Miss Estimates
The euro has edged lower in the Monday session. Currently, EUR/USD is trading at 1.1650. On the release front, it's a busy day in the eurozone. German and Eurozone Manufacturing PMIs softened in July and missed expectations. In the US, today's key event is Existing Home Sales, which is expected to drop to 5.59 million. On Tuesday, Germany will release Ifo Business Climate and the US publishes CB Consumer Confidence.
Eurozone and German manufacturing PMIs dropped in July, disappointing the markets. Still the indicators point to continuing expansion in the German and eurozone manufacturing sectors. This is a result of stronger global demand for European exports, as well as an improvement in domestic consumer consumption. The euro enjoyed a strong week, gaining 1.6%. Earlier on Monday, EUR/USD touched a high of 1.1684, its highest level since August 2015. On Thursday, the ECB held the course on monetary policy, keeping interest rates at 0.00% and the bank's asset-purchase scheme at EUR 60 billion/month. With no news in the rate statement, the markets focused on the ECB President Mario Draghi's press conference. Draghi sounded upbeat about the eurozone economy, noting there were signs of 'unquestionable improvement' in the eurozone economy. Draghi acknowledged that inflation remains stubbornly low, and said that it was a question of time until the stronger economic conditions pushed inflation to higher levels. As for monetary policy, Draghi said the bank had not set an exact time for revisiting any changes to the current accommodative policy, but added that the ECB would review policy in September. These comments did not seem to break any new ground, but were perceived as hawkish by the markets and boosted the euro on Thursday.
It was another rough week for President Trump. Early in the week, Trump's cherished flagship healthcare proposal, which aims to replace Obamacare, stalled in the Senate after two Republican senators said they would not support the bill. Trump has failed to pass any significant legislation so far in his term, and investors are becoming more skeptical as to whether Trump will have any more success with his tax reform and fiscal spending plans. With the Democrats forming a rock-solid wall of opposition, dissension among Republican lawmakers, many of whom are uneasy about Trump, could doom attempts by the White House to get bills through Congress. There was more bad news as Robert Mueller, the special counsel who is investigating alleged collusion between Trump and Russian officials during the US election, said he would review business transactions involving Trump as well as his associates. Trump has said that Mueller's scope is limited to Russia, so the stage could be set for a Nixon-type showdown between the president and the special counsel investigating wrongdoing by the president.
Foreign Exchange Market Commentary: DAX
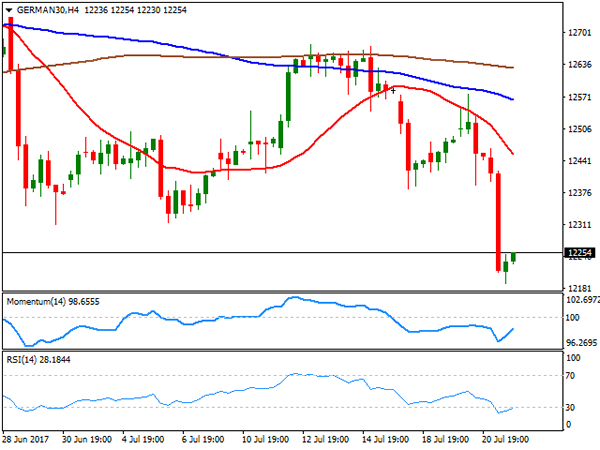
European equities plunged on Friday, amid EUR's strength and local disappointing earnings reports. The German DAX shed 203 points or 1.66%, to settle at 12,240.66, its lowest since late April, with all of the thirteen members closing in the red. Infineon Technologies was the worst performer, shedding 4.53%, followed by Volkswagen that lost 3.93%. The continued strength in the local currency is making local products less competitive worldwide, and further gains in the common currency will likely continue denting local investors' confidence. From a technical point of view, the daily chart shows that the index extended sharply below a bullish 100 DMA for the first time this year, also below a bearish 20 DMA and with technical indicators heading sharply lower within bearish territory. In the 4 hours chart, the index is below all of its moving averages, with the 20 SMA heading south almost vertically, and technical indicators bouncing, but still far below their mid-lines, and far from anticipating a recovery, as the RSI indicator remains at 28.
Support levels: 12,234 12,190 12,153
Resistance levels: 12,278 12,310 12,367
Foreign Exchange Market Commentary: FTSE 100
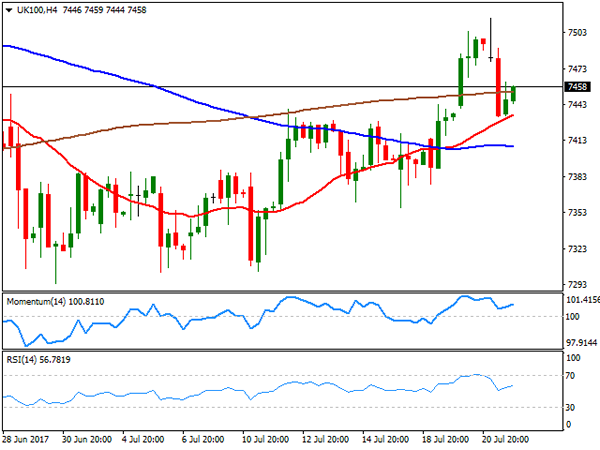
The FTSE 100 closed lower on Friday, down 34 points or 0.47%, at 7,452.91, anyway positive for the week, amid Pound weakness. On the last day of the week, the sour tone of its European counterparts weighed on the index, alongside with falling oil prices that set the energy sector lower. G4S led decliners with a 3.17% loss, followed by Micro Focus International that close down 2.53%. Shire was the best performer, adding 1.86%, followed by ConvaTec that gained 1.66%. From a technical point of view, the daily chart shows that the index held above its 20 and 100 DMAs, both lacking directional strength around 7,390, while technical indicators turned south within positive territory, not enough to confirm a bearish extension ahead. In the 4 hours chart, the index closed a few points above its 200 SMA while the 20 SMA heads higher below the current level, providing a dynamic support around 7,434 and as technical indicators head higher, also limiting chances of a steeper decline.
Support levels: 7,434 7,390 7,351
Resistance levels: 7,482 7,518 7,561
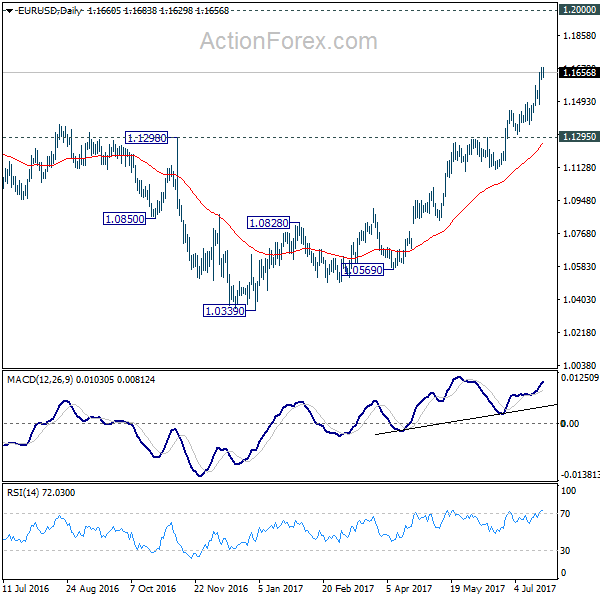
EUR/USD Daily Outlook
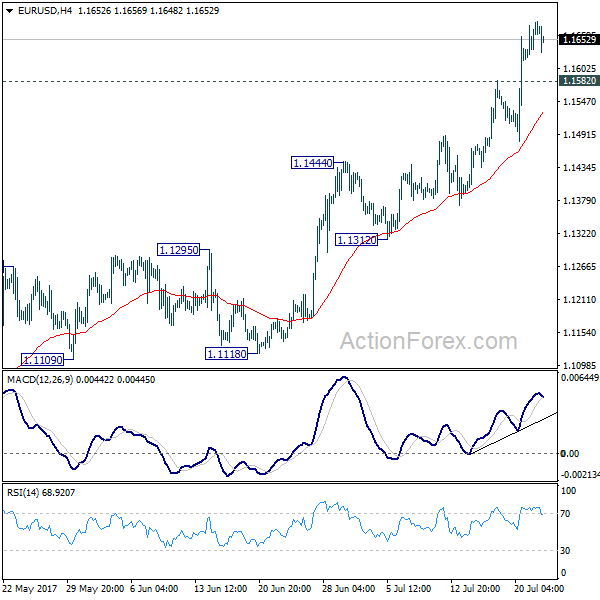
Daily Pivots: (S1) 1.1626; (P) 1.1654 (R1) 1.1691; More...
EUR/USD is losing some upside momentum as seen in 4 hour MACD. But with 1.1582 minor support intact, intraday bias remains on the upside. Current rally would now target 1.2 handle next. On the downside, below 1.1582 minor support will turn intraday bias neutral and bring consolidations. But downside should be contained by 1.1444 resistance turned support and bring rise resumption.
In the bigger picture, an important bottom was formed at 1.0339 on bullish convergence condition in weekly MACD. Sustained break of 55 month EMA (now at 1.1760) will pave the way to key fibonacci level at 38.2% retracement of 1.6039 (2008 high) to 1.0339 (2017 low) at 1.2516. While rise fro 1.0339 is strong, there is no confirmation that it's developing into a long term up trend yet. Hence, we'll be cautious on strong resistance from 1.2516 to limit upside. But for now, medium term outlook will remain bullish as long as 1.1295 support holds, in case of pull back.
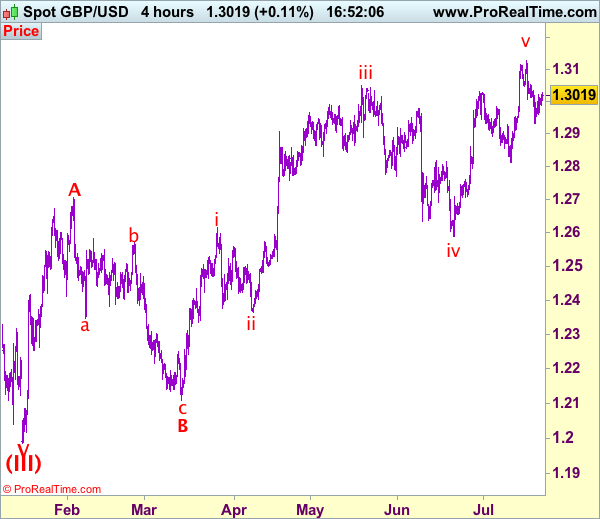
Trade Idea: GBP/USD – Sell at 1.3090
GBP/USD – 1.3043
Recent wave: Wave V of larger degree wave (III) has ended at 1.1986 and major correction has commenced from there for gain to 1.3000 and 1.3140-50
Trend: Near term up
Original strategy :
Sell at 1.3050, Target: 1.2850, Stop: 1.3110
Position: -
Target: -
Stop: -
New strategy :
Sell at 1.3090, Target: 1.2890, Stop: 1.3150
Position: -
Target: -
Stop:-
As cable has rebounded again after brief pullback, suggesting near term upside risk remains for the recovery from 1.2933 (last week’s low) to bring further gain to 1.3062, however, if our view that top has been formed at 1.3126 is correct, upside should be limited to 1.3090-00 and bring another decline later, below 1.2950-55 would signal the rebound from 1.2933 has ended, bring test of this level, break there would add credence to our view and extend the fall from 1.3126 top to 1.2910-15, break there would provide confirmation, then further fall to 1.2870-80 would follow but reckon support at 1.2812 would remain intact, bring rebound later.
Our preferred count on the daily chart is that cable's rebound from 1.3500 (wave (A) trough) is unfolding as a wave (B) with A ended at 1.7043, followed by triangle wave B and wave C as well as wave (B) has ended at 1.7192, the subsequent selloff is the larger degree wave (C) which is still unfolding with minor wave (III) of larger degree wave 3 ended at 1.1986, hence wave (IV) correction is in progress which could either be a triangle wave (IV) of a complex formation but upside should be limited to 1.3500 and price should falter well below 1.4000, bring another decline in wave (V) of 3 for weakness to 1.1500, then 1.1200.
On the upside, whilst further recovery to 1.3062 cannot be ruled out, price should falter below 1.3100 and bring another retreat later. A break above last week’s high of 1.3126 would signal recent upmove is still in progress and may extend headway to 1.3150, then towards 1.3190-00 but loss of upward momentum should limit upside to 1.3250, bring another retreat later.
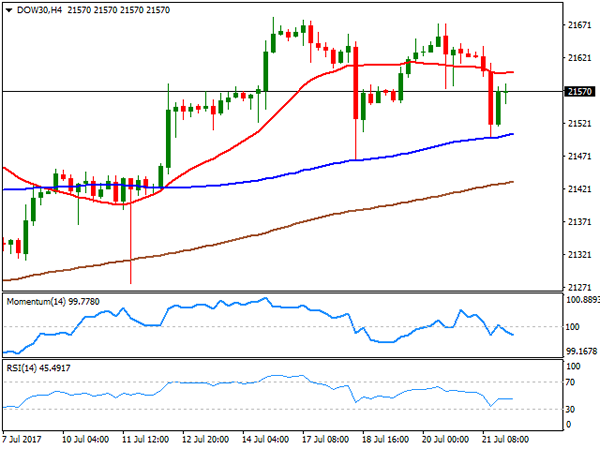
Foreign Exchange Market Commentary: DJIA
US indexes closed in the red on Friday, with the Dow Jones Industrial Average down 31 points, to 21,580.07, the Nasdaq Composite retreating 0.04%, to 6,387.75, and the S&P ending the day 0.04% lower at 2,472.54. Despite Friday's declines, Wall Street ended near fresh all-time highs set earlier in the week, amid solid earnings reports for the second quarter of the year. The Dow, however, ended the week in the red, down roughly 0.30% with most members down on Friday, led by General Electric that lost 2.92% and Chevron that closed 1.32%. The best performer was Visa, up 1.52%, followed by Nike that added 1.44%. The daily chart for the index shows that it has been consolidating, with buying interest surging on approaches to its 20 DMA, currently at 21,500 and technical indicators easing within positive territory, these lasts limiting chances of a bullish move for this Monday. In the 4 hours chart, the scale leans towards the downside, as the Momentum indicator heads south within negative territory, while the RSI consolidates around 45. In this last time frame, the index is below its 20 SMA, but still above a bullish 100 SMA, also in the 12,500 region, with the level being now a critical support.
Support levels: 21,551 21,500 21,464
Resistance levels: 21,599 21,643 21,682
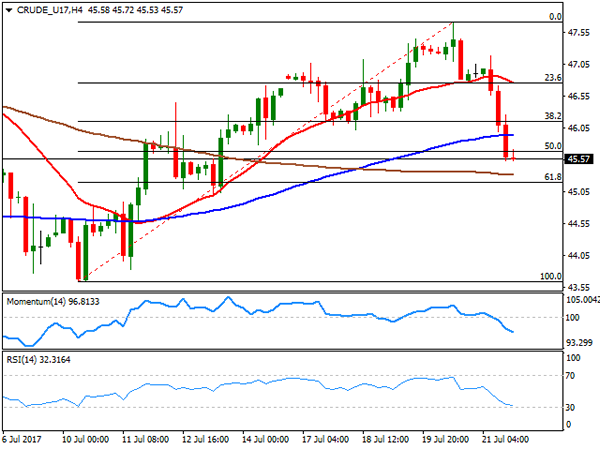
Foreign Exchange Market Commentary: WTI CRUDE
Crude oil prices sunk on Friday, trimming its early week gains and with West Texas Intermediate crude oil futures settling at $45.57 a barrel, on reports indicating that OPEC's output is set to raise this July by 145,000 bpd. The report, issued by Petro-Logistics, came ahead the OPEC and non-OPEC oil ministers' meeting this Monday, when those producers that agreed an output cut last year are set to review the latest developments. In the US, the Baker Hughes report showed that in the week, the number of active rigs drilling for oil fell by 1, to 764. From a technical point of view, the daily chart shows that commodity settled below is 20 SMA, while the Momentum indicator remains flat around its 100 level, but the RSI indicator turned sharply lower, now around 47 anticipating additional declines ahead. Furthermore, WTI settled below the 50% retracement of the latest bullish run, now the immediate resistance at 45.65. In the 4 hours chart, the commodity is also biased lower, as technical indicators maintain their strong downward momentum within negative territory, whilst the 20 SMA gains downward strength above the current level. The immediate support is 45.20, the 61.8% retracement of the mentioned rally.
Support levels: 45.20 44.50 43.80
Resistance levels: 45.90 46.65 47.20