Sample Category Title
USD Stabilises Ahead Of July FOMC Meeting
JPY's rally still has legs
The Japanese has been rally strongly over the last two weeks as investors continued to discount the Fed's hawkish stance. USD/JPY broke the 111 support (psychological level and Fibonacci 61.8% on June-July rally) to the downside. The road is now wide open for further decline with the 109 threshold as first target.
The Federal Reserve will wrap up its July meeting on Wednesday with only an updated statement. We will have to wait the September meeting to get new economic forecast and a press conference. Therefore, it will likely be a non-event as Janet Yellen will surely seize the opportunity to play for time, rather than rushing to tighten monetary policy. Yet, the clock is ticking and postponing further the timeframe would send a negative signal to investors. The September meeting will therefore be the next key event.
In anticipation of this meeting, the market will monitor closely economic data from the US. A reversal in the negative trend of the last few months will quickly trigger into a re-pricing of a solid tightening pace, which would translate into a higher yields and stronger dollar. In the meantime, even though we think that the dollar's debasement has reached its limit against several of its peers, the Japanese yen still has room to appreciate, thanks to its safe-haven status.
US: demand for housing keeps increasing
The US real estate market keeps on growing very significantly. One key indicator of the US economy, existing homes sales keep increasing and are now at 2007 level. Today will be released June data and should remain around May levels at all time high! The million dollar question is now to know whether the US real estate market is in a bubble and when it is going to burst. Like the US stock markets, real estate market has been largely underpinned by free money provided by the Fed over the last decade.
On top of that, house prices levels are above the 2007 level. There is no evidence at the moment that we reached an inflection point and we may see higher prices. Yet, we already heard concern about asset valuation from the Fed regarding… stocks. Nonetheless, the “surprising” recent dovish comment from Yellen paves the way for more patience. In particular, the US debt level is way too high and inflation way too low to increase rates. But markets do not seem to worry about those levels.
We remain bullish on the EURUSD at least until September. Markets estimate that the ECB will hint at further tightening and will follow the Fed path. In our view, there is some room for more EURUSD dollar increase.
Technical Outlook: EURUSD – Limited Dips But Targets At 1.1713/35 Stay Intact For Now
The Euro eased to 1.1630 on Monday, after retesting Friday's post ECB rally's peak, but initial 1.1700 barrier stays intact for now. Dip was boosted by weaker than expected EU PMI numbers, but corrective pullback remains shallow, as weak dollar continues to underpin. Hourly studies remain in bullish mode, with rising hourly cloud (spanned between 1.1612 and 1.1577) offering solid support and underpinning near-term action. Overbought daily studies so far did not generate negative signal and keep downside threats minimized for now. Extended consolidation ahead of attack at key double-Fibonacci barriers at 1.1713/35 could be anticipated, as markets are looking for further signals from Fed on Wednesday. Extended dips would face good supports at 1.1564 (Fibo 38.2% of 1.1370/1.1684) and 1.1490 (Fibo 61.8%) which is expected to contain and prevent deeper dips on break here and 1.1454 (20SMA). Eventual break above 1.1713/35 pivots would trigger fresh upside for extension of current wave C (from 1.1312 trough) towards its FE 138.2% at 1.1770 and FE 161.8% at 1.1848.
Res: 1.1684, 1.1700, 1.1713, 1.1735
Sup: 1.1630, 1.1612, 1.1577, 1.1564
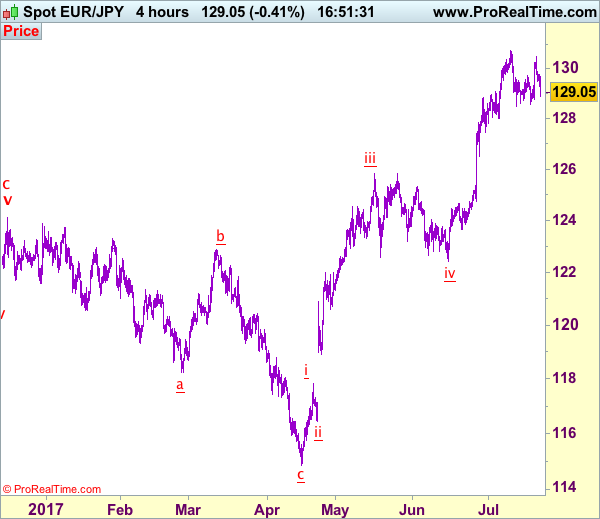
Trade Idea: EUR/JPY – Stand aside
EUR/JPY - 129.01
Recent wave: wave v of (C) ended at 94.12 and major correction in wave A has ended at 149.79
Trend: Near term up
New strategy :
Stand aside
Position: -
Target: -
Stop:-
Although the single currency staged a stronger-than-expected to 130.51 late last week, the subsequent retreat has retained our view that further consolidation below recent high of 130.77 and test of 128.57 support cannot be ruled out, however, break of support at 128.49 is needed to retain bearishness and bring retracement of recent upmove to 128.00, then towards previous support at 127.44.
On the upside, whilst recovery to 129.60-70 cannot be ruled out, reckon 130.00 would limit upside and resistance at 130.51 should hold, bring another decline later. Only a break of 130.51 would signal the retreat from 130.77 has ended, bring retest of this level, break there would confirm recent upmove has resumed for headway to 131.00-10, then towards 131.50, however, loss of upward momentum should prevent sharp move beyond latter level and reckon 132.00 would hold from here, risk from there is seen for a retreat later.
Our latest preferred count is that wave (ii) is ABC-X-ABC which ended at 123.33 and wave (iii) is unfolding with wave iii ended at 100.77, followed by wave iv at 111.57 and wave v as well as the wave (iii) has ended at 97.04, followed by wave (iv) at 111.43 and wave (v) has ended at 94.12 which is also the end of the larger degree v, this also implied the major wave (C) has also ended there, hence major correction has commenced from there with (A) leg unfolding in its lower degree wave c which has possibly ended at 145.69. Under this count, A-B-C wave (B) has commenced with A leg ended at 136.23, wave B at 143.79 and wave C has possibly ended at 149.79.
Our larger degree count is that the decline from 139.26 is wave (C) and is sub-divided into a diagonal triangle i-ii-iii-iv-v with wave i - 105.44, wave ii- 123.33, wave iii - 97.03, wave iv - 111.43, followed by the final wave v as well as the end of wave (C) at 94.12, this also mark the bottom of larger degree wave B. Under this count, major rise in wave C has commenced as an impulsive wave with minor wave III ended at 145.69, wave V is still in progress for further gain to 150.00. Having said that, this so-called wave V could well be the first leg of larger degree 5-waver wave C and this wave C should bring at least a retest of wave A top at 169.97 (July 2008).
Daily Technical Analysis: GBP/JPY Equidistant Channel Bearish Continuation
The GBP/JPY has followed my previous analysis exactly as planned and even during summer holidays trading, this still remains one of the best pair to trade due to its high ATR(14)-121. At this point we have two potential POC zones, should the pair retrace. POC1 144.70-90 (38.2, bearish order block D H3) should reject the pair short term towards 144.00. But if the pair breaks 144.00 without any retracement to the upside target is D L3 - 143.74 and 143.40 - W L3/ATR Low confluence.
Have in mind that even if the pair retraces to POC2 145.15-35 (equidistant channel high, 50.0, bearish order block, EMA89, W H3, 61.8) it will still be bearish and the zone should provide a good rejection towards the POC1 and above mentioned levels. This setup will also be discussed on Session Recap webinar so feel free to join.
Trade Idea: AUD/USD – Buy at 0.7840
AUD/USD – 0.7961
Recent wave: Wave 5 ended at 1.1081 and major correction has commenced for fall to 0.7000 and then towards 0.6500-10
Trend: Near term up
Original strategy :
Buy at 0.7800, Target: 0.7990, Stop: 0.7740
Position: -
Target: -
Stop: -
New strategy :
Buy at 0.7840, Target: 0.7990, Stop: 0.7780
Position: -
Target: -
Stop:-
Although aussie has rebounded after finding support at 0.7875 late last week, break of recent high at 0.7990 is needed to confirm recent upmove has resumed and extend gain to 0.8040-50 but loss of upward momentum should prevent sharp move beyond 0.8080 and reckon 0.8100 would hold from here, risk from there is seen for a retreat later. We are keeping our latest bullish count that recent impulsive waves is unfolding as (1 2, (i)(ii), i ii) and may extend headway to aforesaid upside target.
In view of this, would not chase this rise here and we are looking to buy aussie on subsequent pullback as 0.7800 should limit downside, bring another upmove later. Below support at 0.7786 would defer and suggest wave iii top is formed, bring correction in wave iv to 0.7750 but wave i top at 0.7712 should remain intact.
On the 4-hour chart, the move from 0.8066 is the wave 5 with i: 0.8860, ii: 0.8315, wave iii is an extended move ended at 1.0183, iv: 0.9706 and wave v has ended at 1.1081 (also the top of entire wave 5). The subsequent selloff is the major correction which is unfolding as ABC-X-ABC and 2nd A leg has ended at 0.8848, followed by a-b-c wave B which ended at 0.9758, hence, 2nd C wave is now in progress and indicated downside target at 0.7000 and 0.6950 had been met, so further fall to 0.6710-20 cannot be ruled out.

GBPJPY Pauses Decline, Possible Double Top Forming
GBPJPY has shifted its short-term bias back to the downside after a recent rally from 138.66 stalled at 147.77 on July 11 and prices dropped.
Support is currently provided by the 50-day moving average which is located close to the key 144.00 level, helping pause the market's decline.
The near-term bias remains to the downside, as suggested by the downward sloping RSI. The oscillator has dipped below 50, also indicating bearishness. A break below the 50-day MA would accelerate a decline in prices towards support at 141.81. This level is the 50% Fibonacci retracement level of the upleg from 135.60 to 148.10 (April 17 to May 10). From here, there is scope to drop to the 61.8% Fibonacci at 140.34. A break below the June 12 low of 138.66 could see prices re-test the April 17 low of 135.60.
Meanwhile, in the longer-term view, a double top chart pattern could be forming and would be confirmed if GBPJPY falls below 138.66. Such a move would bring about a bearish outlook for the pair, especially if the market remains below the daily Ichimoku cloud.
Only a move back above 145.11 (23.6% Fibonacci) would weaken the near-term bearish bias and may open the way for prices to target the 147.77 July 11 high before reaching the key 148.00 area. From this level, the market could resume its recent uptrend.
The short-term bias is bearish and the medium-term bias is neutral unless a double-top pattern is confirmed.
AUDUSD Turns Neutral After Pausing Rally
AUDUSD rose to a high of 0.7987 on July 20 before steadying. The pause in the rally suggests that a temporary top is now in place as the market lost upside momentum. Looking at the 4-hour chart, the weakening in momentum is indicated by the RSI which fell after reaching overbought levels above 70.
The near-term bias has turned neutral for consolidation. Support is provided at 0.7890, which is the 23.6% Fibonacci retracement level of the rise from 0.7571 to 0.7987 (July 7 to July 20). Further support is provided by subsequent Fibonacci levels at 0.7830 and 0.7780.
The 20-day moving average was acting as a resistance level in recent days, capping AUDUSD around 0.7930. Prices are currently testing this level and have risen above it. Should prices continue to rise, this prior resistance level will turn to support and a further rise could target the July 20 high of 0.7987. From here, the uptrend will resume.
The positively aligned moving averages and the rising 50-day MA are supporting a bullish outlook in the short-term. There was a bullish crossover of the 20-day day with the 50-day MA on July 12.
There has been no confirmation of a trend reversal yet and the current consolidation pattern could be a temporary pause before the uptrend resumes. For now, the bias remains neutral on the 4-hour chart.
Dollar Weighed By Political Woes, Close To 13-Month Low, Aussie Gains
As Asian traders were about to complete their trading day, the dollar index was up on the day after previously hitting a fresh 13-month low. Excluding aussie/dollar, most major pairs were moving within a relatively narrow range during Asian trading hours, while gold was down after recording a one-month high.
The dollar's index against a basket of major currencies fell to 93.82 today – it's lowest since June 24 of last year. It later managed to recover to last trade 0.1% up on the day. Still the greenback is likely to remain under pressure on the back of developments on the US political front that have the capacity to derail the Trump administration's plans on tax reform and infrastructure spending. The latest blow for President Donald Trump was White House spokesman Sean Spicer's resignation on Friday. Rising uncertainty is spurring demand for US Treasuries, pushing yields down and making the US currency relatively less attractive.
Dollar/yen was down on the day and close to the more than one-month low of 110.76 it recorded earlier in the day. Euro/dollar was slightly down after previously hitting a fresh 23-month high of 1.1684. The eurozone's common currency strongly rallied last week following the European Central Bank meeting. This week it will likely need fresh catalysts in order to maintain momentum. Pound/dollar was up on the day and marginally above the 1.30 handle after opening below this level.
In terms of releases, Japan's July preliminary manufacturing PMI was released at 52.2. Expectations were for a reading of 52.3, while June's respective number stood at 52.4. Dollar/yen edged higher upon release of the data, though the greenback's gains were short-lived.
The Australian and New Zealand dollars remained close to multi-month highs relative to the greenback. Aussie/dollar traded at 0.7952, up 0.6% on the day and fairly close the more than two-year high of 0.7987 from last week. Reserve Bank of Australia Deputy Governor Guy Debelle's dovish remarks last week halted the aussie's advance versus the US currency. Kiwi/dollar was slightly down at 0.7436, but close to Friday's near 13-month high of 0.7458.
Away from forex markets and in commodities, gold gained on the back of overall dollar weakness and potentially rising uncertainty. The precious metal rose to a one-month high of $1257.03 an ounce. It later fell possibly due to profit taking. It last traded around $1254.50. WTI and Brent crude were up 0.2% and 0.3% on the day, at $45.84 and $48.17 a barrel respectively.
Throughout the rest of the day, market participants will be mostly paying attention to preliminary manufacturing and services PMI data out of the eurozone and the US for the month of July, as well as June existing home sales for the US.
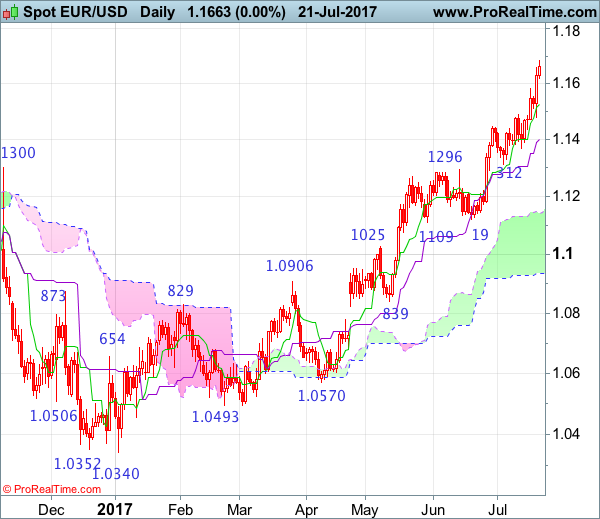
EUR/USD Candlesticks and Ichimoku Analysis
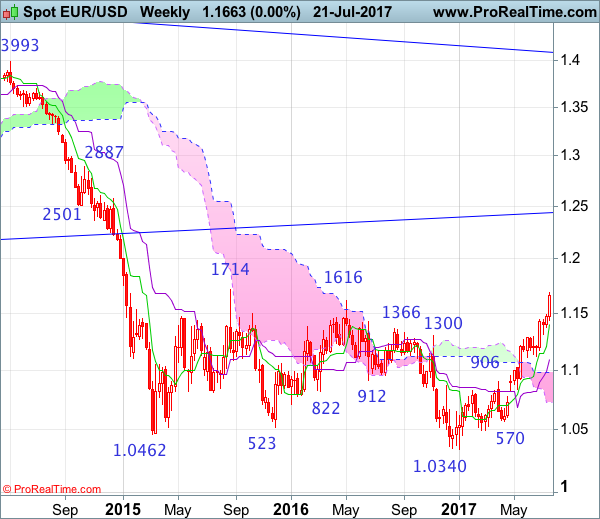
Weekly
• Last Candlesticks pattern: Shooting star
• Time of formation: 03 May 2016
• Trend bias: Down
Daily
• Last Candlesticks pattern: Shooting star
• Time of formation: 3 May 2016
• Trend bias: Sideways
EUR/USD – 1.1648
The single currency has surged again after brief pullback, adding credence to our bullish view that recent upmove is still in progress and price already exceeded indicated upside targets at previous chart resistance at 1.1616, bullishness remains for medium term upmove to extend further gain to another previous resistance at 1.1714, break there would encourage for headway to 1.1800-10 but near term overbought condition should limit upside and price should falter below 1.1870-80, bring retreat later.
On the downside, whilst initial pullback to previous resistance at 1.1583 is likely, reckon the Tenkan-Sen (now at 1.1527) would limit downside and bring another rise later to aforesaid upside targets. Below support at 1.1435 would defer and risk correction towards the Kijun-Sen (now at 1.1402) but only a daily close below support at 1.1370 would signal a temporary top is possibly formed, bring further fall to 1.1312 support but previous resistance at 1.1296 should remain intact.
Recommendation: Buy at 1.1530 for 1.1750 with stop below 1.1430.
On the weekly chart, last week’s rally formed another white candlestick and current firmness add credence to our view that recent upmove from 1.0340 low is still in progress and bullishness remains for this move to extend further gain to previous chart resistance at 1.1714, however, break there is needed to retain upside bias and encourage for headway to 1.1800-10, having said that, near term overbought condition should limit upside to 1.1900 and price should falter below 1.2000, risk from there is seen for a retreat later.
On the downside, although pullback to 1.1530-40 is likely, reckon 1.1475-80 would contain downside and bring another rise later. Below 1.1435 would risk test of the Tenkan-Sen (now at 1.1397) but only a weekly close below support at 1.1370 would signal a temporary top is formed instead, bring correction to 1.1312 support, having said that, previous resistance at 1.1285 should turn into support and 1.1200-10 should hold, price should stay above strong support at 1.1109-19, bring another upmove later.
Forex Technical Analysis: GBP/USD
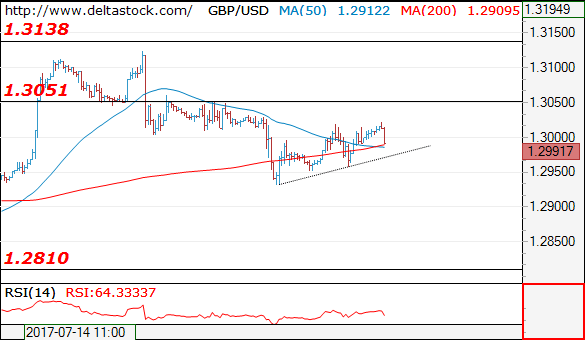
GBP/USD
Current level - 1.2991
Despite the slow pace, the bias remains positive, for a test of 1.3050, en route to 1.3130 area. Crucial on the downside is 1.2960 low and an eventual break through the latter will signal a renewal of the dive towards 1.2860.
| Resistance | Support | ||
| intraday | intraweek | intraday | intraweek |
|
1.3050 |
1.3260 |
1.2960 |
1.2810 |
|
1.3130 |
1.3500 |
1.2810 |
1.2480 |