Sample Category Title
DXY and EUR/USD: Outlook and Technical Analysis
- The US Dollar Index (DXY) starts the week lower as market participants reposition ahead of a data-heavy week.
- EUR/USD recovers but will German inflation derail the rally?
- The DXY is at a key confluence; a break of the trendline could lead to a downside correction, while a bounce could open up the possibility of fresh highs.
The US Dollar Index (DXY) has started the week on the back foot as the Index flirts with a key level. It would appear market participants are repositioning ahead of a data heavy week that ends with the NFP jobs report on Friday.
Another reason that has been cited is that the Dollar could reconnect with the slight deterioration in its rate advantage over the holiday period. The holidays saw US Yields remain steady while rates in Germany, the Eurozone benchmark ticked higher.
Currency Strength Chart: Strongest – CAD, NZD, GBP, AUD, EUR, CHF, USD, JPY – Weakest
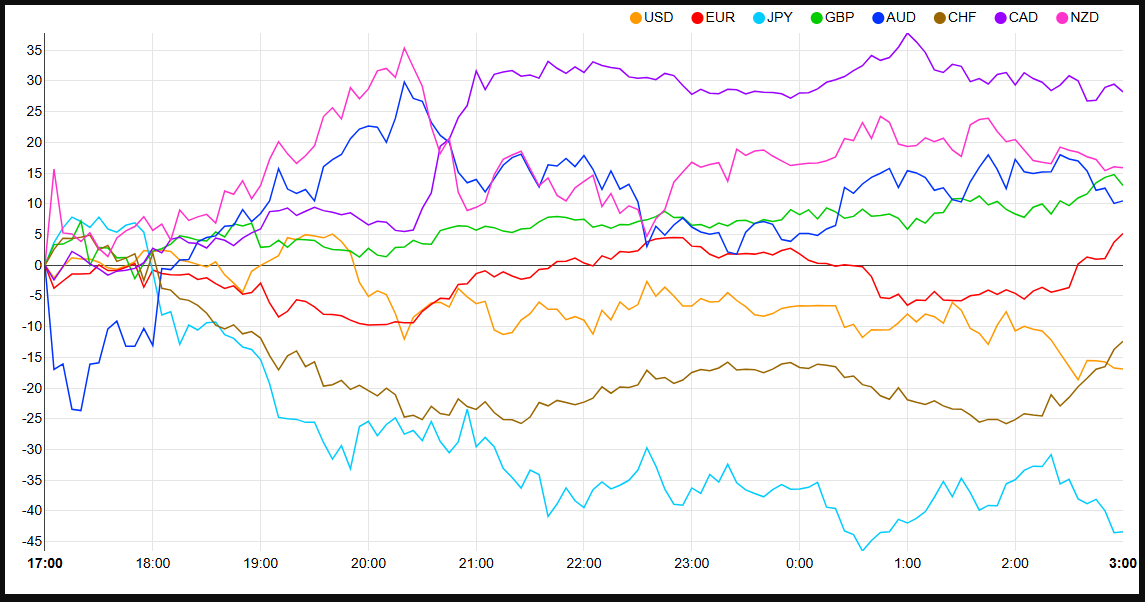
Source: FinancialJuice
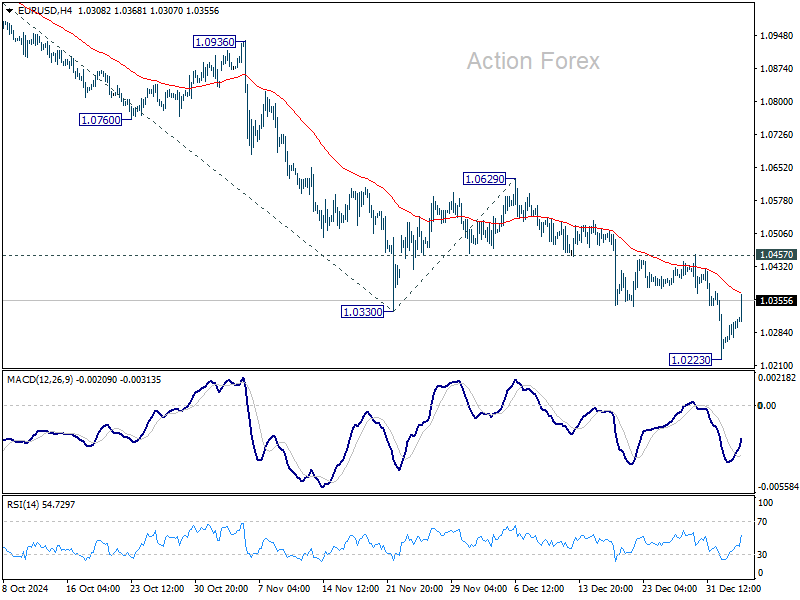
EUR/USD Rises To Mid 1.03’s, German Inflation Data Ahead
EUR/USD has continued its recovery following the holiday period selloff which saw the pair fall to 1.02225. Parity for EUR/USD in 2025 cannot be ruled out yet as policy divergence remains a real possibility.
The only upside for market participants is that such a drop may present an enticing opportunity. Historically any moe toward parity or dips below have proved short-lived with significant buying pressure emerging. Will history repeat itself once more?
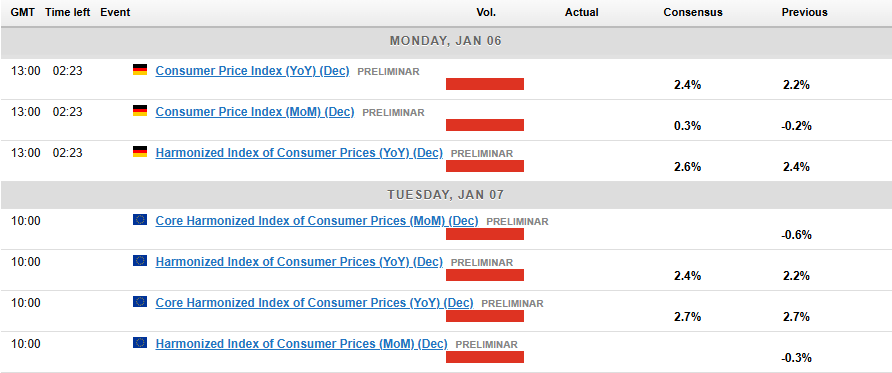
Looking at the immediate risks for EUR/USD, and German inflation data is due later in the day. German inflation is forecast to rise to 2.4% on a yearly basis in December from 2.2% in November.
A stronger print could help push EUR/USD toward the 1.0400 handle but I do not expect such a move to last. EUR/USD still faces significant bearish pressure and with a slew of data ahead this week, an early week correction followed by a selloff later in the week cannot be ruled out.
Technical Analysis
EUR/USD
EUR/USD has found some momentum following Friday’s bullish inside bar candle close.
On the daily timeframe, the trend remains bearish without a daily candle close above the 1.04300 handle.
Until such a break occurs, the possibility of fresh lows remains high. There is however the possibility of a break above the 1.0430 which could push EUR/USD toward the long term descending trendline and key resistance around the 1.0500 handle.
This could in theory provide a better risk to reward opportunity for potential shorts, however at this point the daily chart would have noted a change in character with the swing high at 1.04300 having been broken. This would make such a play counter-trend in nature and increase the risk of EUR/USD rising even further.
Interesting week ahead for EUR/USD with the DXY likely to be central to any development for the pair.
EUR/USD Daily Chart, January 6, 2025
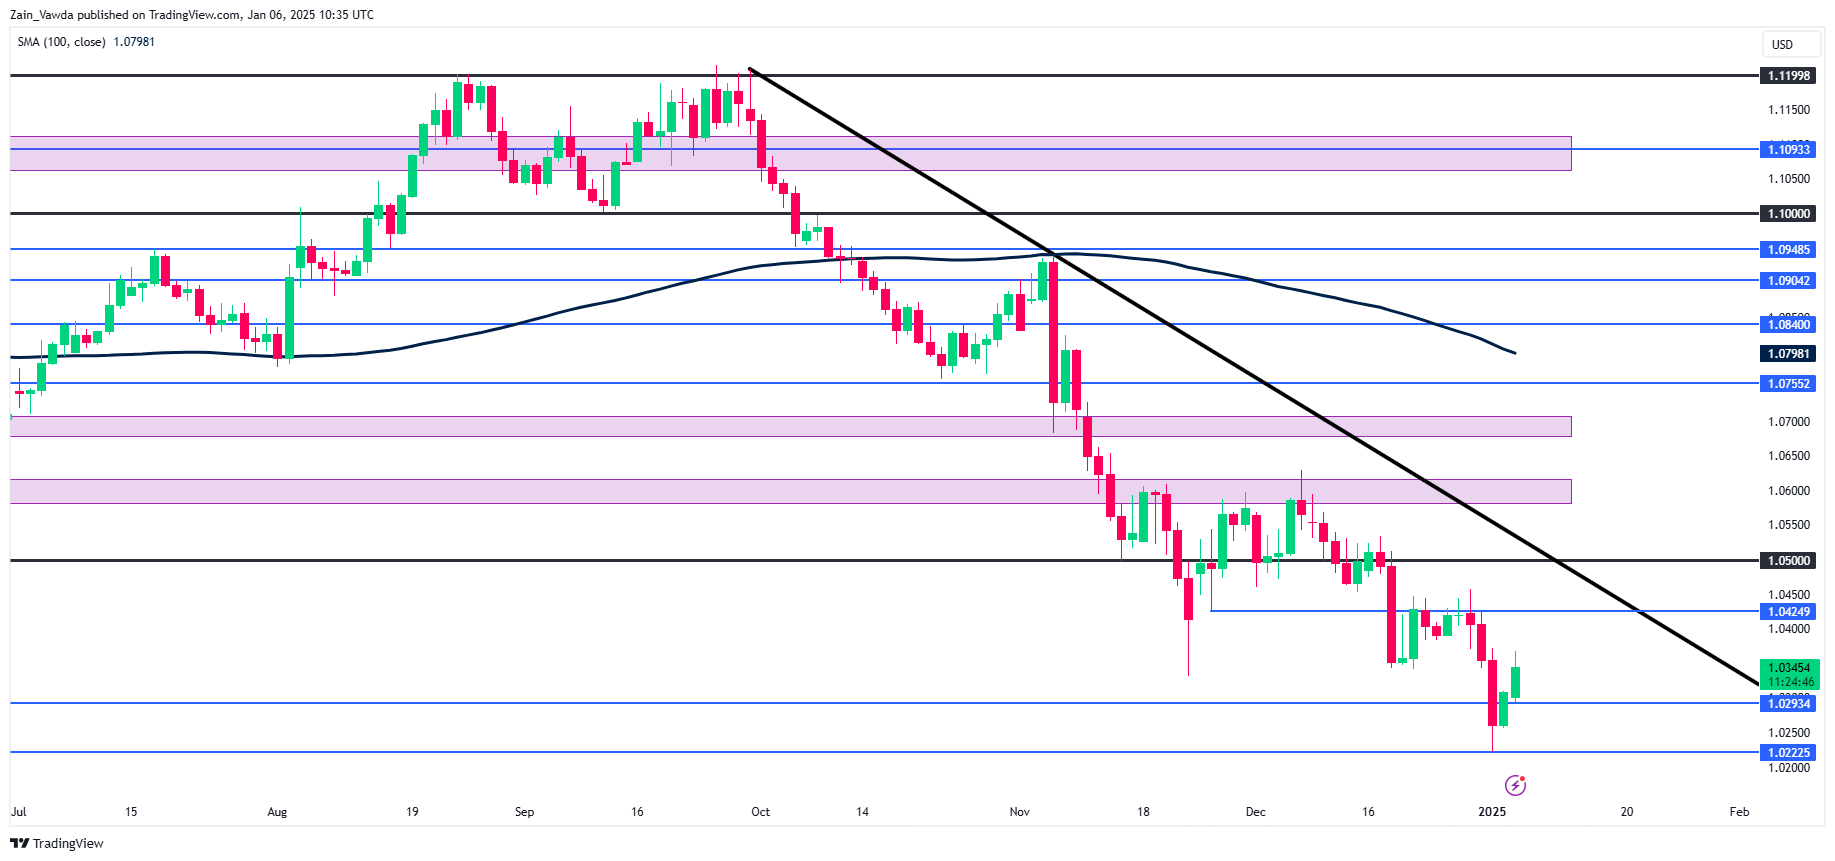
Source:TradingView.com
Support
- 1.0293
- 1.0222
- 1.0000
Resistance
- 1.0430
- 1.0500
- 1.0535
US Dollar Index (DXY)
The US Dollar index daily chart is intriguing to say the least. The selloff this morning has brought the index into a key confluence that could help determine price action in the coming days.
The index has come within a whisker of the ascending trendline on the daily timeframe as it bounced off support at 108.64 this morning.
The next move will be key as a break of the trendline could lead to a short-term downside correction for the index toward 108.00 or potentially 107.00.
A bounce off the support level and a move higher could open up the possibility of fresh highs above the 110.00 handle.
The narrative around the US Dollar is one of strength. Recent comments by Fed policymakers touting rising inflation as a concern may lead to a pivot toward price pressures once more. Such a move could keep the USD supported in the medium term.
The Expectations around the Trump Presidency may also factor in as the January 21 inauguration nears.
The inauguration however does present two potential paths for the USD index. First one would be continued USD weakness before buying pressure returns just ahead of the Trump inauguration as market participants attempt to get the dollar on the ‘cheap’.
The second possibility is that we see a strong US Dollar right up until the inauguration. Thai move does however leave the USD vulnerable to selling pressure post election should President Trump not deliver on key campaign promises.
US Dollar Index (DXY) Daily Chart, January 6, 2025
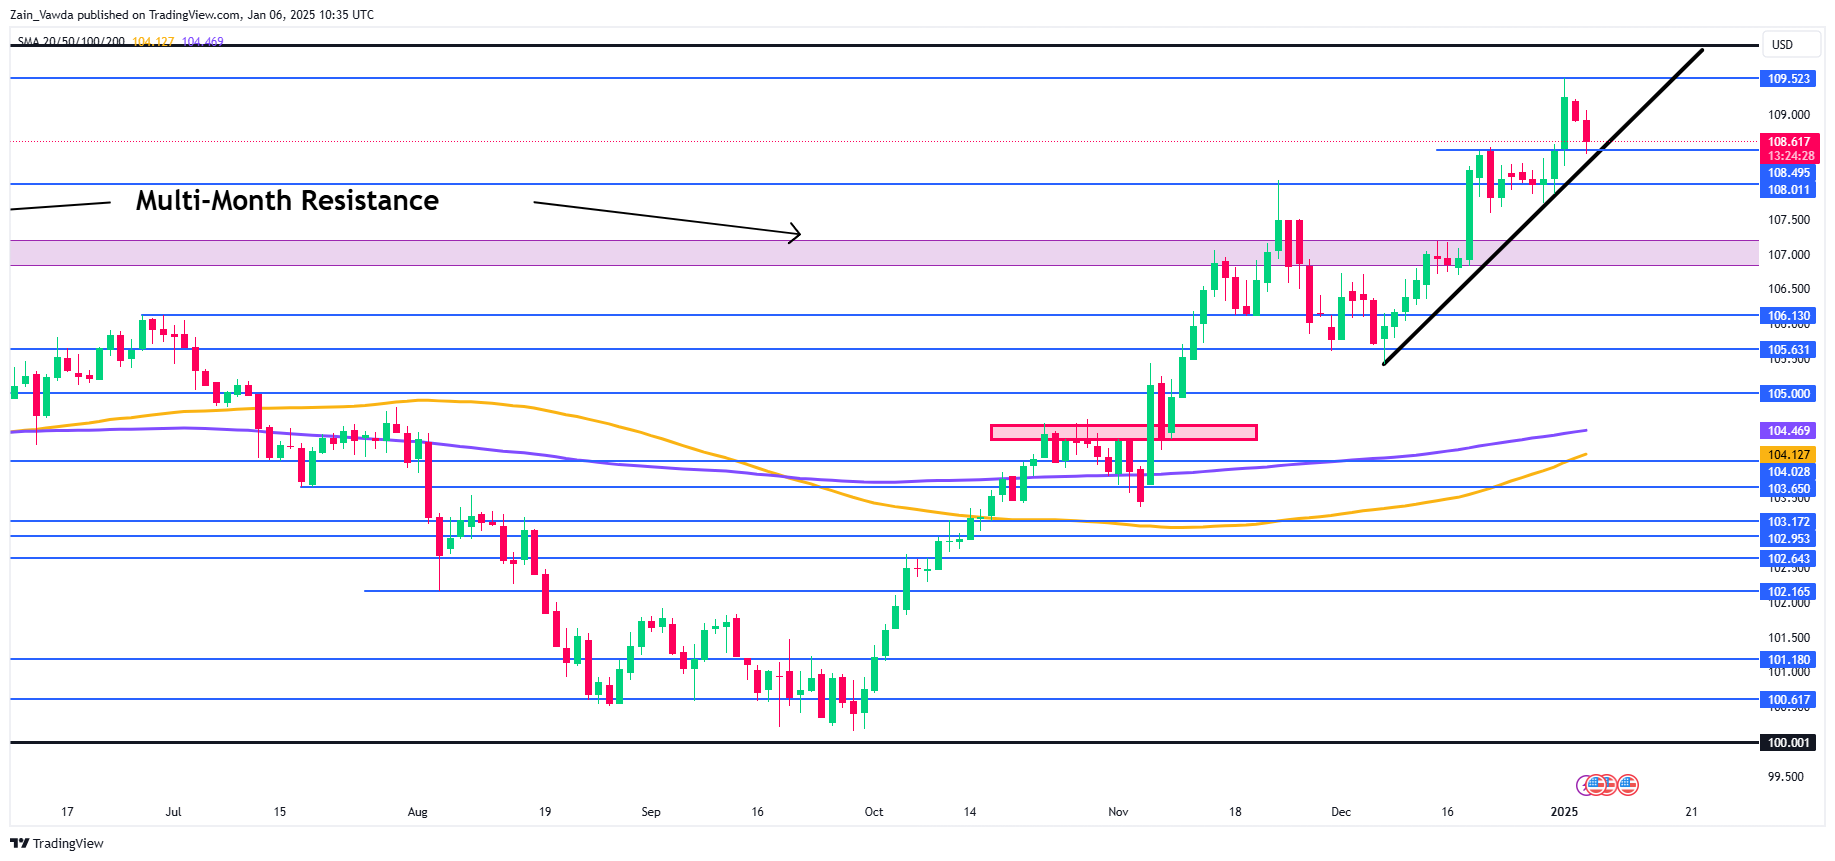
Source:TradingView.com
Support
- 108.64
- 108.00
- 107.60
Resistance
- 109.00
- 109.52
- 110.00
Brent Crude Oil Hits 2.5-Month High in Early 2025
The XBR/USD chart shows a strong rally in Brent crude oil prices on January 2–3, breaking above $76.20 for the first time since mid-October.
According to Reuters, this surge was driven by:
- Economic stimulus measures in China, including wage increases for public servants and a significant boost in funding through treasury bonds.
- Forecasts of a colder winter in the US and Europe, potentially increasing demand for oil products.
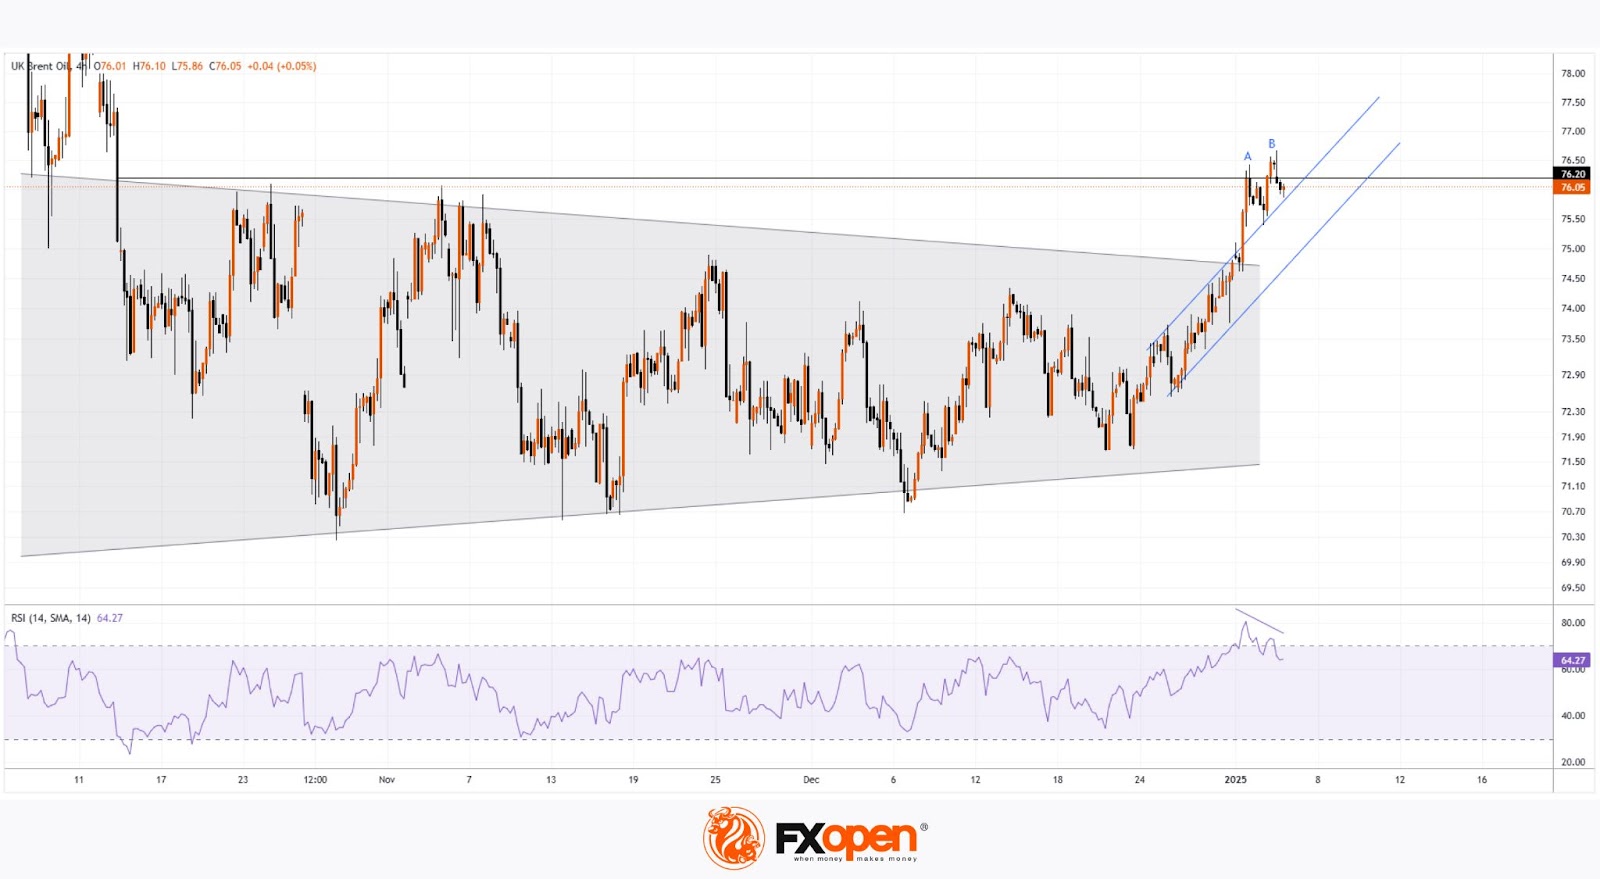
According to technical analysis of the XBR/USD chart, the price broke out of a consolidation pattern (highlighted in blue) that had confined it in late 2024.
However, signs of waning bullish momentum are emerging:
- At point B, the price only slightly surpassed the previous high at point A before reversing downward, indicating buyer weakness.
- A bearish divergence is forming between the RSI indicator and points A and B.
These signals suggest that Brent crude oil prices could be vulnerable to a correction, potentially targeting the lower blue trendline as a support level.
Start trading commodity CFDs with tight spreads. Open your trading account now or learn more about trading commodity CFDs with FXOpen.
This article represents the opinion of the Companies operating under the FXOpen brand only. It is not to be construed as an offer, solicitation, or recommendation with respect to products and services provided by the Companies operating under the FXOpen brand, nor is it to be considered financial advice.
Bitcoin on the Verge of $100,000 Again
Market Picture
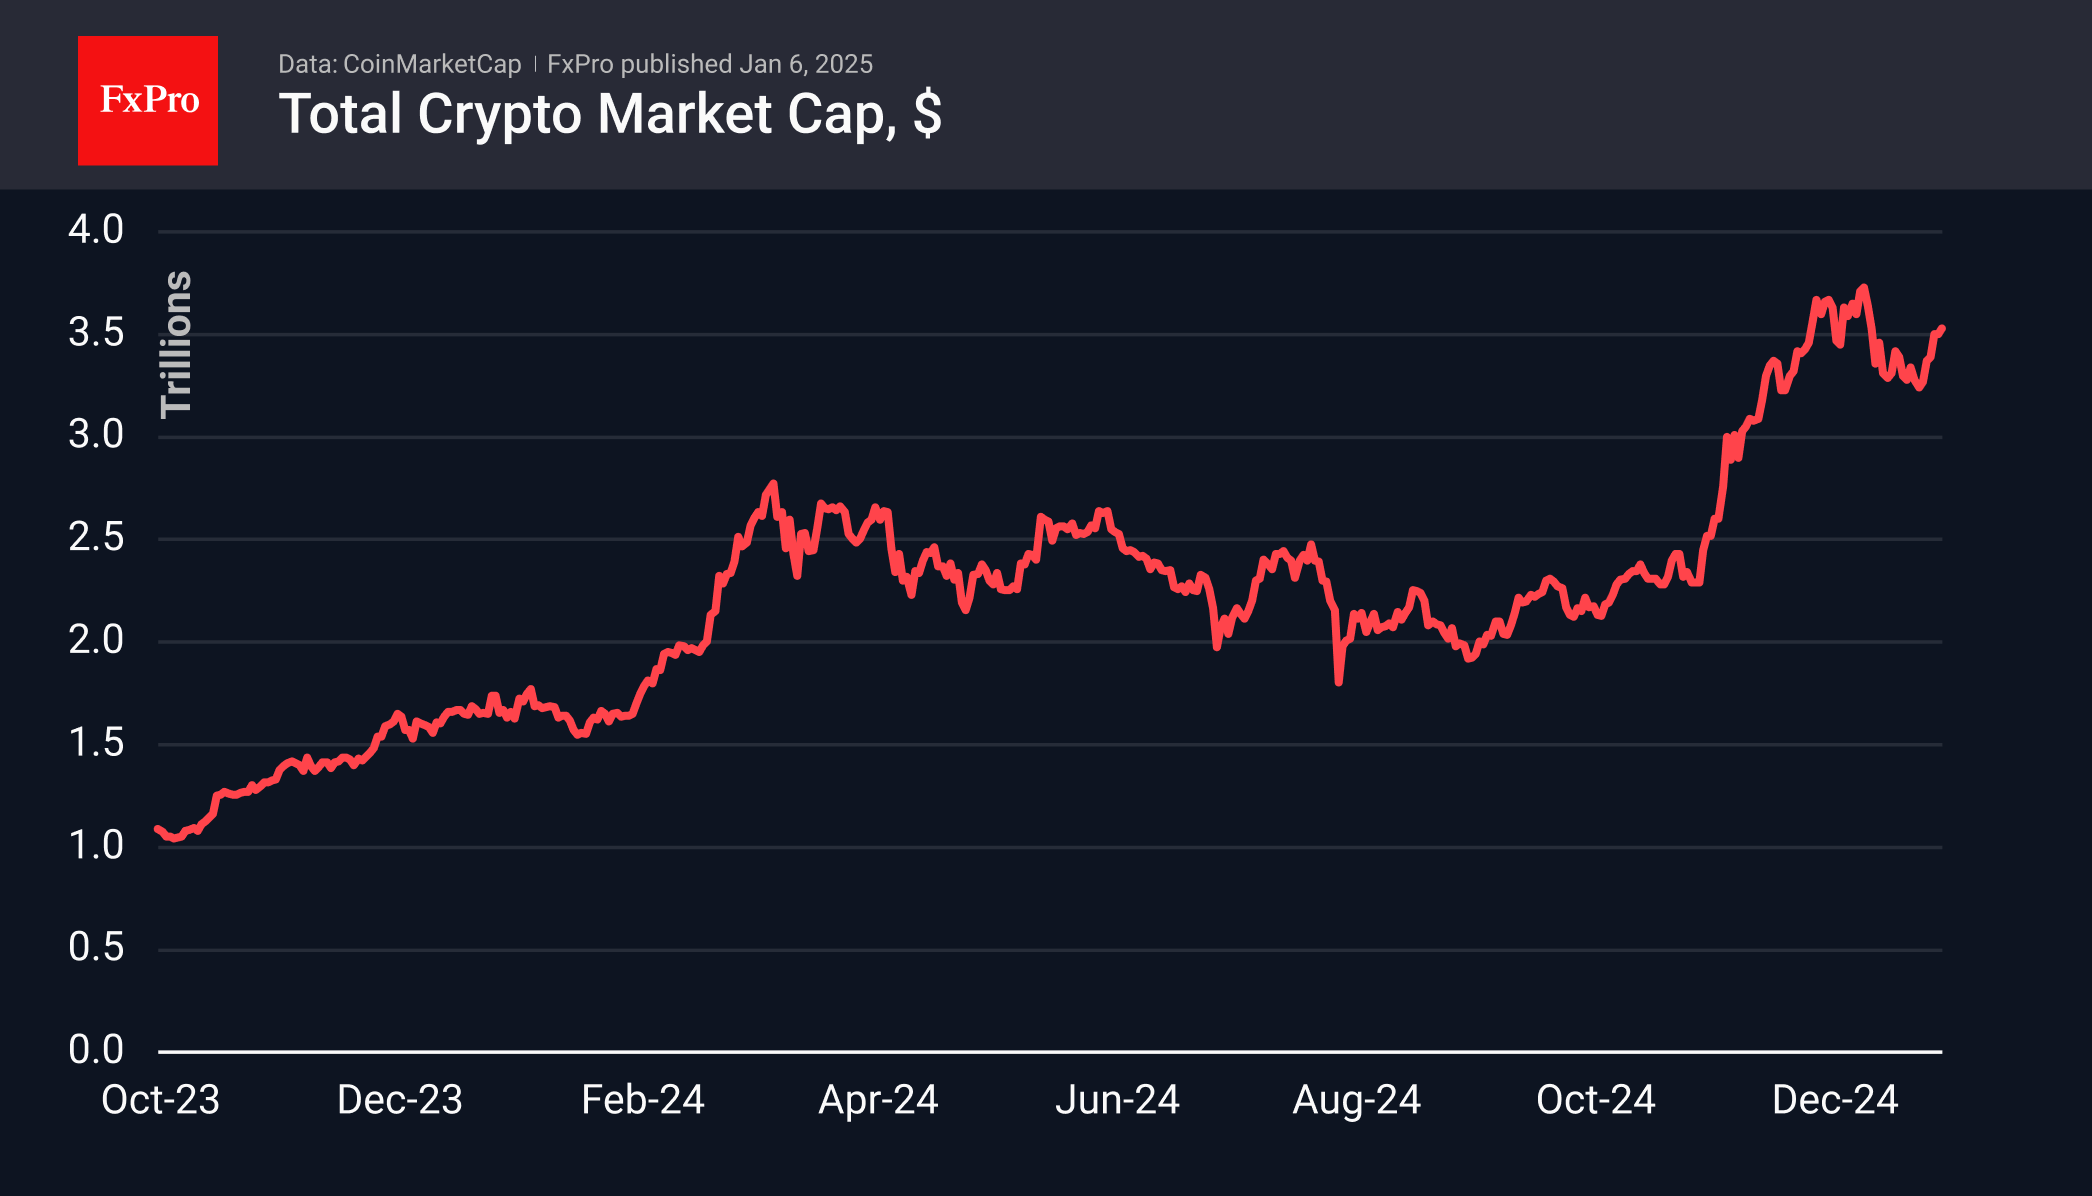
The crypto market capitalisation has surpassed $3.5 trillion, the highest since 19 December. Short-term growth in the market is being replaced by periods of consolidation. The market seems to be probing the ground beneath its feet and moving gently upwards. The sentiment index of 76 (extreme greed) indicates a period of active buying, leaving plenty of room for growth.
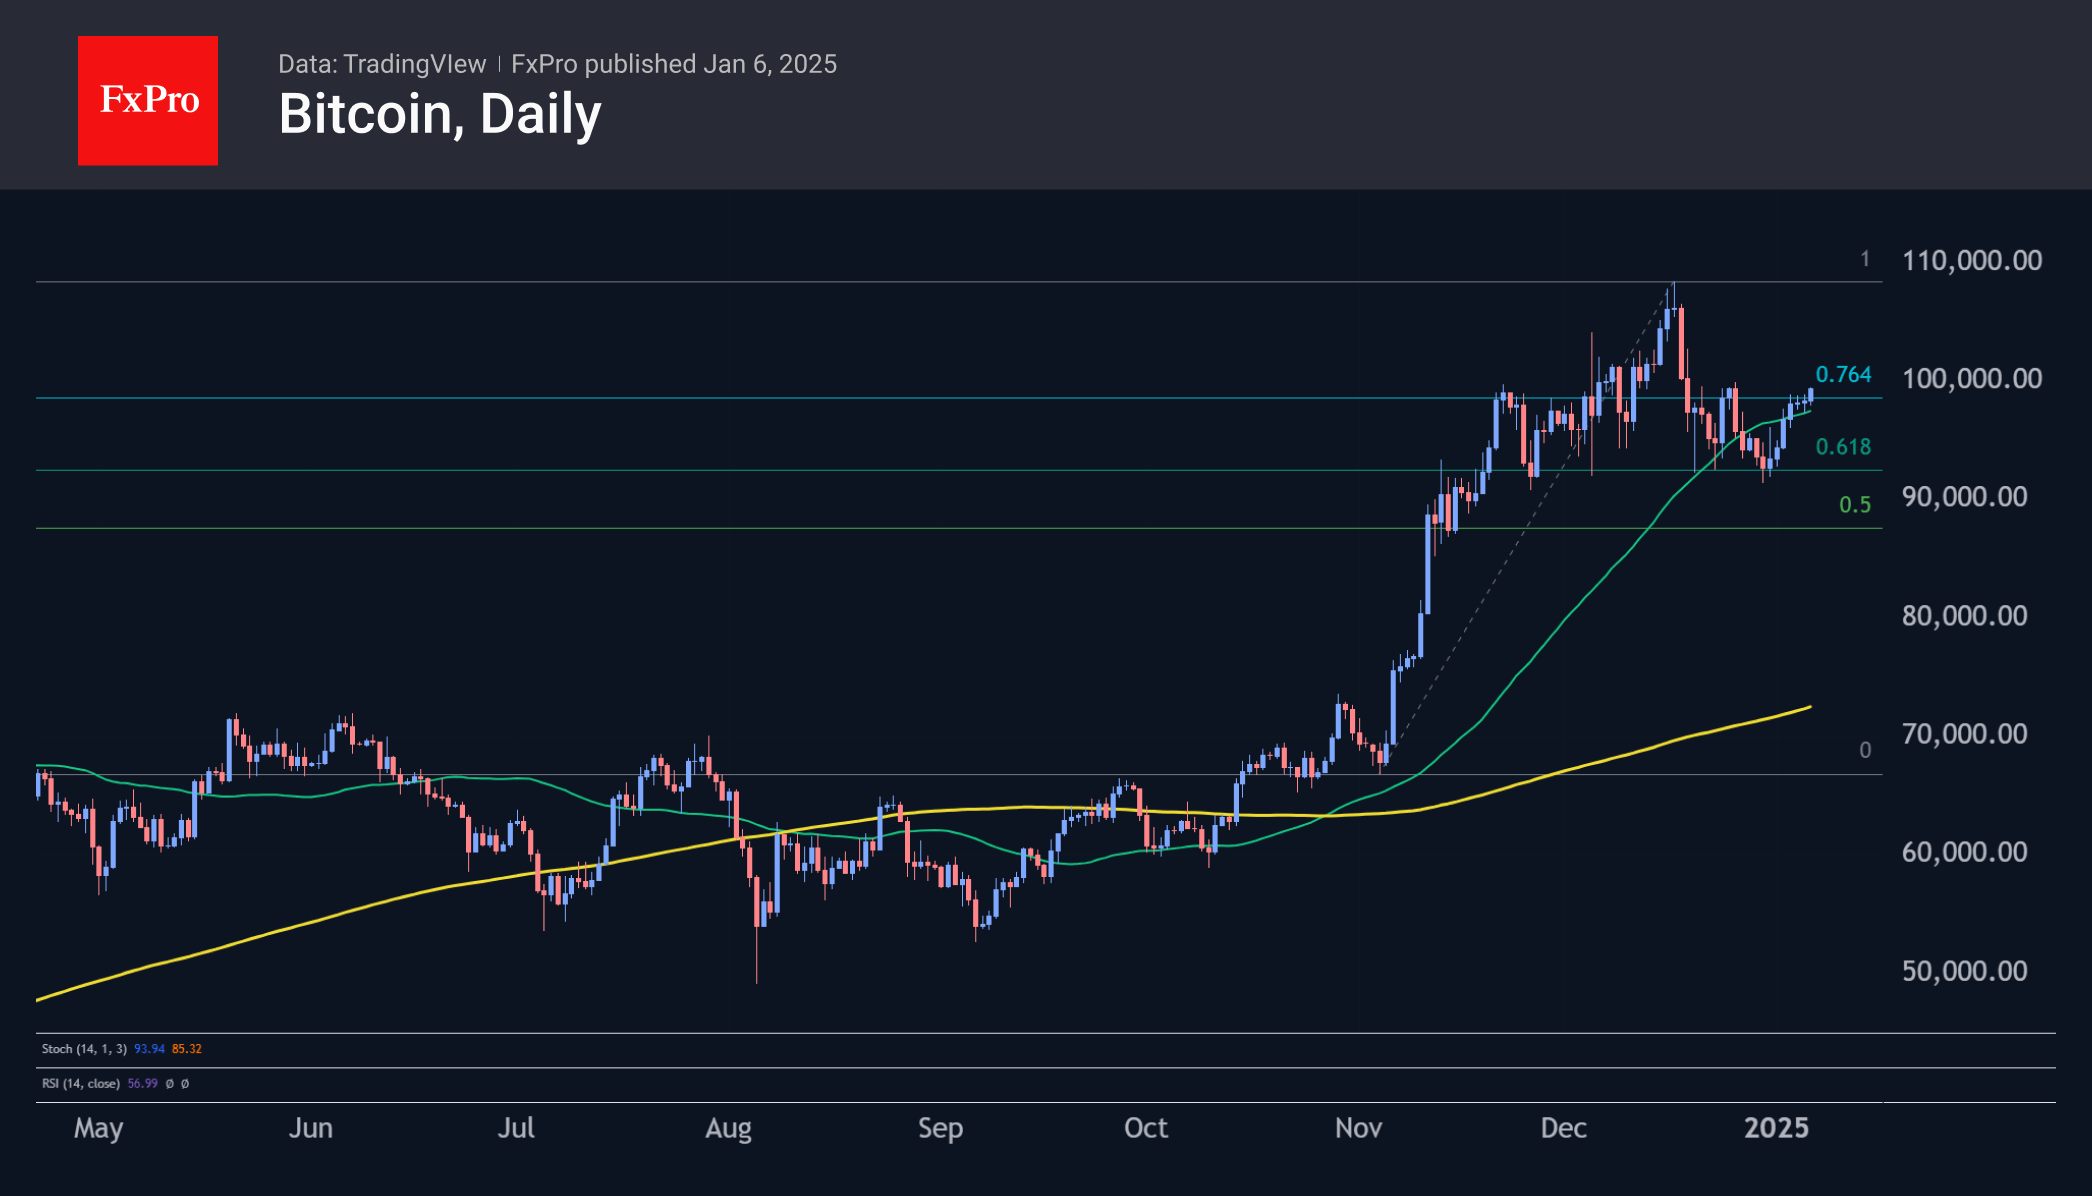
Bitcoin rose for the seventh day in a row and has already passed the $99,000 mark, a level it has traded above for less than two weeks.
So far, the technical picture looks like a classic correction completion with a resumption of the growth of 61.8% of the rally since the beginning of November. This scenario will be confirmed if the historical highs of around $109,000 are confidently breached. At the same time, we expect Bitcoin’s growth to accelerate after the $100,000 mark.
News Background
According to SoSoValue, net inflows into spot Bitcoin ETFs in the US were $908.1 million on Friday, 3 January, with net inflows of $245 million for the week after outflows of $387.5 million earlier. Spot Ethereum-ETFs saw net outflows of $38.2 million for the week, breaking a 5-week positive trend.
MicroStrategy is looking to raise an additional $2bn by selling shares to buy more of the first cryptocurrency. The final decision on the expansion of the BTC investment programme will be made at the shareholder meeting in the first quarter of 2025.
JPMorgan said the share of gold and Bitcoin in investors’ portfolios is expanding. In the long term, the strategy of capital protection against inflation and depreciation of fiat currencies will remain.
Solana developers have created quantum-resistant storage on the blockchain. Solana Winternitz Vault is available as an optional solution and is not yet applicable to the entire blockchain.
Chinese authorities will extend Forex rules to crypto transactions. China’s State Administration of Foreign Exchange (SAFE) has listed cryptocurrency transactions as risky transactions and requires financial organisations to monitor all transactions.
Bitcoin has turned 16 years old. The anonymous creator of Bitcoin, Satoshi Nakamoto, launched the network for the first cryptocurrency on 3 January 2009. At that time, the first block in the BTC network, the so-called genesis block, was created. On 9 February 2011, Bitcoin equalled the value of the US dollar for the first time.
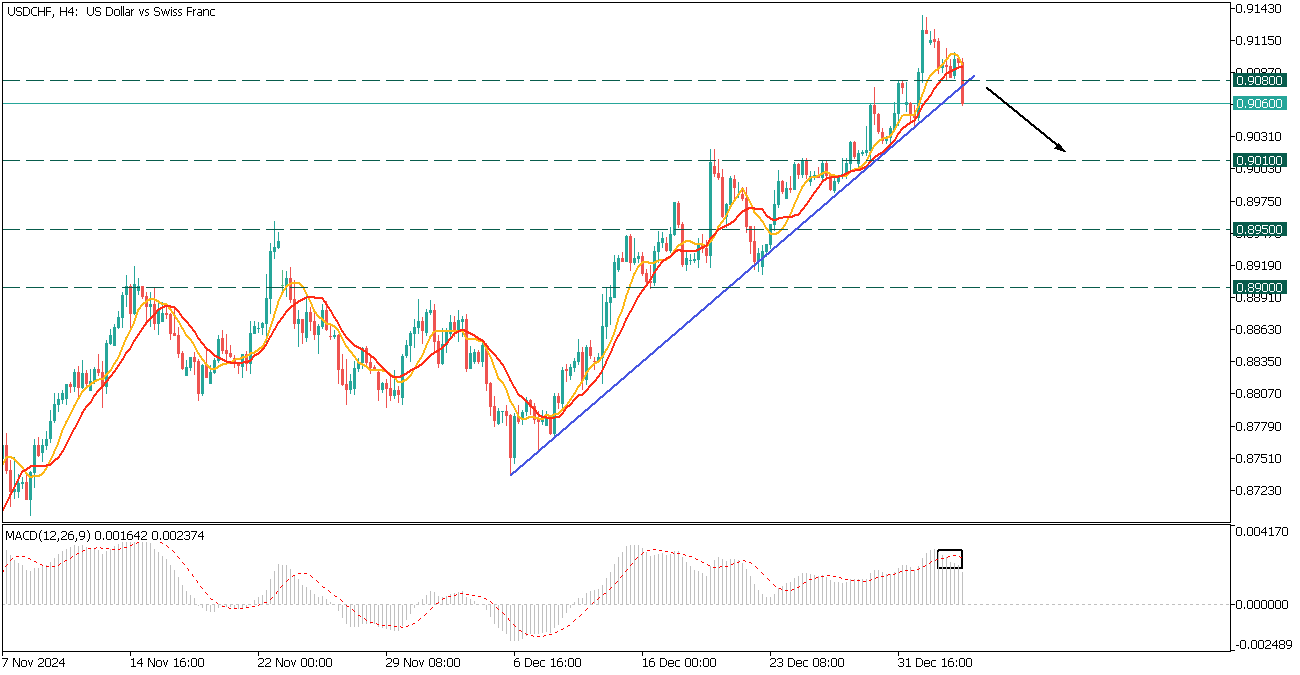
USDCHF: Trend Reversal
USDCHF, H4
USDCHF is in the correction after a rise, breaching below 0.9080 and the trendline.
- The MACD histogram crosses the signal line down, and the 9-MA crosses the 14-MA, confirming a bearish sentiment.
- Consider a short trade on USDCHF with the target at 0.9010.
Eurozone Sentix investor confidence hits 14-month low, room for ECB support rapid diminishing
Eurozone Sentix Investor Confidence edged down from -17.5 to -17.7 in January, meeting expectations while marking the lowest level since November 2023. Current Situation Index fell from -28.5 to -29.5, its weakest reading since October 2022. Meanwhile, Expectations Index improved marginally from -5.8 to -5.0 but remained in negative territory.
Sentix highlighted Germany's economic struggles as a major drag on the Eurozone, with its overall index at -33.3. German Current Situation Index held steady at -50.8, underscoring a deep recessionary environment, while expectations fell to -13.8. Political uncertainty in Germany, exacerbated by electoral challenges, compounds the economic woes, adding to the region's fragility.
Sentix also warned that the broader Eurozone economy is at risk of falling "even deeper into crisis." Inflation concerns persist, with the thematic inflation index dropping from -12 to -15.25. This trend further constrains ECB, which limited room for additional rate cuts is "rapidly diminishing". Governments are also contending with high deficits as they attempt to stimulate growth.

UK PMI services finalized at 51.1, optimism hits multi-year low
UK PMI Services for December was finalized at 51.1, slightly up from November's 50.8, marking the fourteenth consecutive month of expansion. However, growth was marginal, with the index's quarterly average at its lowest in a year. PMI Composite slipped to 50.4, down from 50.5, its weakest reading since October 2023.
Tim Moore, Economics Director at S&P Global Market Intelligence, noted a "near-stalling" of new business inflows due to falling business and consumer confidence. Respondents cited concerns over "domestic economic prospects" for 2025 and lingering post-Budget uncertainty as major factors curbing growth momentum.
Cost pressures intensified, with input price inflation hitting an eight-month high. Service providers responded by raising prices at a rate well above pre-pandemic levels, further straining demand.
Nearly one in four firms reported payroll reductions, marking the steepest non-pandemic-related job shedding in over 15 years as subdued demand and rising employment costs forced businesses to delay hiring or reduce staff.
EUR/USD Daily Outlook
Daily Pivots: (S1) 1.0273; (P) 1.0291; (R1) 1.0328; More...
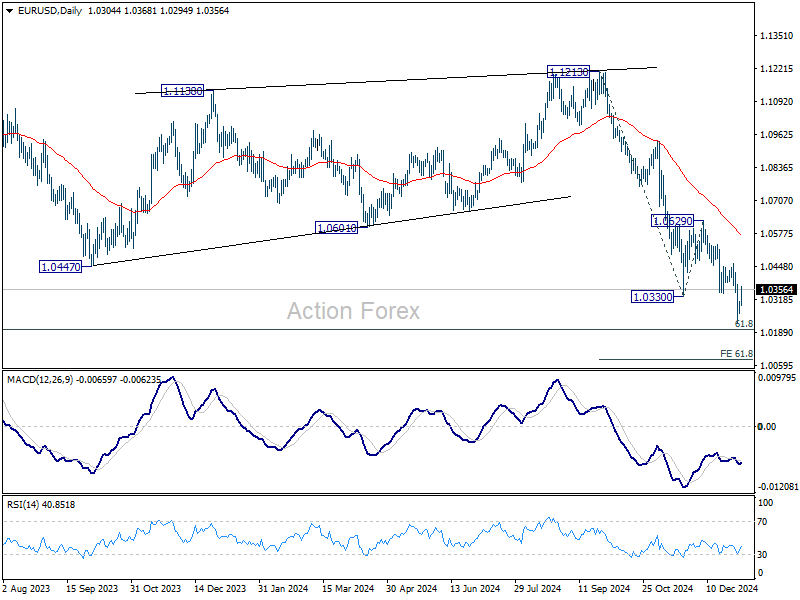
EUR/USD's recovery from 1.0223 extends higher today but stays below 1.0457 resistance. Intraday bias remains neutral first, and further decline is in favor. Below 1.0223 will resume the fall from 1.1213 to 61.8% projection of 1.1213 to 1.0330 from 1.0629 at 1.0083. Nevertheless, firm break of 1.0457 will bring stronger rise back to 1.0629 structural resistance next.
In the bigger picture, fall from 1.1274 (2023 high) should either be the second leg of the corrective pattern from 0.9534 (2022 low), or another down leg of the long term down trend. In both cases, sustained break of 61.8 retracement of 0.9534 to 1.1274 at 1.0199 will pave the way back to 0.9534. For now, outlook will stay bearish as long as 1.0629 resistance holds, even in case of strong rebound.
USD/JPY Daily Outlook
Daily Pivots: (S1) 156.92; (P) 157.24; (R1) 157.62; More...
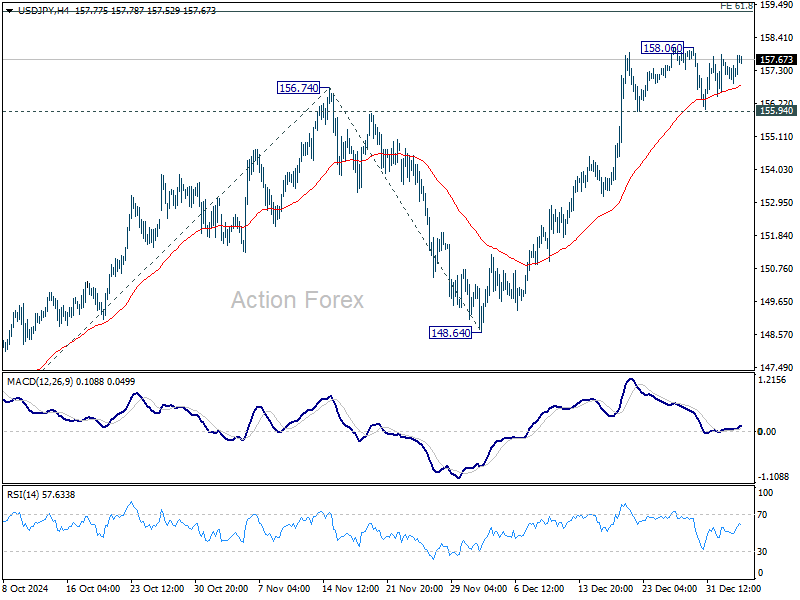
USD/JPY is staying in consolidations below 158.06 and intraday bias remains neutral. Further rally is expected as long as 155.94 support holds. On the upside, break of 158.06 will resume the rally from 139.57 to 61.8% projection of 139.57 to 156.74 from 148.64 at 159.25. Firm break there will target 161.94 high. However, break of 155.94 will turn bias to the downside, for deeper pull back to 55 D EMA (now at 153.50).
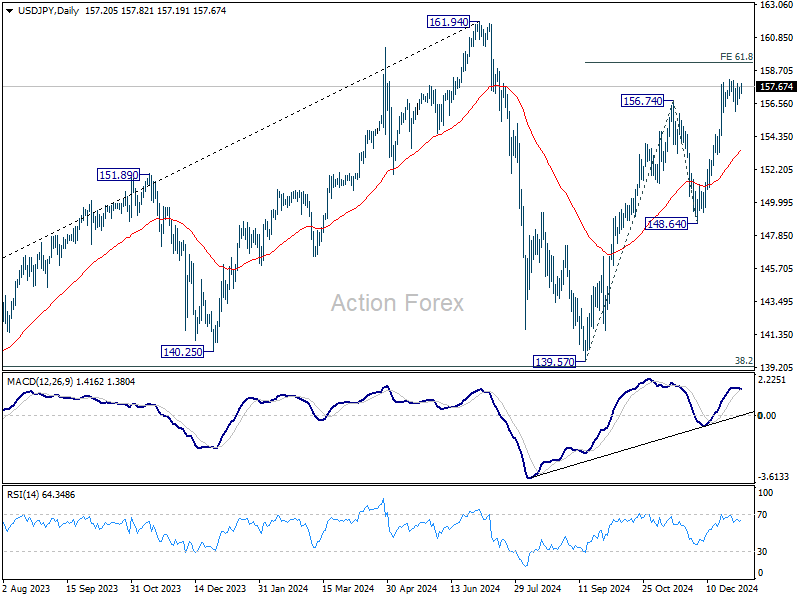
In the bigger picture, price actions from 161.94 are seen as a corrective pattern to rise from 102.58 (2021 low). The range of medium term consolidation should be set between 38.2% retracement of 102.58 to 161.94 at 139.26 and 161.94. Nevertheless, sustained break of 139.26 would open up deeper medium term decline to 61.8% retracement at 125.25.
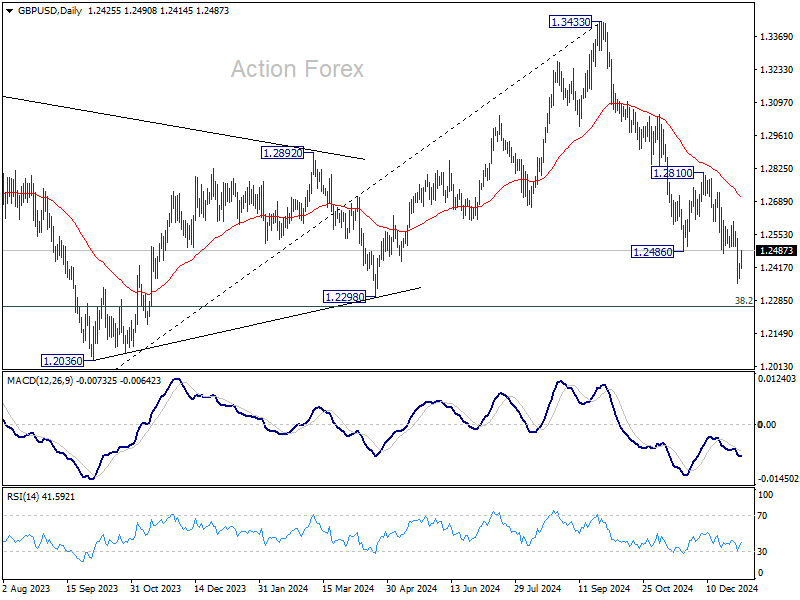
GBP/USD Daily Outlook
Daily Pivots: (S1) 1.2369; (P) 1.2402; (R1) 1.2453; More...
GBP/USD breaks 1.2474 minor resistance as recovery from 1.2352 extends and intraday bias is turned neutral first. Some consolidations could be seen risk with of stronger rebound. But near term outlook will remain bearish as long as 1.2810 resistance holds. Below 1.2352 will resume the fall from 1.3433 to 1.2256/98 cluster support zone. Strong support is expected there to contain downside to bring more sustainable rebound, at least on first attempt.
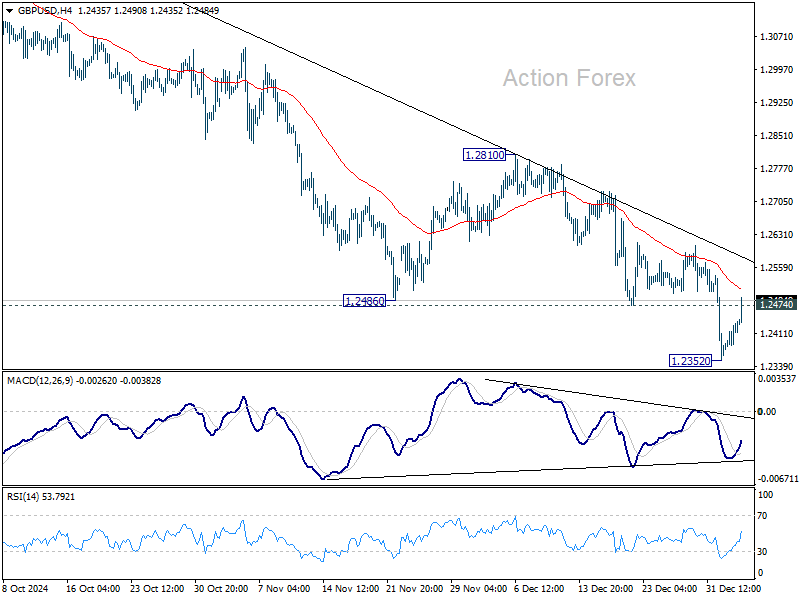
In the bigger picture, price actions from 1.3433 medium term are seen as correcting whole up trend from 1.0351 (2022 low). Deeper decline could be seen to 38.2% retracement of 1.0351 to 1.3433 at 1.2256, which is close to 1.2298 structural support. But strong support is expected there to bring rebound to extend the corrective pattern. However, firm break of 1.2256 will argue that the trend has reversed and target 61.8% retracement at 1.1528.
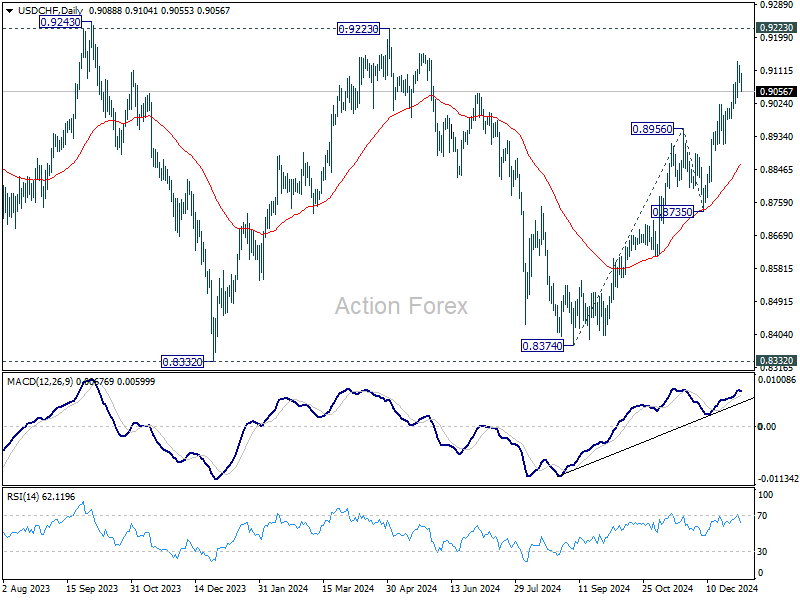
USD/CHF Daily Outlook
Daily Pivots: (S1) 0.9066; (P) 0.9098; (R1) 0.9117; More…
Intraday bias in USD/CHF is turned neutral first with current retreat and some consolidations would be seen below 0.9136 temporary top. But outlook will remain bullish as long as 0.8956 resistance turned support holds. Above 0.9136 will resume the rally from 0.8374 to 0.9223 key resistance next.
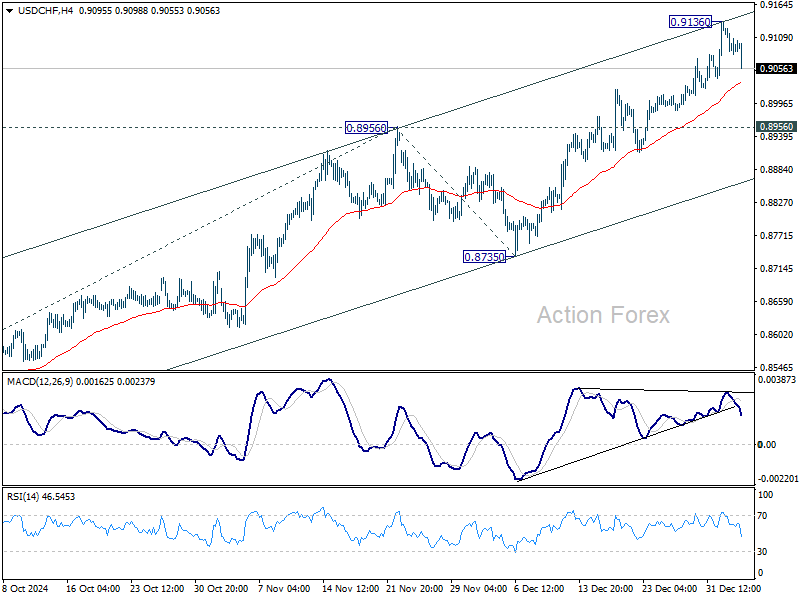
In the bigger picture, price actions from 0.8332 (2023 low) are currently seen as a medium term corrective pattern, with rise from 0.8374 as the third leg. Overall outlook will continue to stay bearish as long as 0.9223 resistance holds. Break of 0.8332 low is in favor at a later stage when the consolidation completes. However, decisive break of 0.9223 will be an important sign of bullish trend reversal.