Sample Category Title
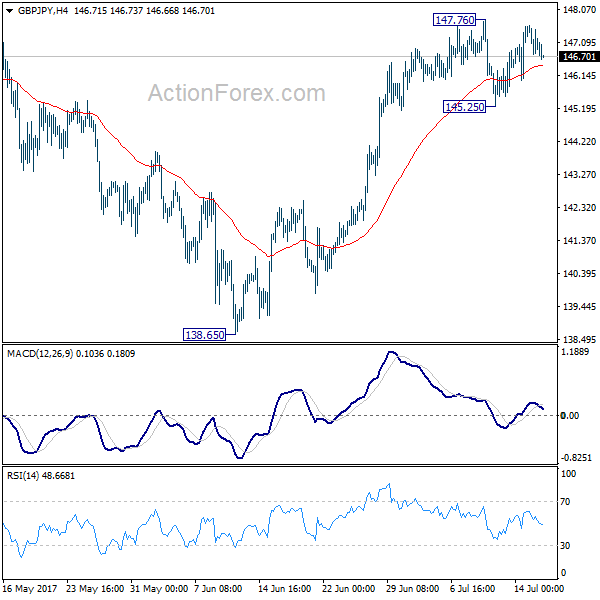
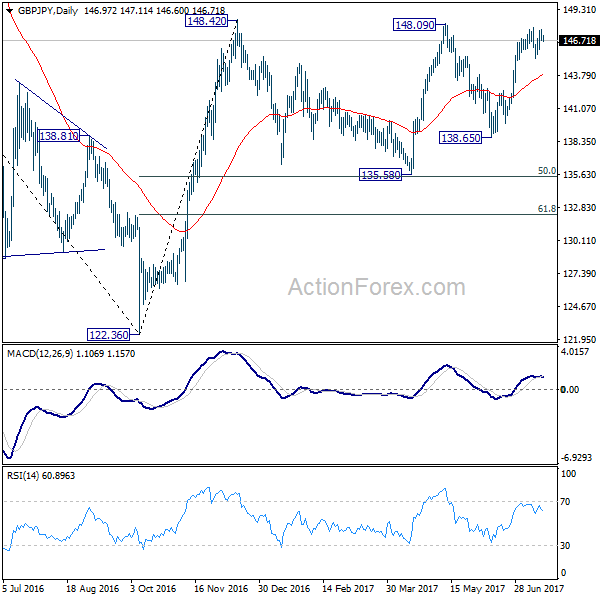
GBP/JPY Daily Outlook
Daily Pivots: (S1) 146.63; (P) 147.11; (R1) 147.48; More
Intraday bias in GBP/JPY stays neutral with mixed near term outlook. On the upside break of 147.76 will resume rise from 138.65. And firm break of 148.42 key resistance will also resume the whole rally from 122.36 to long term fibonacci level at 150.43 and above. Meanwhile, on the downside, break of 145.25 will revive the case of rejection from 148.09/42 resistance zone. Intraday bias would then be turned back to the downside for 55 day EMA (now at 143.72) and below.
In the bigger picture, rise from medium term bottom at 122.36 is expected to continue to 38.2% retracement of 196.85 to 122.36 at 150.43. Decisive break there will carry long term bullish implications and pave the way to 61.8% retracement at 167.78. In case the sideway pattern from 148.42 extends, we'd be looking for strong support from 135.58 and 50% retracement of 122.36 to 148.42 at 135.39 to contain downside.
EUR/JPY Daily Outlook
Daily Pivots: (S1) 128.85; (P) 129.15; (R1) 129.58; More...
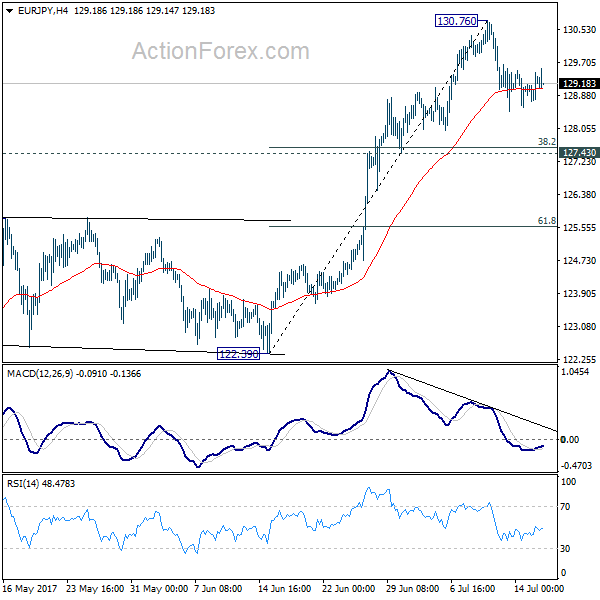
EUR/JPY is staying in consolidation from 130.76 short term top. Intraday bias remains neutral for the moment. Deeper fall might be seen. But downside should be contained by 127.43 cluster support (38.2% retracement of 122.39 to 130.76 at 127.56) and bring rebound. Above 130.76 will extend the larger rally to next key fibonacci level at 134.20.
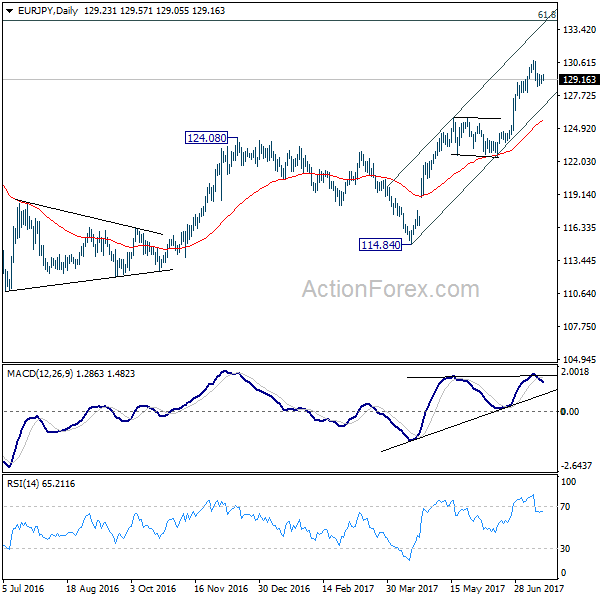
In the bigger picture, the down trend from 149.76 (2014 high) is completed at 109.03 (2016 low). Current rally from 109.03 should be at the same degree as the fall from 149.76 to 109.03. Further rise is expected to 61.8% retracement of 149.76 to 109.03 at 134.20. Sustained break there will pave the way to key long term resistance zone at 141.04/149.76. Medium term outlook will remain bullish as long as 124.08 resistance turned support holds.
EUR/AUD Daily Outlook
Daily Pivots: (S1) 1.4653; (P) 1.4690; (R1) 1.4757; More...
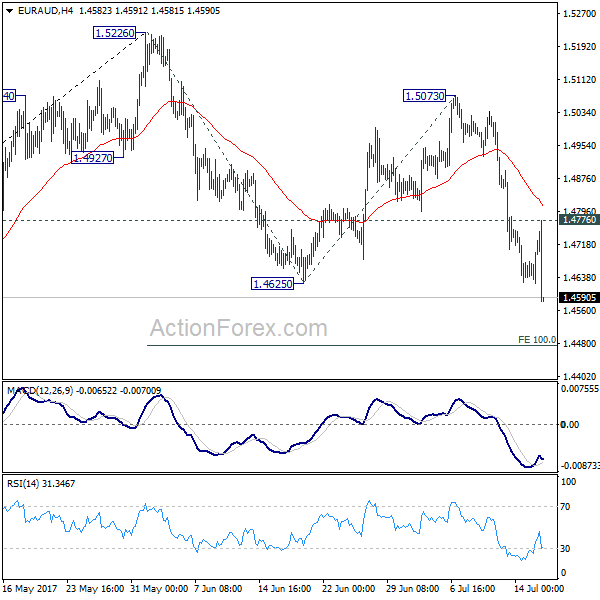
EUR/AUD's fall resumed after brief recovery and reaches as low as 1.4580 so far. Break of 1.4625 confirmed resumption of correction from 1.5226. Intraday bias stays on the downside for 100% projection of 1.5226 to 1.4625 from 1.4472 next. Break there will target 61.8% retracement of 1.3624 to 1.5226 at 1.4236. On the upside, above 1.4776 minor resistance will turn intraday bias neutral first.
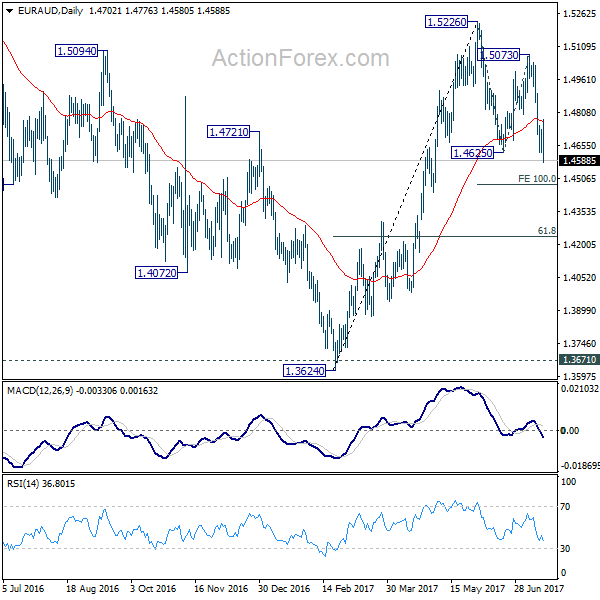
In the bigger picture, we're holding on to the view that corrective decline from 1.6587 medium term has completed at 1.3624. But we will monitor the structure of the decline from 1.5226 to adjust our view. Above 1.5226 will target a test on 1.6587 key resistance. However, further downside acceleration will dampen our view and would drag EUR/AUD lower to retest key support zone around 1.3624.
EUR/GBP Daily Outlook
Daily Pivots: (S1) 0.8758; (P) 0.8778; (R1) 0.8811; More
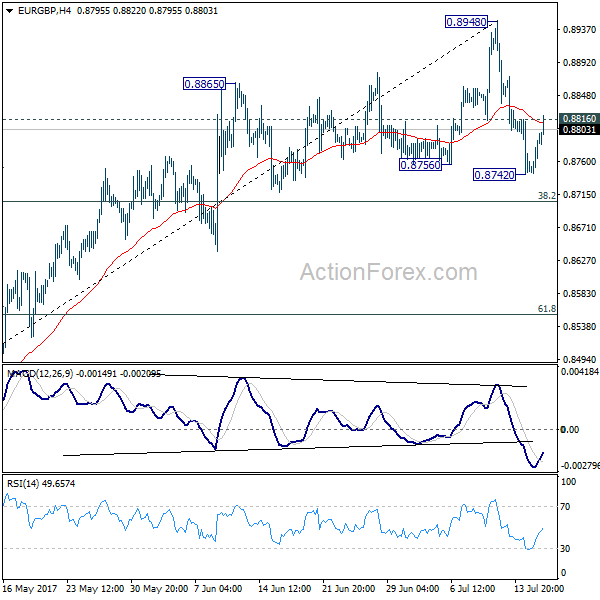
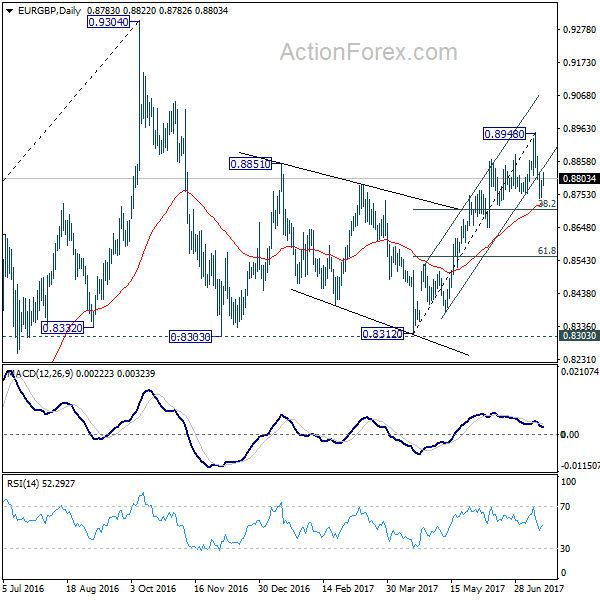
EUR/GBP formed a temporary low at 0.8742 and intraday bias is turned neutral first. As noted before, rebound from 0.8312 should have completed at 0.8948 and deeper fall is expected. Below 0.8742 will target 38.2% retracement of 0.8312 to 0.8948 at 0.8705 first. Break will target 61.8% retracement at 0.8555 next. Overall, deeper fall is expected as long as 0.8948 resistance holds.
In the bigger picture, price actions from 0.9304 are viewed as a medium term corrective pattern. It's uncertain whether it is finished yet. But in case of another fall, we'd expect strong support from 0.8116 cluster support (50% retracement of 0.6935 to 0.9304 at 0.8120) to contain downside and bring rebound. Whole up trend from 0.6935 is expected to resume after consolidation from 0.9304 completes.
EUR/CHF Daily Outlook
Daily Pivots: (S1) 1.1016; (P) 1.1035; (R1) 1.1066; More...
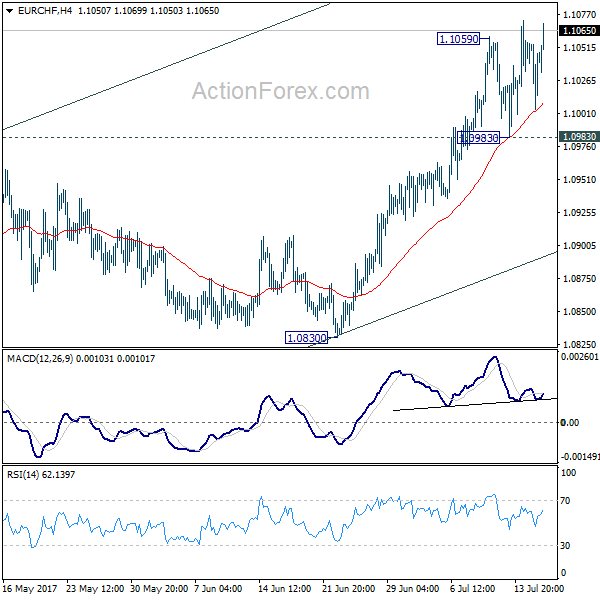
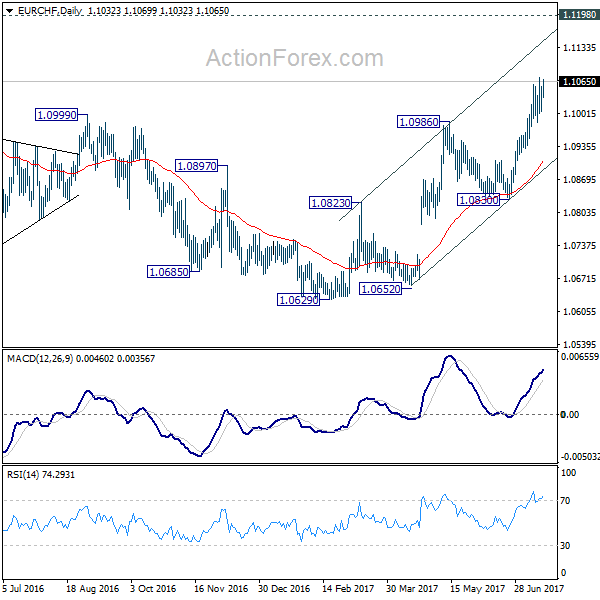
With 1.0983 support intact, further rally is still expected in EUR/CHF. Current rise from 1.0629 should target 1.1127/98 resistance zone. However, break of 1.0983 will indicate short term topping and turn bias back to the downside for 55 day EMA (now at 1.0906).
In the bigger picture, the price actions from 1.1198 are seen as a corrective move. Such correction could have completed after defending 38.2% retracement of 0.9771 to 1.1198 at 1.0653. Decisive break of 1.1198 will resume the long term rise from SNB spike low back in 2015. In such case, EUR/CHF could eventually head back to prior SNB imposed floor at 1.2000. However, rejection from 1.1198 will extend the multi-year range trading with another fall.
Daily Technical Outlook And Review: EUR/USD, GBP/USD, AUD/USD, USD/JPY, USD/CAD, USD/CHF, DOW 30, GOLD
A note on lower timeframe confirming price action...
Waiting for lower timeframe confirmation is our main tool to confirm strength within higher timeframe zones, and has really been the key to our trading success. It takes a little time to understand the subtle nuances, however, as each trade is never the same, but once you master the rhythm so to speak, you will be saved from countless unnecessary losing trades. The following is a list of what we look for:
- A break/retest of supply or demand dependent on which way you're trading.
- A trendline break/retest.
- Buying/selling tails ... essentially we look for a cluster of very obvious spikes off of lower timeframe support and resistance levels within the higher timeframe zone.
- Candlestick patterns. We tend to only stick with pin bars and engulfing bars as these have proven to be the most effective.
We typically search for lower-timeframe confirmation between the M15 and H1 timeframes, since most of our higher-timeframe areas begin with the H4. Stops are usually placed 1-3 pips beyond confirming structures.
EUR/USD
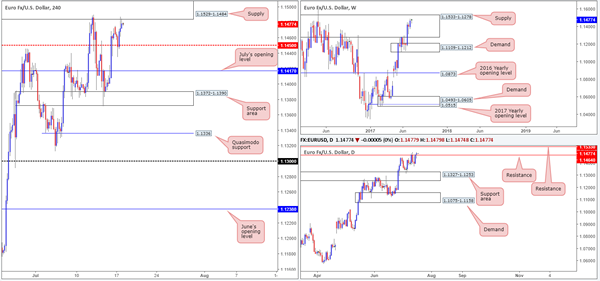
Following a somewhat aggressive whipsaw of the H4 mid-level support at 1.1450 amid yesterday's London open, the single currency is now seen challenging the H4 supply penciled in at 1.1529-1.1484. In Monday's report, the desk highlighted that this supply zone remains of interest, but would only be labeled a valid sell zone should additional confirmation be seen in the shape of a full, or near-full-bodied bearish H4 candle.
The reasoning behind selecting this supply zone as a potential base to sell from is largely due to the area being positioned within a major weekly supply drawn from 1.1533-1.1278. We also liked the fact that daily price was initially being held lower by a resistance line at 1.1464. However, given yesterday's candle closed beyond this barrier, this is certainly a concern now since this could, technically speaking, force the unit up to 1.1533: another daily resistance which happens to denote the top edge of the said weekly supply area.
Our suggestions: Despite the recent close above daily resistance, our team still has faith in the current H4 supply. Still, as we mentioned above, we require H4 candle confirmation in the shape of a full, or near-full-bodied bearish candle, before pulling the trigger.
In the event that this trade comes to fruition, we will be looking for price to engulf 1.1450. This will be our cue to reduce risk to breakeven and watch for the candles to shake hands with July's opening level at 1.1417 to take partial profits.
Data points to consider: German ZEW economic sentiment at 10am GMT+1.
Levels to watch/live orders:
- Buys: Flat (stop loss: N/A).
- Sells: 1.1529-1.1484 ([waiting for a H4 bearish candle – preferably in the form of a full, or near-full-bodied candle – is advised] stop loss: ideally beyond the candle's wick).
GBP/USD
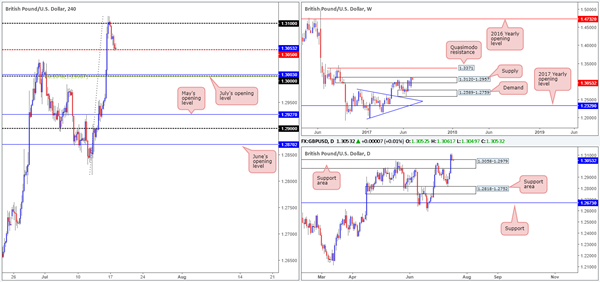
In recent trading, the GBP/USD slammed on the brakes and reversed from the 1.31 handle, dragging the pair back down to a mid-level support at 1.3050. With 1.3050 seen supported by the top edge of a daily support area at 1.3058-1.2979, there's a chance that we could see this level hold firm. Then again, one has to take into account where weekly price is currently trading from: deep within the walls of a supply zone registered at 1.3120-1.2957.
Below 1.3050, however, we have the large psychological level 1.30 on the radar. Not only is this likely to be a watched number by the majority of the market, we can also see that it fuses beautifully with July's opening level at 1.3003, a H4 38.2% Fib support drawn from the swing low at 1.2811 and is also sited nicely within the aforesaid daily support area.
Our suggestions: With 1.3050 so far not registering much bullish activity, our attention is more drawn to the 1.30 level. A long from this number, of course, still carries risk due to where weekly price is trading from. However, we feel with the H4 confluence surrounding 1.30 and the fact that this line is fixed within a daily support area, a bounce, at the very least, is expected to be seen from here.
To be on the safe side though, our team will not commit UNTIL we have pinned down additional confirmation from the lower-timeframe candles (see the top of this report), as our first take-profit target is likely to be 1.31.
Data points to consider: UK inflation data at 9.30am, BoE Gov. Carney speaks at 2.30pm GMT +1.
Levels to watch/live orders:
- Buys: 1.30 region ([waiting for lower-timeframe confirmation to form is advised] stop loss: dependent on where one confirms this level).
- Sells: Flat (stop loss: N/A).
AUD/USD
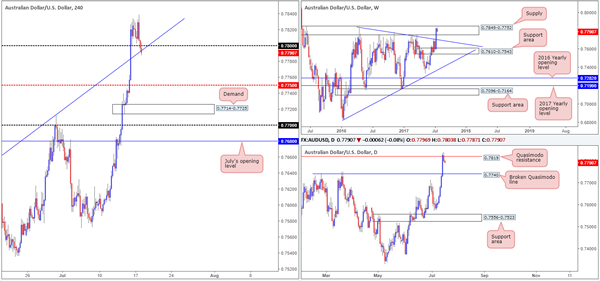
A strong session for the commodity currency last week resulted in weekly price aggressively challenging the supply zone seen at 0.7849-0.7752. In spite of this, the sellers are beginning to make an appearance here, which could potentially bring the market down to retest the trendline support extended from the high 0.7835. In conjunction with weekly flow, daily action recently crossed swords with a Quasimodo resistance at 0.7819 and has so far held firm. The next downside target on this scale can be seen at 0.7740: a broken Quasimodo line.
Adding to the current bearish tone, we have seen the H4 price cross below the 0.78 handle and breach a trendline support etched from the high 0.7635. Technically speaking, this could lead to a move being seen down to the H4 mid-level support at 0.7750, and possibly even the H4 demand at 0.7714-0.7725.
Our suggestions: With all three timeframes expressing bearish intent, the approach our desk has selected is to wait and see if H4 price can CLOSE below the current H4 trendline support and then see if the unit can retest 0.78 before reaching 0.7750. This – coupled with a reasonably sized H4 bear candle, preferably a full, or near-full-bodied bearish candle, would be enough evidence to sell this market, targeting 0.7750 as an initial take-profit zone.
Data points to consider: Australian Monetary policy meeting minutes at 2.30am GMT+1.
Levels to watch/live orders:
- Buys: Flat (stop loss: N/A).
- Sells: Watch for H4 price to engulf the current H4 trendline support and then look to trade any retest seen at 0.78 thereafter ([waiting for a H4 bearish candle – preferably in the form of a full, or near-full-bodied candle – to form following the retest is advised] stop loss: ideally beyond the candle's wick).
USD/JPY
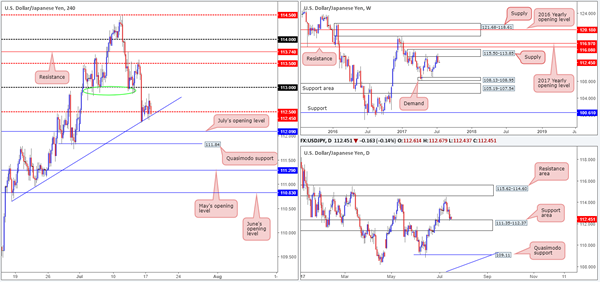
Monday's session, as you can see, took on more of a sober tone in comparison to Friday's selloff. H4 price remains afloat above the mid-level support at 112.50, which boasts additional support from a H4 trendline taken from the low 110.64 and the top edge of a daily support area at 111.35-112.37.
Given the somewhat lackluster performance yesterday, much of the following report will echo thoughts put forward in Monday's analysis…
Our suggestions: Buying from 112.50 seems a logical idea if one dismisses the weekly timeframe. The next target from 112.50 is likely to be the 113 band given how well it served as support since the beginning of the month (see the green circle).
While it is tempting to pull the trigger and buy from 112.50, our team is still reluctant to commit, due to weekly price trading from supply at 115.50-113.85. In regard to selling this market, we're also very hesitant. This is largely because of the current daily support area/H4 mid-level support in motion right now, and how restricted H4 structure is seen below 112.50: July's opening level at 112.09, followed closely by the Quasimodo support level at 111.84.
Data points to consider: No high-impacting events on the docket today.
Levels to watch/live orders:
- Buys: Flat (stop loss: N/A).
- Sells: Flat (stop loss: N/A).
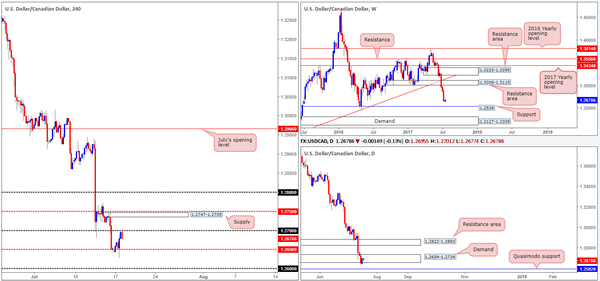
USD/CAD
After a brief spell beneath daily demand at 1.2654-1.2734, the bulls kicked into action yesterday and ended the day on a somewhat positive note. Be that as it may, as the weekly candles clearly point out, the next area of support does not come into view until we reach 1.2538, thus the odds of further selling being seen this week, in our opinion, is relatively high.
Recently however, the H4 timeframe shows price bounced from 1.27, following a move up from the mid-level support base at 1.2650. We believe that should the current H4 candle close as is, this could be a reasonable location to sell from. Why we believe this to be the case is as follows:
Daily buyers are likely weakened within the current demand due to the recent breach.
Weekly price shows little support on the horizon.
The next downside target on the H4 timeframe, apart from 1.2650, would be the 1.26 handle which is closely positioned to a daily Quasimodo support at 1.2592 (the next downside target beyond the current daily demand).
Our suggestions: A full-bodied H4 bear candle printed off of 1.27 would, in our view, be enough to validate a short entry in this market, with an overall take-profit target set at 1.26.
Data points to consider: No high-impacting events on the docket today.
Levels to watch/live orders:
- Buys: Flat (Stop loss: N/A).
- Sells: Sell on the close of the current H4 candle should it close at its lows (stop loss: 1.2703).
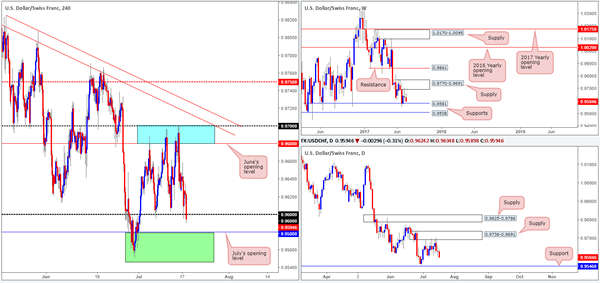
USD/CHF
Since the 5th May, the H4 candles have been consolidating between 0.97/0.9680 (round number/June's opening level – blue zone) and the 0.96 handle. Of late, however, price has crossed below the 0.96 handle and looks poised to challenge July's opening level at 0.9580. What's also noteworthy about this level is that it sits on top of a support area marked in green comprised of a daily support at 0.9546 and the weekly support at 0.9581.
As we have highlighted in numerous reports, this green area is somewhere our team has already bought from in the past and will likely do so again, if a H4 candle action forms a full, or near-full-bodied candle.
Our suggestions: Basically, our team is going to be closely watching 0.9546/0.9581 for potential longs today. Should this trade come to realization we'll be looking for price to close above 0.96. This will, for us at least, be our cue to reduce risk to breakeven and begin trailing the market up to the 0.9680 region: June's opening level.
Data points to consider: No high-impacting events on the docket today.
Levels to watch/live orders:
- Buys: 0.9546/0.9581 ([waiting for a H4 bull candle – preferably a full, or near full-bodied candle – to form is advised] stop loss: ideally beyond the candle's tail).
- Sells: Flat (Stop loss: N/A).
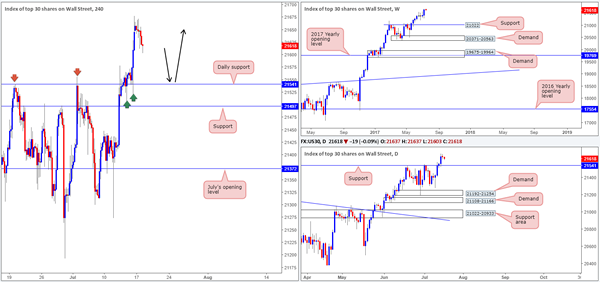
DOW 30
Following a strong move north on Friday, US equity prices have begun to pull back from a record high of 21677. Now, as far as we're concerned, the next downside support target in view is the daily support marked at 21541. This level, as signified by the green/red arrows, is a level of significance given how it has responded over the past month. So, therefore, our desk remains watchful of this daily level for potential longs today.
Our suggestions: A H4 retest of 21541 – coupled with a reasonably sized H4 bull candle, preferably a full, or near-full-bodied candle, would be enough evidence for us to confirm a long position as valid. In regard to take-profit targets, at this point we are quite open as we have yet to see what structure forms on approach to this number. Overall though, we do want to try and trail this market in an attempt to join the current uptrend.
Data points to consider: No high-impacting events on the docket today.
Levels to watch/live orders:
- Buys: 21541 ([waiting for a H4 bull candle – preferably a full, or near full-bodied candle – to form is advised] stop loss: ideally beyond the candle's tail).
- Sells: Flat (stop loss: N/A).
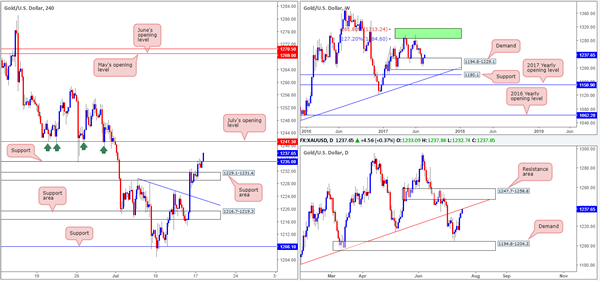
GOLD
Kicking this morning's analysis off with a look at the weekly timeframe shows that the buyers are gathering momentum from demand at 1194.8-1229.1. While this may be encouraging for potential buyers, it might be worth noting that daily price is currently seen touching gloves with a trendline resistance extended from the low 1180.4.
Over on the H4 candles, the market looks poised to challenge July's opening level seen nearby at 1241.3. In view of how well July's opening level held as support back in June (see green arrows), and considering that it's positioned nearby the aforementioned daily trendline resistance, we feel price will very likely respond from this angle.
Our suggestions: Shorting from 1241.3, nonetheless, is still a very chancy trade given where weekly price is trading from right now. To confirm bearish intent at the noted H4 level, we would strongly recommend waiting for the lower-timeframe candles to show signs that the bears have interest in this level (see the top of this report).
Ultimately, if this trade comes to fruition we would keep a close eye on the H4 support at 1235.0. Any signs of bullish strength from here would likely force us to cut the trade short, since getting caught on the wrong side of weekly flow will not do your account any favors!
Levels to watch/live orders:
- Buys: Flat (stop loss: N/A).
- Sells: 1241.3 region ([waiting for lower-timeframe confirmation to form is advised] stop loss: dependent on where one confirms this level).
European Open Briefing: AUD/USD Has Reached Fresh Highs And Is Likely To Test 0.80 Soon
Global Markets:
- Asian stock markets: Nikkei down 0.75 %, Shanghai Composite fell 0.60 %, Hang Seng declined 0.10 %, ASX 200 lost 1.15 %
- Commodities: Gold at $1237 (+0.30 %), Silver at $16.17 (+0.40 %), WTI Oil at $46.10 (+0.20 %), Brent Oil at $48.50 (+0.20 %)
- Rates: US 10-year yield at 2.30, UK 10-year yield at 1.28, German 10-year yield at 0.58
News & Data:
- New Zealand CPI q/q 0.0 % vs 0.2 % expected
- New Zealand CPI y/y 1.7 % vs 1.9 % expected
- China House Prices y/y 10.2 % vs 10.4 % previous
- Australia Roy Morgan Weekly Consumer Confidence Index 112.5 (prev 113.0)
- PBoC Sets Yuan Mid-Point At 6.7611
- Oil prices stable as strong demand meets ongoing supply glut – RTRS
Markets Update:
The US Dollar came under renewed pressure after it became clear that US President Trump's healthcare reform is dead. This makes it unlikely that his economic reforms will pass either. EUR/USD rallied above 1.15 and there is little resistance now until 1.16. GBP/USD however, is struggling with resistance at 1.31. The pair might remain quiet ahead of today's inflation release, which could determine its short-term direction.
USD/JPY tested 112 and bounced off it. Support is also seen at the 200 DMA at 111.80. A dovish Bank of Japan and risk-on sentiment in markets have kept the USD/JPY supported so far. However, a daily close below the 200 DMA would signal that further losses are ahead.
AUD/USD has reached fresh highs and is likely to test 0.80 soon. Commodity prices have bounced and recent Chinese econ data has been strong – two factors which have kept the AUD bid. Meanwhile, NZD/USD came under pressure after weak inflation data, but managed to retrace the losses amid broad USD selling.
Upcoming Events:
- 09:30 BST – UK CPI
- 10:00 BST – German ZEW Economic Sentiment
- 10:00 BST – Euro Zone ZEW Economic Sentiment
- 14:30 BST – Bank of England Governor Carney speaks
Elliott Wave View: DXY More Downside
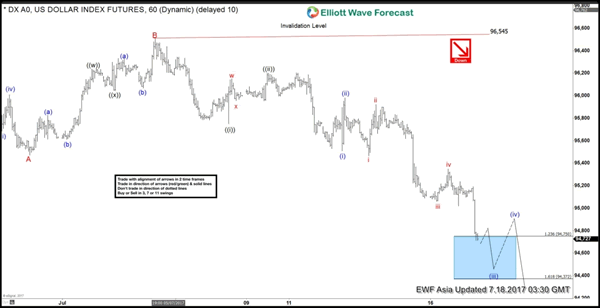
Short term DXY (USD Index) Elliott Wave view suggests the decline to 95.47 ended Minor wave A, and bounce to 96.51 high ended Minor wave B. Decline from there is unfolding as an Elliott wave Impulse structure with extension where Minute wave ((i)) ended at 95.75 and Minute wave ((ii)) ended at 96.2. Minute wave ((iii)) is subdivided into another impulsive wave of a smaller degree. Minutte wave (i) ended at 95.51, Minutte wave (ii) ended at 95.98 and Minutte wave (iii) is currently in progress. Expect Minutte wave (iii) to end at 94.3 – 94.7 area, then the Index should bounce in Minutte wave (iv) before turning lower again. We don't like buying the Index and expect bounces to find offer in 3, 7, or 11 swing for more downside.
DXY 1 Hour Elliott Wave Chart
Dollar Tumbles as Trump’s Health Care Bill Collapses, Aussie Boosted by Hawkish RBA Minutes
Dollar tumbles sharply as two Republicans senators announced their rejection of the US President Donald Trump's health care bill. The current version is short of at least two votes to advance and is seen as effectively dead by analysts. The development will further delay the work on tax and fiscal reforms, which are scheduled to come after health care. Markets continue to questioned the ability of Trump on pushing through his economic agenda and delivering his election promises. That adds to doubt of whether the economy could sustain another rate hike by Fed this year. Meanwhile, New Zealand Dollar follows as the second weakest currency after lower than expected CPI reading. On the other hand, Australian Dollar leads other currencies high as boosted by hawkish RBA minutes.
Two more Senate Republicans opposed to Trump's health care bill
In US, Republican senators Mike Lee of Utah and Jerry Moran of Kansas announced their opposition to Trump's heath care bill, which aimed at repealing the Affordable Care Act, known as Obamacare. Lee said in his statement that "in addition to not repealing all of the Obamacare taxes, it doesn't go far enough in lowering the premiums for middle-class families; nor does it create enough free space fro the most costly Obamacare regulations". Moran said that "we should not put our stamp of approval on bad policy" and he criticized that the health care bill was written with a "closed-door process" and the Senate must start the bill fresh with open debates.
Two other Republican senators have already voiced their objections, including Rand Paul of Kentucky and Susan Collins of Maine. That left Majority Leader Mitch McConnell's proposal two votes short of advancing. And some analysts see the proposal as effectively dead. It's unknown what Trump would do next to push the health care reform but he tweeted that "republicans should just REPEAL failing ObamaCare now & work on a new Healthcare Plan that will start from a clean slate. Dems will join in!" At the same time, markets are clearly dissatisfied with the progress of Trump's work and remain doubtful on when and even whether he is able to push through the promised tax reforms and fiscal policies.
RBA minutes: 3.5% could be the appropriate neutral rate
RBA minutes for the July meeting suggested that policymakers acknowledged the economic growth and the improvement in the labor market recently. The members also discussed the appropriate neutral rate which they believed should be at 3.5%, well above the current cash rate of 1.5%. This heightened market expectations of a potential rate hike in the near-term. As such, Aussie jumped to a 2-year high after the release of the minutes. More in Speculations Of RBA Rate Hike Heightened, As Members Discussed Neutral Rate.
Kiwi plummets as CPI affirmed RBNZ's neutral stance
New Zealand Dollar tumbles sharply after weaker than expected inflation data. Over the quarter, CPI rose 0.0% qoq, down from prior quarter's 1.0% qoq and missed expectation of 0.2% qoq. Annually, CPI slowed to 1.7% yoy, down from 2.2% yoy and missed expectation of 1.9% yoy. The reading now clearly support RBNZ's neutral stance. There were some questions and disappointment as RBNZ didn't turn hawkish after CPI shoot to 2.2% yoy back in Q1. But now it's obvious that the central bank has made the correct decision.
ETF purchases questioned ahead of BoJ meeting
Ahead of BoJ meeting later this week, there are reports that some officials are concerned with the sustainability of ETFs as part of the asset purchase program. The JPY 6T annual purchase of ETFs is subject of continued questioning. In particular, the central bank is already owning more than 70% of all shares in Japan-listed ETFs at the end of June. And there were criticism that such purchase is artificially driving the rise in stocks, yet it's unsure how this would help drive inflation up. But overall, BoJ is not expected to announce any change in monetary policy this week. Meanwhile, the central bank is expected to lower inflation projections and raise growth projections.
UK CPI to watch today
UK inflation data will be a key to watch in European session today. Headline CPI is expected to be unchanged at 2.9% yoy in June while core CPI is expected to say at 2.6% yoy. Much volatility is seen in Sterling recently, in particular in crosses. The hawkish turn in BoE Governor Mark Carney raised the hope of a rate hike by the central bank in near term. But such expectation was dented by a string of weaker than expected sentiment and growth data. The key will lie in inflation and more MPC member would turn to the hawk camp should CPI surprises to the upside today and show little sign of topping soon. Also to be released from UK are RPI, PPI and house price index. Elsewhere, Germany will release ZEW economic sentiments, US will release import price index and NAHB housing market index.
AUD/USD Daily Outlook
Daily Pivots: (S1) 0.7780; (P) 0.7809; (R1) 0.7826; More...
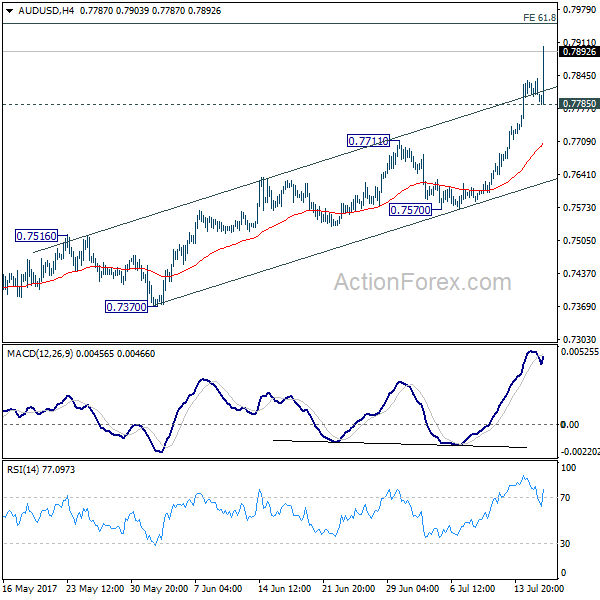
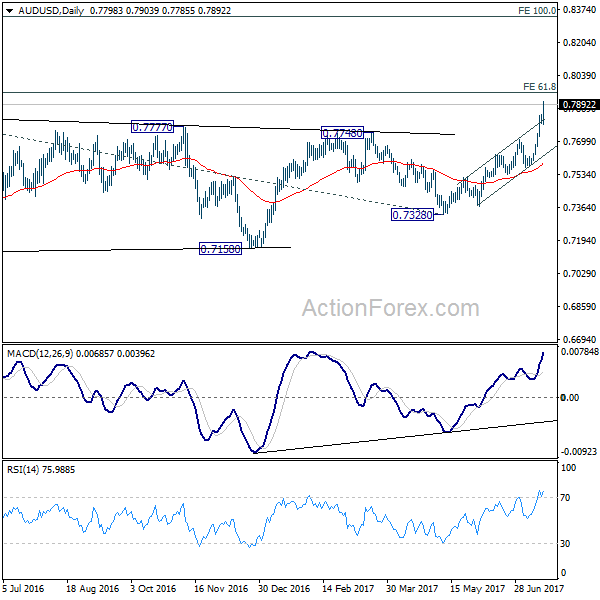
AUD/USD's rise resumed after brief consolidation and reaches as high as 0.7903 so far. The break of near term channel resistance indicates upside acceleration. Intraday bias stays on the upside for 61.8% projection of 0.6826 to 0.7833 from 0.7328 at 0.7950 next. Break there will target 100% projection at 0.8335. On the downside, below 0.7785 will turn intraday bias neutral and bring consolidations before staging another rally.
In the bigger picture, current development suggests that rebound from 0.6826 is developing into a medium term rise. There is no confirmation of trend reversal yet and we'll continue to treat such rebound as a corrective pattern. But in any case, further rise is now expected to 55 month EMA (now at 0.8100) or even further to 38.2% retracement of 1.1079 to 0.6826 at 0.8451. Break of 0.7328 support is needed to confirm completion of the rebound. Otherwise, further rise is now expected.
Economic Indicators Update
| GMT | Ccy | Events | Actual | Forecast | Previous | Revised |
|---|---|---|---|---|---|---|
| 22:45 | NZD | CPI Q/Q Q2 | 0.00% | 0.20% | 1.00% | |
| 22:45 | NZD | CPI Y/Y Q2 | 1.70% | 1.90% | 2.20% | |
| 1:30 | AUD | RBA Minutes July | ||||
| 8:30 | GBP | CPI M/M Jun | 0.20% | 0.30% | ||
| 8:30 | GBP | CPI Y/Y Jun | 2.90% | 2.90% | ||
| 8:30 | GBP | Core CPI Y/Y Jun | 2.60% | 2.60% | ||
| 8:30 | GBP | RPI M/M Jun | 0.40% | 0.40% | ||
| 8:30 | GBP | RPI Y/Y Jun | 3.60% | 3.70% | ||
| 8:30 | GBP | PPI Input M/M Jun | -0.90% | -1.30% | ||
| 8:30 | GBP | PPI Input Y/Y Jun | 9.30% | 11.60% | ||
| 8:30 | GBP | PPI Output M/M Jun | 0.10% | 0.10% | ||
| 8:30 | GBP | PPI Output Y/Y Jun | 3.40% | 3.60% | ||
| 8:30 | GBP | PPI Output Core M/M Jun | 0.10% | 0.10% | ||
| 8:30 | GBP | PPI Output Core Y/Y Jun | 2.80% | 2.80% | ||
| 8:30 | GBP | House Price Index Y/Y May | 3.00% | 5.60% | ||
| 9:00 | EUR | German ZEW (Economic Sentiment) Jul | 18 | 18.6 | ||
| 9:00 | EUR | German ZEW (Current Situation) Jul | 88 | 88 | ||
| 9:00 | EUR | Eurozone ZEW (Economic Sentiment) Jul | 37.2 | 37.7 | ||
| 12:30 | USD | Import Price Index M/M Jun | -0.20% | -0.30% | ||
| 14:00 | USD | NAHB Housing Market Index Jul | 67 | 67 | ||
| 20:00 | USD | Net Long-term TIC Flows May | 20.3B | 1.8B |
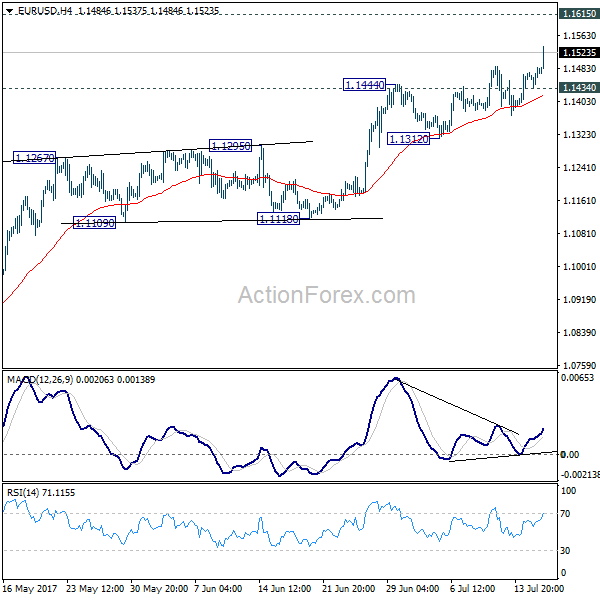
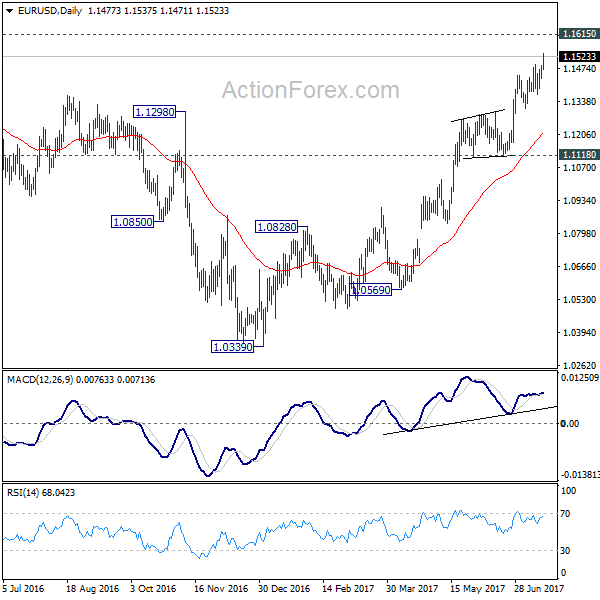
EUR/USD Daily Outlook
Daily Pivots: (S1) 1.1446; (P) 1.1466 (R1) 1.1498; More.....
EUR/USD's rally resumed and surges to as high as 1.1537 so far. Intraday bias is back on the upside for 1.1615 key resistance next. Decisive break there will pave the way to 1.2 handle. On the downside, below 1.1434 minor support will turn bias neutral and bring retreat. But near term outlook will stay bullish as long as 1.1312 support holds.
In the bigger picture, the firm break of 1.1298 resistance further affirm medium term reversal. That is, an important bottom was formed at 1.0339 on bullish convergence condition in weekly MACD. Further rise would be seen to 55 month EMA (now at 1.1763). Sustained break there will pave the way to 38.2% retracement of 1.6039 (2008 high) to 1.0339 (2017 low) at 1.2516 next. This will now remain the favored case as long as 1.1118 support holds.