Sample Category Title
AUD Bounces Higher Amid Hawkish RBA Minutes And Broad US Dollar Weakness
Surging demand for higher yielding currencies send AUD
Lacklustre economic data are piling up in US, the Fed has abandoned its hawkish rhetoric for a cautious one amid faltering inflation pressures. Since mid-May, the greenback has lost more than 5.2% on a trade-weighted basis, while the dollar index fell below 95, its lowest level since September last year, as US rates reversed gains.
Prospects of low interest rates in US have prompted investors to seek higher returns elsewhere and more specifically across the Pacific, namely Australia. Interest rate differential between Aussie and US bonds is appealing for investors. Moreover, the Reserve Bank of Australia has revised its economic outlook to the upside recently and acknowledge the recent improvement, both on the growth and inflation sides.
Investors did not wait on the RBA hawkish tone to start building long AUD position. Speculative positioning, as reported by the CFTC, showed that total net long future position rose from zero to 37.5% of total open interest over the past six weeks. Despite this extreme level, we think they is still room for further increase of speculative positioning as investors will continue to discount a tightening move from the Fed in the short-term.
AUD/USD has broken the key 0.7849 resistance (high from June 2015) and is on its way to test the following one at 0.8164 (high from May 2015). However, a temporary correction cannot be ruled out in the short-term but it will only be a step back to jump higher.
US: downside risks on import prices
The greenback is getting weaker against major G10 currencies and the euro dollar is now back above 1.15 for the first time since May 2016. The bullish trend seems very deep to us and there are two main points to address.
First of all, The Fed is back on hold regarding the normalization of the monetary policy. Anyway, higher interest rates would likely trigger a recession due to the level of indebtness of the North-American country.
Second of all, we have always considered that the true state of the US economy was overestimated and this appear to be the case. Fundamentals are mixed. Today will be released import prices for June and markets expect a decline of -0.2%. In May imports price already declined by 0.3% m/m. Excluding Oil, import prices have stood still.
There is then no fundamental for the greenback to strengthen in the medium rum. The US CPI recoded four successive declining monthly print. The Fed target seems less and less attainable in a reasonable timeframe. As a result, we firmly believe that reloading bullish positions on the dollar is a good bet within the next few months.
Euro Zone Inflation Confirmed At 1.3% In June
'There is simply not enough (or any) evidence that inflation is picking up and so a change to the inflation risk assessment by the ECB cannot be justified.' - Richard McGuire, Rabobank.
Consumer inflation in the Euro zone rose in line with analysts' forecasts last month, official figures revealed on Monday. Eurostat reported that its Final Consumer Price Index came in at 1.3% in June, matching the flash estimate and falling down from 1.4% registered in preceding month. Meanwhile, the so-called core inflation rate rose 1.1% on an annual basis, following May's 0.9% increase. Moreover, the services sector inflation increased 1.6%, compared to 1.1% seen in the same month a year ago. Back in June, the ECB President Mario Draghi announced that consumer prices' growth was affected by temporary factors, such as after-effects of energy and commodity price shocks. However, after strong Euro zone's economic recovery at the beginning of the year, any further weakness in inflation is likely to diminish expectations for the ECB to remove accommodation. Despite recent figures being almost sufficient to encourage policy tightening, the European Central Bank is expected to be cautious over monetary stimulus withdrawal. Economists anticipate no changes in key interest rates until inflation reaches the 2% target.
New Zealand’s Inflation Flat In Q2
'Household basics like rent, food, and electricity all hit consumers' pockets harder this quarter.' - Jason Attewell, Statistics NZ
Inflation in New Zealand hampered unexpectedly in the second quarter, suggesting that declining oil prices were restraining cost pressures throughout the country's economy. Statistics New Zealand reported on Monday that its Consumer Price Index was flat on a seasonally adjusted basis in the June quarter, following a 1% rise in the Q1 and falling behind expectations for a 0.2% increase. The largest upward contribution was provided by higher food prices with 0.7% jump pushed by vegetable prices. Meanwhile, the largest fall was registered in transport prices, which were down 1.3% amid lower prices of petrol and seasonally cheaper domestic airfares and car rentals. On an annual basis, the most of downward pressure came from lower telecommunication services prices and cheaper equipment. In regional terms, Auckland registered the highest increase of 3.0% in the reported quarter. The Reserve Bank of New Zealand previously signalled that it was set to keep its interest rates at a record low of 1.75% until late 2019, but recent data fuelled expectations for a rate hike by mid-2018.
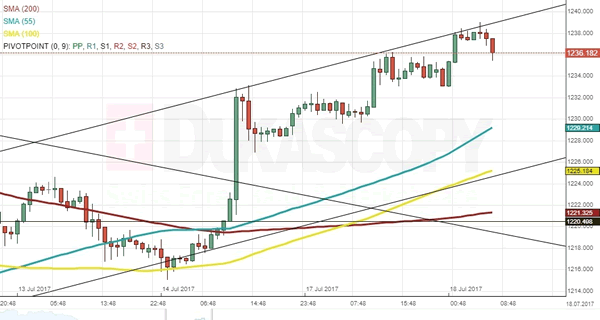
XAU/USD Analysis: Faces Resistance Line
The upper trend line of the adjusted small scale ascending channel pattern is providing resistance to the commodity price. However, it has to be noted that the trend lines drawn on the yellow metal's charts have to be taken into account as indicators of where the zones of significance are located at. Meanwhile, it is highly likely that the yellow metal will soon begin a retreat down to the lower trend line of the channel up pattern. The bullion's price is most likely going to attempt to find support in the 55-hour SMA, which on Tuesday morning was located just below the 1,230 mark. In the meantime, the lower trend line of the ascending channel was supported by the 100-hour SMA near the 1,225 mark.
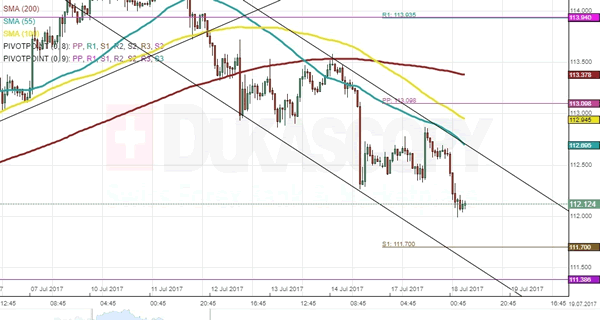
USDJPY Analysis: Stranded In Channel
On Monday, the US Dollar remained in a relatively constant range, even despite the massive leap mid-session. This situation changed this morning when the American currency fell down to the 112.10 mark. This momentum downwards could continue in the upcoming hours and therefore move the rate closer to the weekly S1 at 111.70. The given support, however, is very strong, reinforced by the 55-, 100– and 200-day SMAs apparent on the daily chart. Only substantial bearish sentiment may dash through this area. Thus, it is more likely that a reversal to the upside could occur there. In the meantime, another scenario may set the pair for a reversal near 112.00, thus establishing the upper channel boundary in the 112.20/50 territory as a possible trading range until Wednesday morning.
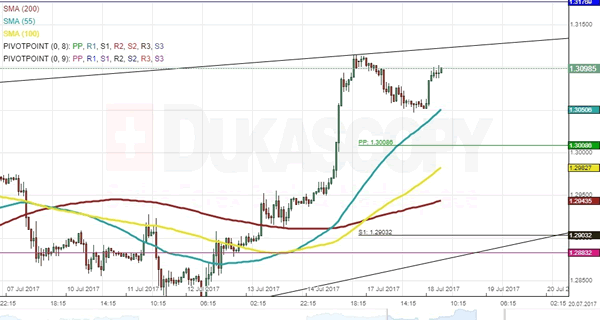
GBP/USD Analysis: Changes Sentiment On Tuesday
GBP/USD was driven by slight momentum downwards on Monday that led the pair towards the 55-hour SMA circa 1.3040. This level, however, was no reached, as morning bulls reversed its direction north. Afterwards, the Sterling continued to move upwards, but with very limited gains. In case fundamental events do not change the current market sentiment, the pair is likely to edge higher and close with gains. Immediate resistance is set by the upper channel line circa 1.3120, while more significant upside barrier is the monthly R1 at 1.3177. In case the rate falls, the 55-hour SMA should support it from further depreciation. By and large, the Pound is expected to trade somewhere near the upper channel boundary on Wednesday morning.
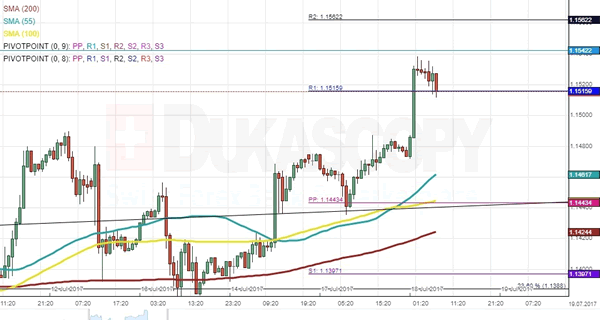
EUR/USD Analysis: Surges As Expected
The forecasted jump of the common European currency against the US Dollar has occurred. Finally, after long expectations, the EUR/USD pair has reached above the 1.15 mark. On Tuesday morning the pair traded above the weekly R1, which is located at the 1.1516 mark. Meanwhile, the pair faced the first monthly resistance at the 1.1542 mark. By looking at the hourly chart, it could be assumed that the surge is set to continue. However, one should look at clues regarding the future on larger timeframe charts. As it has to be noted that the currency exchange rate is approaching long term resistance trend lines, which might stop the surge near the 1.1550 mark. On the other hand the markets might react soon to the changes in the monetary policy both in the EU and the US.
Dollar Pressured Against All Majors, RBA Minutes Push Aussie To 2-Year High
As the Asian trading session was about to close, the US dollar was trending downward against most currencies on overnight news that the repeal of Obamacare is getting another push-back. The aussie rose following the release of the Reserve Bank of Australia's minutes and the kiwi had a short tumble on the disappointing inflation figures.
The greenback tumbled against most currencies overnight on news that two more Republican Senators would oppose the healthcare reform bill unveiled by their party last week. The US currency weakened as the latest news cast another cloud over Trump's presidency by spurring doubts on the White House's ability to pass legislation. The dollar index, a broad measure of the greenback's strength, was last trading at 94.80, down 0.35%. As the news broke, the dollar fell against the yen breaching the 112 level, however it recovered slightly to last trade at 112.26 yen. Euro/dollar shot above the 1.15 level, at a 14-month high of 1.1537, and was last trading at 1.1515.
Later in the session, closely monitored Germany's forward looking ZEW investor sentiment survey for July will be released.
The release of the RBA's minutes gave an additional push to the aussie against its US counterpart to reach a two-year high. The minutes confirmed the central bank's positive take on the economy and that the RBA's stance on the neutral rate is at 3.5%, indicating there is a lot of scope for more interest rate hikes. The RBA's current cash rate is 1.5%. The yield on 10-year Australian government bonds increased 3 basis points to 2.76%. Aussie/dollar continued firming post the news to last trade at 0.7915.
The New Zealand dollar sank against the greenback in early hours of the session following the release of the disappointing inflation figures for the second quarter. Consumer inflation stagnated, quarter-on-quarter, which comes after 1% growth in the first quarter and below the expected level of a 0.2% gain. Annually CPI grew 1.7% in quarter to June-end, also below the prior period's gain of 2.2% and below expectations of 1.9%. Kiwi/dollar tumbled to 0.7262 following the news, but managed to recover on US dollar weakness as the Asian session was about to close. The pair was last trading at 0.7353.
Apart this week's impact from politics, sterling could move significantly following the release of June consumer inflation later in the day. The second round of negotiations around the UK's exit from the EU has started yesterday and will last till Thursday. The pound was under some pressure against the US dollar yesterday, but remained above the 1.30 level for most of today's trading.
Oil prices tumbled during the Asian session, following a drop during late Monday trading, as expectations for a monthly rise in U.S. shale-oil production helped to push prices back. WTI was last trading at $45.88 a barrel and Brent was at $48.32.
Gold prices continued gaining supported by dollar weakness. The precious metal has been trending upwards for the past three days and was last trading at $1,237.01 an ounce.
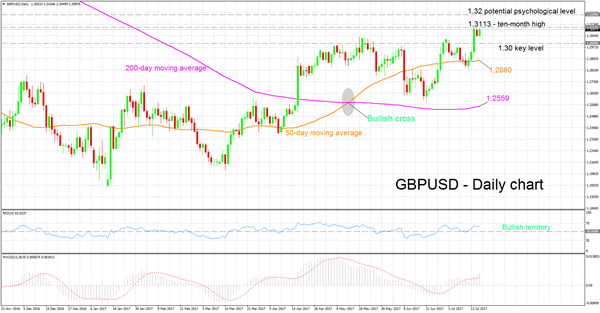
GBPUSD Bullish, Eyes 10-Month High
GBPUSD closed higher in the preceding three out of four trading days. During Friday’s trading, it advanced by a hefty 1.3%, reaching a ten-month high of 1.3113 along the way.
Technical indicators including the MACD and RSI are painting a bullish picture for the pair. In particular, the MACD is positive as well as above the red signal line. The RSI indicator is in bullish territory at 64 and keeps heading higher, indicating the existence of positive momentum in the near-term.
Should the price edge higher, the area around Friday’s high of 1.3113 could pose a barrier to further advances. Notice that the price is currently close to this level. A successful break above would divert attention to the area around 1.32, a potential psychological mark that might act as resistance.
If the price declines, the area around the 1.30 handle, which was of significance in the recent past, could provide support. Should it be violated, the area around the current level of the 50-day moving average (MA) at 1.2880 would be eyed next.
Regarding the medium-term picture, the pair has been in an overall uptrend since the start of the year. This supports the positive medium-term signal given by the bullish cross that was formed during May when the 50-day MA moved above the 200-day one. Additional supportive evidence for the bullish outlook comes from the price recently crossing above both the 50- and 200-day MAs.
To sum up, both the short- and medium-term are looking bullish at the moment.
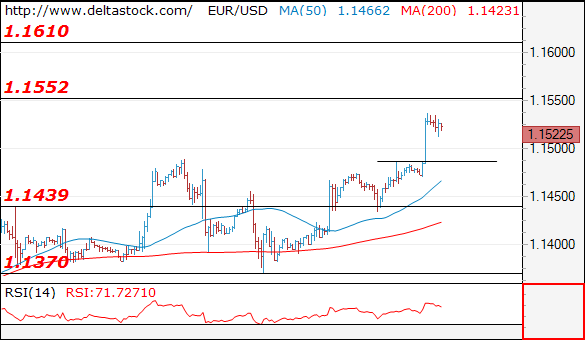
Forex Technical Analysis: EUR/USD, USD/JPY, GBP/USD
EUR/USD
Current level - 1.1522
Today's break through 1.1490 resistance confirms the positive bias, for a test of 1.1550, en route to 1.1610 area. Key intraday support lies at 1.1480.
| Resistance | Support | ||
| intraday | intraweek | intraday | intraweek |
|
1.1550 |
1.1610 |
1.1480 |
1.1370 |
|
1.1610 |
1.1720 |
1.1370 |
1.1290 |
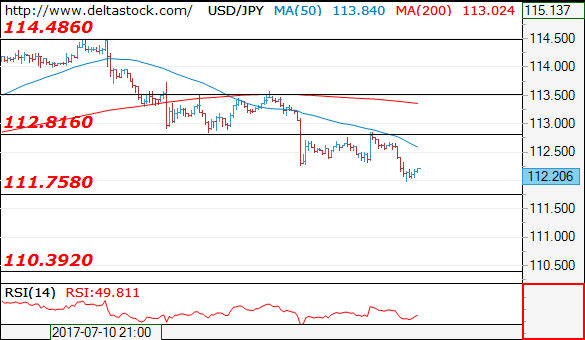
USD/JPY
Current level - 112.20
Yesterday's precise test of 112.80 has finalized the consolidation pattern above 112.25 and the downtrend is renewed, towards 110.30 zone.
| Resistance | Support | ||
| intraday | intraweek | intraday | intraweek |
|
112.80 |
114.50 |
111.75 |
111.75 |
|
113.50 |
115.50 |
110.30 |
110.20 |
GBP/USD
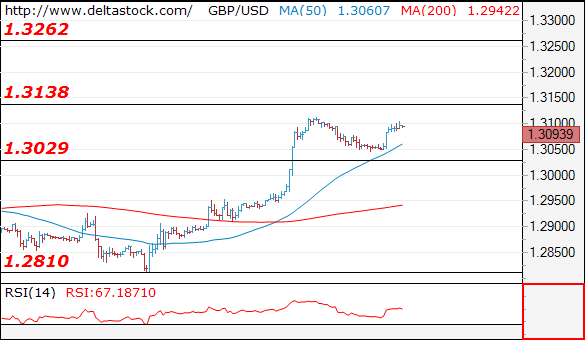
Current level - 1.3093
My outlook here remains bullish, for a continuation of the upmove, through 1.3130 minor resistance, towards 1.3260 zone.
| Resistance | Support | ||
| intraday | intraweek | intraday | intraweek |
|
1.3130 |
1.3260 |
1.3030 |
1.2810 |
|
1.3260 |
1.3500 |
1.2970 |
1.2480 |