
Sample Category Title
EUR/GBP Failed To Test Strong Support, EUR/CHF Buying Pressures Continue, BITCOIN Back Above $2200.
EUR/GBP Failed to test strong support
EUR/GBP has failed to monitor strong support at 0.8719 (16/06/2017 low). Expected to show renewed monitoring of support given at 0.8719.
In the long-term, the pair has largely recovered from recent lows in 2015. The technical structure suggests a growing upside momentum. The pair is trading above from its 200 DMA. Strong resistance can be found at 0.9500 psychological level.
EUR/CHF Buying pressures continue.
EUR/CHF is still trading above psychological level at 1.1000. Selling pressures are very weak at the moment. Hourly support is located at a distance at 1.0922 (30/06/2017 low). Expected to inch higher.
In the longer term, the technical structure is mixed. Resistance can be found at 1.1200 (04/02/2015 high). Yet,the ECB's QE programme is likely to cause persistent selling pressures on the euro, which should weigh on EUR/CHF. Supports can be found at 1.0184 (28/01/2015 low) and 1.0082 (27/01/2015 low).
BITCOIN Back above $2200.
Bitcoin has recovered after the sell-off this weekend. Strong hourly resistance can be found at 2417 (13/07/2017 high) and hourly support is now given at 1852 (14/07/2017 low). Expected to show some sustained short-term bullish momentum.
In the long-term, the digital currency has had an exponential growth. There are decent likelihood that the asset will consolidate above $1500. Long-term support is given at $1464 (04/05/2017 low).
USD/CHF Ready To Test Strong Support, USD/CAD Important Selling Pressures, AUD/USD Surging.
USD/CHF Ready to test strong support.
USD/CHF is lower and has exited the shortterm bullish trend. Hourly resistance can be found at 0.9696 (09/06/2017 high). Strong resistance is given at 1.0107 (10/04/2017 high). Hourly support is given at 0.9553 (30/06/2017 low). Expected to to show further weakness.
In the long-term, the pair is still trading in range since 2011 despite some turmoil when the SNB unpegged the CHF. Key support can be found 0.8986 (30/01/2015 low). The technical structure favours nonetheless a long term bullish bias since the unpeg in January 2015.
USD/CAD Important selling pressures.
USD/CAD is going lower and the pair remains in a strong bearish momentum. Hourly support given at 1.2681 (12/07/2017 low) has been broken. Resistance is located at 1.3014 (02/15/2017). Expected to show continued bearish pressures.
In the longer term, the pair lies in a bullish channel since a year. Strong resistance is given at 1.4690 (22/01/2016 high). Long-term support can be found at 1.2461 (16/03/2015 low).
AUD/USD Surging.
AUD/USD's technical structure is bullish since early May despite some consolidation move. The pair has broken strong resistance at 0.7835 (21/04/2016 high). Hourly support is given at 0.7786 (18/07/2017 low).
In the long-term, we are waiting for further signs that the current downtrend is ending. Key supports stand at 0.6009 (31/10/2008 low) . A break of the key resistance at 0.8295 (15/01/2015 high) is needed to invalidate our long-term bearish view.
EUR/USD Breaking 1.1500, GBP/USD Surging Again, USD/JPY Continued Weakness.
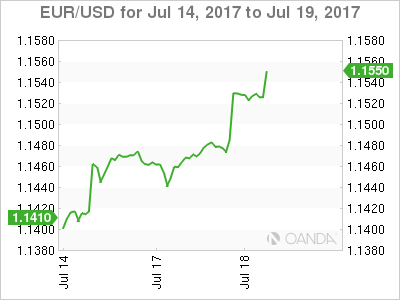
EUR/USD Breaking 1.1500.
EUR/USD bullish pressures continue. Hourly resistance given at 1.1489 (12/07/2017 high) has been broken. Hourly support can be found at 1.1313 (05/07/2017 high). Stronger support lies at 1.1076 (18/05/2017 low). Expected to show continued bullish pressures.
In the longer term, the momentum is clearly negative. We favour a continued bearish bias towards parity. Key resistance holds at 1.1714 (24/08/2015 high) while strong support lies at 1.0341 (03/01/2017 low).
GBP/USD Surging again.
GBP/USD has broken the 1.3000 mark. Hourly resistance is now given at 1.3117 (16/07/2017 high). Support lies at 1.3047 (17/07/2017 low). Expected to show continued bullish pressures.
The long-term technical pattern is even more negative since the Brexit vote has paved the way for further decline. Long-term support given at 1.0520 (01/03/85) represents a decent target. Long-term resistance is given at 1.5018 (24/06/2015) and would indicate a long-term reversal in the negative trend. Yet, it is very unlikely at the moment.
USD/JPY Continued weakness.
USD/JPY keeps on going lower. Hourly support is given at 111.99 (18/07/2017 low). Stronger support is located at a distance at 108.13 (17/04/2017 low). Expected to show continued bearish pressures.
We favor a long-term bearish bias. Support is now given at 96.57 (10/08/2013 low). A gradual rise towards the major resistance at 135.15 (01/02/2002 high) seems absolutely unlikely. Expected to decline further support at 93.79 (13/06/2013 low).
GBP Collapses On Weak CPI
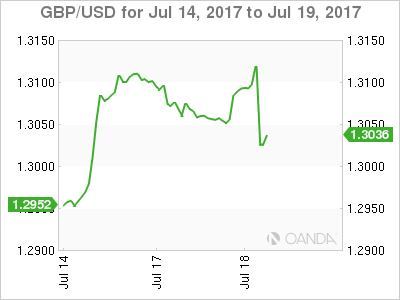
GBP falls 100 points as U.K. CPI data comes in lower at 2.60% YoY
Well the much-vaunted CPI data from the U.K is out, and there must be collective sighs of relief at the Bank of Englands Threadneedle Street headquarters. A 2.60 % YoY print is quite a bit lower than forecast and could take the wind out of sterlings sails for now.
The short term market, which was likely long into these numbers, certainly thinks so with GBP gapping 100 points lower from 1.3120 over the data to 1.3020. As I write this short note, GBP trades at 1.3027, a veritable dead cat bounce.
- (UK) JUN CPI M/M: 0.0% V 0.2%E; Y/Y: 2.6% V 2.9%E
- CPI CORE Y/Y: 2.4% V 2.6%E – CPIH Y/Y: 2.6% v 2.7%e
- RPI M/M: 0.2% v 0.4%e; Y/Y: 3.5% v 3.6%e – RPI Ex Mortgage Interest Payments (RPIX) Y/Y: 3.8% v 3.8%e prior
- Retail Price Index: 272.3 v 272.7e
Note: above the BOE inflation target for the 5th straight month but moved off the May reading of 2.9% which was the highest level since Jun 2013.
The data may override the U.S. Dollar negative sentiment in the short term at least.
GBP has support at 1.3020 with 1.3000 being a major psychological pivot point. Below this level, we see little until the 1.2935 regions.
GBP has resistance at 1.3125, the day’s highs, with talk of 1.3300 quashed for now.
The chart below says it all, whether the GBP market has severely whipsawed itself will become clearer int he next few hours as Her Majesty’s Pound is sent to the naughty corner and all take of rate hikes is cancelled.
APAC Summary: U.S. Healthcare Makes Dollar/Stocks Sick
More healthcare bill turmoil in the U.S. sees the dollar lower, dragging down stocks. Meanwhile, AUD and NZD diverge.
Today turned into a game of three halves in the Asia session. New Zeland got the show rolling by posting disappointing flat inflation for Q2 which saw the NZD come under early pressure as traders reassessed their RBNZ rate outlook. The Kiwi made a comeback later as the U.S. fell in general. The RBA meeting minutes caused some surprises with the central bank upbeat about global growth and suggesting that policy had been very accommodating in recent years. What got tongues wagging was a mention that the neutral policy rate for Australia was 3.50%. A long way above where we are today. The AUD flew higher by some 120 points to be the best performer in the G10 space today.
It was news from the U.S. that set the tone for Europe. Two Republican Senators announcing that they would vote no on the Obamacare repeal bill this week which effectively would torpedo its chances. The Senate leader moved to damage control by announcing there would be a two year transition period but the horse had bolted. With the U.S. Congress becoming a seemingly ungovernable Bermuda Triangle for any and of the President's legislative agenda (the U.S. Government needs the money saved from Obamacare to pay for tax cuts. Do the maths.) traders threw in the U.S. dollar towel and it traded lower across the board. The stock market didn't like it either, and the U.S. futures dragged Asian bourses down with it.
The highlight in Europe today will be the U.K. CPI due shortly with the street forecasting 2.90 unchanged. A miss either way should see GBP move strongly one way or another.
FX
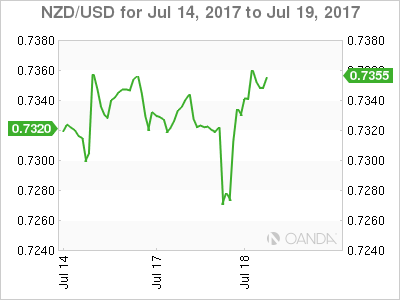
NZD
First of the taxi rank was the Kiwi, falling 70 points post a zero percent increase in CPI. The headline figure and the components were quite bearish implying an RBNZ on hold for most of 2018. NZD found support at 7260 and rallied all the way back to 7345 as the dollar collapsed.
NZD has resistance at 7370, multiple daily highs with a break implying a test of 7400 are on the cards. Support is found at 7260 and then 7200.
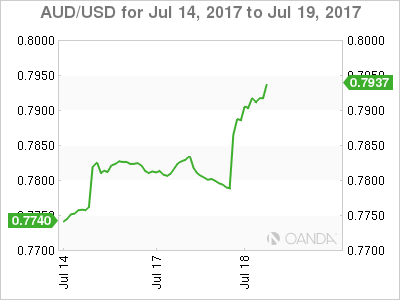
AUD
The RBA minutes were unexpectedly hawkish as mentioned above. AUD flew higher from 7785 to 7920 to be the best performing G10 currency of the day. Traders are rushing to reassess their rates outlook now on AUD which should stay stronger against the NZD and JPOY also.
AUD is now potentially poised for a move towards 8150 as it has made two-year highs today. Interim resistance is just above at 7925.
Support is at 7830, the previous high from May 2016 followed by the more important 7750 regions.
EUR
Rises 0.40% for the session, carving through 1.1500 in a bullish technical development and on high volume. 1.1500 will be an intra-day pivot point now followed by support at 1.1470. Resistance lies at 1.1540 and then 1.1620.
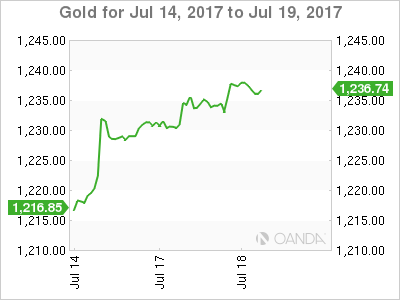
GOLD
Spiked to 1139.00 and supported by political turmoil in Washington and a weaker dollar and stocks. Profit taking late in the session sees it falling to 1135.00 into early Europe.
Support at 1130.00 should limit drops for now with the 100-day moving average lurking at 1147.50 the next major technical level.
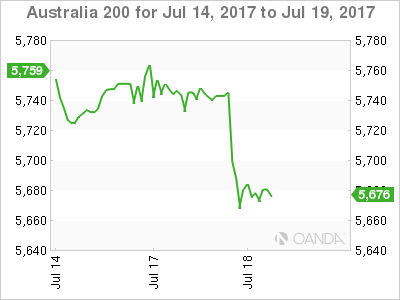
INDICES
ASX
Sydney decreased by 1.10% as the prospect of higher Australian rate weighed. The U.S stock sell-off gave it another shove lower as the index fell from 5755 to 5665 before finishing at 5680.
The ASX is just above critical long term support in the shape of the 200-day moving average at 5663 followed by 5648 and 5628.
Resistance is at 5775 and then 5787, the 100-day moving average.
Technical Outlook: AUDUSD – Fresh Bullish Extension Eyes Psychological 0.8000 Barrier
The Aussie benefited from weaker dollar and hawkish RBA minutes and rallied strongly on Tuesday, resuming strong rally of last week which took a breather on Monday.
Fresh bullish acceleration took out pivotal barrier at 0.7848 (Fibo 38.2% of 0.9503/0.6825 descend) and extended above round-figure barrier at 0.7900, riding on extended third wave of five-wave cycle from 0.7535 (23 June low).
The wave eyes its 200% Fibonacci expansion at 0.7933 and could extend to psychological 0.8000 barrier (also FE 238.2%).
However, corrective easing could be anticipated in the near-term as daily studies are overbought, but without firmer bearish signal so far.
Higher base at 0.7790 zone (Tue / Mon lows) offer solid support.
Res: 0.7933, 0.8000, 0.8044, 0.8114
Sup: 0.7848, 0.7790, 0.7749, 0.7712
Technical Outlook: USDJPY – Close Below 112.32 Pivot Needed To Signal Bearish Continuation
The pair hit fresh low of the month at 111.98 after dollar came under renewed pressure on Tuesday.
Strong supports at 111.95/111.80 zone (converged 55,30,200 and 100 SMA's) are pressured, but without break lower for now.
Bear may pause here as slow stochastic is oversold on daily, with narrow consolidation expected to precede fresh weakness.
Bearish signal on close below 112.32 (Fibo 38.2% of 108.80/114.49 upleg) is required to trigger further easing, as downside attempts on Fri/Mon failed to close below 112.32 pivot.
Thickening hourly cloud (spanned between 112.69/91) is weighing on near-term structure and should cap corrective upticks.
Res: 112.69, 112.91, 113.21, 113.57
Sup: 112.32, 111.95, 111.80, 111.64
Technical Outlook: GBPUSD Hits Fresh Highs Ahead Of UK Inflation Data
Cable has fully retraced Monday's pullback to 1.3046 on fresh rally that probes above Friday's high at 1.3113. The pair is back to strength after Monday's consolidation and looking for extension of last week's strong rally.
Sustained break above 1.3109 (Fibo 38.2% of 1.5016/1.1930 descend) is needed to confirm bullish continuation towards strong barriers at 1.3445 (06 Sep 2016 high) and 1.3473 (weekly cloud top / 50% retracement of 1.516/1.1930).
UK CPI data are in focus with release above 3% expected to give fresh boost to the pound.
Conversely, higher base at 1.3046 (Mon low / Tue Asian session low, also former high of 18 May) could come under increased pressure on CPI reading below forecasted 2.9%).
Res: 1.3149, 1.3200, 1.3253, 1.3300
Sup: 1.3046, 1.3030, 1.3000, 1.2968
Technical Outlook: EURUSD – Break Above 1.1500 Could Extend Towards 1.1716/35 Targets
The Euro resumed rally on Tuesday and eventually broke above near-term congestion just under 1.1500, inflated by fresh weakness on US dollar. Monday's trading that ended in long-tailed Doji was seen as brief consolidation ahead of fresh advance. Firmly bullish technicals continue to underpin, with close above 1.1500 handle to confirm bullish continuation. The pair eyes target at 1.1614 (03 May 2016 high) and could extend towards strong barriers at 1.1716/35 (Fibo 61.8% of 1.2567/1.0340 downleg/Fibo 38.2% of 1.3992/1.0340 descend), as those barriers also mark the top of longer term consolidation phase between 1.0340 and 1.1716. The pair is focusing on ECB's policy meeting on Thursday, with more hawkish tone from the central bank expected to further boost the single currency. Former congestion tops at 1.1490 zone now act as immediate supports, followed by rising Tenkan-sen/10 SMA at 1.1433 which should contain extended corrective dips and guard strong support at 1.1370 (13 July trough).
Res: 1.1565, 1.1614, 1.1643, 1.1716
Sup: 1.1490, 1.1433, 1.1400, 1.1370
USD Tumbles Again As The Republican Healthcare Bill Collapses
The greenback tumbled once again overnight, following news that the Republican healthcare bill – or Trumpcare 2.0 as it has been dubbed - is highly unlikely to pass the Senate and is most likely dead. The move came after two Republican Senators announced they are also against the legislation, leaving the bill without enough votes to pass. This implies that Trump's tax reform agenda may be now more difficult to implement and may take longer to arrive, as the cuts in healthcare were expected to finance some of the promised fiscal measures.
Moving forward, we think that the dollar could remain on the back foot over the next few days, at least until next week's FOMC decision. Combined with Friday's disappointing economic data, these downbeat political news as well as the absence of any Fed speakers or US indicators this week, suggest that neither politics nor economics are likely to support the greenback in the days to come.
EUR/USD traded north during the Asian morning Tuesday, breaking above the resistance (now turned into support) of 1.1485 (S1) to stop near the 1.1530 (R1) barrier. The price structure continues to suggest a positive medium-term outlook and as such, we would expect a clear break above 1.1530 (R1) to open the way for our next resistance level of 1.1615 (R1), defined by the peak of the 3rd of May 2016. Nevertheless, the weekly chart still points to a sideways range, with its upper bound near the 1.1710 (R3) territory. As such, as we get closer to that zone we would be careful that a retreat may come into play. We prefer to wait for a clear close above 1.1710 (R3) before we conclude that the medium-term uptrend has evolved into a long-term one.
Aussie dollar rallies after upbeat RBA minutes
AUD extended its recent gains overnight, following the release of the RBA's July meeting minutes. The tone of the minutes was quite upbeat, which probably came as a surprise considering that the statement of that meeting was neutral, disappointing market participants who expected an optimistic shift. In the minutes, the Bank indicated that the neutral nominal rate of interest in the Australian economy is around 3.5%. This suggests that a potential move back to neutrality could see the Bank's rate rising by as much as 200bps. Even though policymakers did not hint this is on the cards anytime soon, the fact that the discussion took place may have been interpreted as laying the foundations for a move earlier than previously anticipated.
AUD/USD surged overnight following the minutes. The pair emerged above the resistance (now turned into support) of 0.7840 (S1) and at the time of writing, it looks to be headed towards the 0.7935 (R1) zone. In our view, the clearing of the 0.7800 (S2) obstacle, which acted as the upper bound of the sideways range that had been containing the price action since the beginning of March 2016, opens the door for larger upside extensions. We expect a clear break above 0.7935 (R1) to pave the way towards the psychological zone of 0.8000 (R2).
New Zealand's CPI slows; NZD slips
The Kiwi slipped overnight, after data showed that New Zealand's CPI for Q2 slowed by more than anticipated. Importantly, the nation's CPI rate is now notably below the RBNZ's latest forecasts. Even though we don't expect the RBNZ to shift to dovish as a result of this, we think that these soft data will probably be enough to keep the Bank's tone neutral for a while.
Today's highlights:
During the European day, the UK CPI prints for June will be in focus. The forecast is for both the headline and the core rates to have held steady. Having said that, we view the risks surrounding these forecasts as skewed to the downside, considering that the nation's services PMI for June indicated that the rise in average prices was the slowest since July 2016. A potential pullback in these rates would probably ease some of the pressure on the BoE to raise rates in order to curb overshooting inflation. Something like that could hurt GBP.
From Sweden, we get the minutes from the Riksbank's July policy meeting, where the Bank remained on hold. Even though policymakers noted that the likelihood for any further rate cuts has declined, they maintained their easing bias, disappointing those who were expecting a removal. As such, we will go through the minutes to see whether the removal of the easing bias was indeed discussed, and if so, whether the decision to keep it in place was unanimous or a close call. If it was a close call, SEK could gain.
In Germany, the ZEW survey for July is due out, while from the US, we get the NAHB housing market index for July.
EUR/USD
Support: 1.1485 (S1), 1.1435 (S2), 1.1380 (S3)
Resistance: 1.1530 (R1), 1.1615 (R2), 1.1710 (R3)
AUD/USD
Support: 0.7840 (S1), 0.7800 (S2), 0.7740 (S3)
Resistance: 0.7935 (R1), 0.8000 (R2), 0.8070 (R3)