
Sample Category Title
EUR/USD Hit New Highs, GBP/USD Targeting New Highs, EUR/CHF Faces Tough Resistance
EUR/USD hit new highs
The currency pair edges higher on the Daily chart targeting new highs, the bulls are very strong as the USD was punished by another USDX’s drop. The dollar index dropped much below the 95.00 psychological level, has found temporary support at 94.71 level, but could drop much deeper in the upcoming hours.
USDX is pressuring a dynamic support and approaches another one, looks unstoppable on the short term.
The Euro-zone is to release the German ZEW Economic Sentiment, which will increase from 18.6 to 17.8 points, while the ZEW Economic Sentiment could drop from 37.7 to 37.2 points.
Price rallied and managed to jump above the 1.1466 major static resistance and above the median line (ml) of the ascending pitchfork, signalling that the bulls are in full control. The breakout invalidated the Rising Wedge pattern and a potential leg lower.
Is expected to increase further in the upcoming period, the next major upside target will be at the 1.1615 swig high and the next at 1.1712. Is trading inside of a long term resistance area right now, but maintains a bullish perspective as the USDX is demolished by the fundamental factors.
GBP/USD targeting new highs
GBP/USD is trading in the green on the short term and looks determined to reach new peaks in the upcoming period. Is trading within an ascending channel and should approach and reach the upside line of this pattern in the upcoming days.
Price jumped above the 150% Fibonacci line (ascending dotted line) and is expected to climb towards the upside line of the ascending channel. Technically should take out the minor resistance from 1.3112 previous high.
Could be attracted by the lower median line (lml) of the minor ascending pitchfork, the bullish movement was expected after the failure to reach and retest the warning line (wl1) and the 1.2798 static support.
We may have some volatility in the upcoming hours as the UK is to release high impact data, the CPI could increase by 2.9% in June, matching the 2.9% growth in May, the RPI may increase by 3.6%, while the PPI Input could drop by 0.8%. Moreover the Core CPI could increase by 2.6% in July, the HPI by 3.0% and the PPI Output by 0.1%.
The BOE Gov Carney will speak at the unveil of the new £10 note, in Hampshire, you should be careful because the fundamental factors will take the lead.
EUR/CHF faces tough resistance
Price continues to trade in the green and is challenging a strong resistance, is located above the 1.1050 psychological level and maintains a bullish perspective.
Is still trying to take out the major resistance from the upper median line (UML) of the ascending pitchfork and from the median line (ml) of the minor ascending pitchfork. The outlook is bullish as long as is trading within the ascending pitchfork’s body.
US Administration Agenda Falters
Fading support for President Trump is weighing on USD, as the US administration is finding it difficult to get enough backers in the Senate to pass the healthcare reform bill, raising questions about how the rest of its ambitious agenda would fare. USD was also weakened by the fading likelihood of US interest rates rising in the near term, the likelihood of a rate hike in December has fallen below 50%. The minutes from the July Reserve Bank of Australia meeting showed the RBA remains focused on keeping its monetary policy easy to suit domestic conditions and that data on labor and the housing market will continue to be closely watched. The RBA commented that strength in the jobs market removed some downside risks in wage forecasts, while signaling it isn't ready to join global Central Banks in reducing policy stimulus. Such comments suggest the likelihood of a hike in AUD interest rates is unlikely to happen anytime soon.
EURUSD bounced from a low of 1.14345 on Monday to reach a high of 1.14742 on the day, as data released showed Eurozone final CPI data for June was in-line with expectations. Overnight EURUSD has broken the 'psychological' 1.15 level to reach a high of 1.15375 – a level not seen since April 2016. Currently, EURUSD is trading around 1.1530.
With the Marine Day holiday in Japan on Monday, the market was relatively for USDJPY which traded in a tight range of 112.34 to 112.769. Overnight USD weakness has seen USDJPY trade as low as 111.983. Currently, USDJPY is trading around 112.10.
GBPUSD retraced slightly after hitting 10 months' highs last week. Much uncertainty remains as the UK began 'round 2' of Brexit discussions in Brussels on Monday. It is likely any information coming out of these discussions will impact GBP. Currently, GBPUSD is trading around 1.3105.
Following the release of the Reserve Bank of Australia minutes of its July 4th meeting, AUDUSD climbed to trade as high as 0.7908 in early trading. AUDUSD is currently trading near the day's highs.
Oil backed off from highs set in early Monday trading of $47.03pb to trade slightly lower to $46.45 on the day. Oil has stayed relatively strong of late, as the markets note that fewer drilling rigs were added in the US, which has helped ease concerns that rising US shale supplies will undermine OPEC production cuts. A further sign of strong demand came from data released on Monday showing refineries in China increased crude throughput in June to the 2nd highest on record. OPEC hopes higher demand in the 2nd half of 2017 will get rid of excess inventory. Currently, WTI is little changed trading around $46.25pb.
Gold continued its recent upward trend also benefitting from USD weakness. A rise of 0.4% on the day saw Gold reach a high of $1,235.27 on Monday and the trend has continued into Tuesday with Gold trading as high as $1,238.71. Currently, it is trading around $1,238.
At 09:30 BST, UK Consumer Price Index (YoY) (Jun) data will be released. The markets are expecting the rate to remain at 2.9%. A reading higher than 2.9% may result in the Bank of England accelerating the schedule for further rises in UK interest rates.
At 14:30 BST Bank of England Governor Mark Carney is scheduled to deliver a speech. The content of his speeches will give the markets an indication of the state of the UK economy and many will be looking at the tone to determine when further interest rate hikes are likely to happen.
Currencies: EUR/USD Jumps North Of 1.15 Resistance
Sunrise Market Commentary
- Rates: Some risk aversion after Obamacare fiasco
US Senate Republicans abandoned their effort to dismantle Obamacare because of a lack of support which hurts risk sentiment. Core bonds could trade with a small upward bias. Partly because of US political risk and partly because of Thursday's ECB meeting. - Currencies: EUR/USD jumps north of 1.15 resistance
Overnight, the dollar was hit across the board as the repeal of Obamacare has become highly unlikely in the near future. EUR/USD cleared the 1.15 barrier. USD/JPY dropped to the 112 area. Today's eco data will only be of second tier importance. The technical picture for the dollar is worsening further.
The Sunrise Headlines
- American trading was fairly uneventful and thus flat yesterday. On dollar weakness overnight, Asian stocks began declining, but later on recovered some of the losses.
- New Zealand's CPI fell to 1.7% Y/Y in Q2 from 2.2% in Q1. The RBNZ had projected inflation to be 2.1% (consensus 1.9%), and didn't expect a drop to 1.7% until Q4. The main reason for the undershooting is the oil price decline.
- The meeting minutes of the Australian central bank were positive on the economy overall and included a statement that the neutral interest rate has declined to around 3.5%, about 2 percentage points above the current level.
- Home prices surged in China's smaller cities while property values declined in Beijing and Shanghai in June. Restrictions in bigger cities are spurring buying in smaller ones, underscoring the challenge China faces to cool asset bubbles.
- Two more Republican senators have decided not to vote in favour of the new American health care plan, effectively killing the legislation in its current form.
- There is not a lot on the eco-calendar. UK CPI data will likely attract the most attention. On the other side of the channel, the German and EMU ZEW survey is on the agenda as is the ECB Bank Lending Survey.
Currencies: EUR/USD Jumps North Of 1.15 Resistance
EUR/USD clears 1.1489/1.15 resistance
On Monday, the dollar remained on the defensive after recent soft US price data, but the moves were modest as there was no high profile news. EUR/USD settled close to the recent top, but there was no trigger for a test. USD/JPY even tried a cautious intraday rebound but closed the session little changed at 112.63.
Overnight, the dollar came under broad pressure as divisions within the US Republicans make a repeal of Obamacare unlikely. This failure is reinforcing investor doubts on the ability of the Trump administration to execute profound reforms. EUR/USD jumped from 1.1480 to the 1.1538 area. USD/JPY dropped to the low 112 area. This uncertainty also weighs on Asian equities. The Aussie dollar outperforms on overall dollar weakness. In the minutes of the July meeting, the RBA didn't give concrete hints that it will raise rates soon. However, the bank is positive on the economy and the labour market and sees the neutral policy rate at 3.5%. AUD/USD jumped a full big figure and trades in the 0.79 area, the highest level in more than two years. The Kiwi dollar initially nosedived on lower than expected inflation, but rebounded on the overall USD-decline. NZD/USD trades around 0.7340.
Today, the eco calendar is modestly interesting. German ZEW investor confidence is expected little changed (88.0). In the US, import prices are expected to soften further. The NAHB housing index is expected unchanged at 67. Usually, these data are no markets movers. However, given the current negative USD momentum, a negative surprise might still cause some further repositioning away from the dollar.
The dollar remained in the defensive of late. Mediocre US wage growth, Yellen's focus on the recent setback in inflation and soft eco data made markets questioning the pace of future Fed normalisation and weighed on the USD. Initially, EUR/USD didn't retest the 1.1489/1.15 resistance, but this area was broken this morning. The move is clearly USD weakness rather than anything else. Thursday's ECB policy decision is an additional factor of uncertainty. We don't expect the ECB president to make a big announcement on policy normalisation. However, this is no guaranty for the EUR/USD rebound to halt. In a longer term perspective, the market discounts very little Fed policy normalisation. At some point this might lend the dollar support. However, in a day-to-day perspective, there is no reason to try to catch the falling USD.
USD: technical picture worsens further
End June, EUR/USD rebounded above the 1.1300/66 resistance. The payrolls and other recent data were not good enough to trigger a sustained USD rebound. Today, EUR/USD broke beyond the 1.1489/1.15 resistance. This break opens the door to the LT-correction tops at 1.1616/1.1714. A break would end the long consolidation that followed the sharp decline of EUR/USD in 2014/early 2015. Such a key area is not easy to break. We don't preposition for a break, but the pressure is mounting. Return action, below 1.13 would be a first indication of a loss in upside momentum. EUR/USD 1.1119/10 is the next important support.
The USD/JPY rally ran into resistance in early May and the pair returned lower in the 108.13/114.37 range. The post-Fed USD rebound pushed the pair above the 112.13 correction top, but follow-through gains remain modest. USD/JPY 114.37 resistance was tested, but for now the test is rejected. This at least suggests a pause in the recent USD/JPY uptrend. We stay cautious on USD/JPY long positions despite the recent decent performance.
EUR/USD clears 1.15 mark as dollar tumbles on expectations that repeal of Obamacare will fail
EUR/GBP
UK inflation key for sterling trading
Yesterday, last week's sterling rebound slowed and the UK currency even fell prey to a modest reversal. There was no high profile story. Many headlines about discord within the UK government going into the next round of Brexit negotiations might have caused some sterling caution. Cable dropped off the correction top north of 1.31 and closed the session at 1.3055. EUR/GBP profited from sterling softness and EUR/USD strength and closed the session at 0.8793.
Overnight, the USD decline also affects cable and EUR/USD. The latter rebounded north of 0.88. Cable returned to the 1.31 area. Later today, the focus for sterling trading will turn to the UK inflation. Headline and core CPI are both expected unchanged at respectively 2.9% Y/Y and 2.6% Y/Y. Of late, the BoE sent quite some conflicting signals whether a rate hike could be needed in the near future. Headline inflation rising to 3.0% or more will reactivate this debate. However, we expect any support for sterling to remain modest and temporary. The BOE isn't at the eve of a protracted rate hike cycle.
From a technical point of view, EUR/GBP recently set a minor top north of 0.8854/66 resistance (2017 top) and temporary broke above the 0.89 barrier but the move finally fell prey to profit taking (sterling short squeeze). A break below 0.8720 would suggest that upside momentum is easing. For now, we still see a sterling rebound as technical in nature and don't expect it to last very long. We still look to buy EUR/GBP on more pronounced dips.
EUR/GBP topside test rejected, for now
The Greenback Tumbles On U.S. Healthcare Bill Collapse, Eyes On U.K. Inflation
U.S. political turmoil took center stage once again on Tuesday after two Republican senators, Mike Lee and Jerry Morgan, announced their opposition to replacing Obamacare. This suggested that the Better Care Reconciliation Act is dead for now. The news sent the Euro above 1.15 and USDJPY below 112, while U.S. Treasury bonds and S&P 500 futures dipped lower.
It seems markets are losing confidence that President Trump will be able to deliver on his promised plans. Six months in office and with no major legislation signed into law, it seems that the “The Art of the Deal” hasn’t worked so far in U.S. politics. With tax reforms now likely to face huge uncertainties and economic data signaling slowing economy, it will only be a matter of time before U.S. corporate earnings take a U-turn, thus ending the equities rally.
The Aussie was the best performing currency early Tuesday, hitting a two-year high against the dollar after minutes from Australia’s central bank noted an improvement in the economic outlook. Although the minutes did not suggest an imminent rate hike, the positive assessment of the economy and the surge in iron ore and copper prices drove spreads between Australian and U.S. 10-year government bond rates to their highest levels since December 2016. The next major resistance is seen around 0.80, but this would require continued deterioration in the U.S. dollar and fresh positive economic releases to break above.
The pound is also benefiting from the weak dollar but whether we see new highs today depends on inflation data for June. The recent hawkish remarks from monetary policy makers and the shift in Mark Carney’s language will draw special attention to these figures. I think the magical number today is 3. If headline inflation hits 3% or above, this will indicate a high chance of hiking rates when the BoE meets in August. However, if the numbers pull back, this would ease pressure on the central bank and traders will turn their attention to the Brexit talks.
Market Update – Asian Session: RBA Minutes Spike The Aussie, While Dollar Weakens On Continued Healthcare Delays
Markets were broadly weaker today, US Republican Senators Moran and Lee say to vote NO on Senate Healthcare bill, this latest opposition to the measure signals that the Republicans might not be able to pass the revised healthcare bill. The White House called for Congress to continue to work on health bill, as inaction is not an option. EUR/USD rose to 1.1537, attributed to how lack of a health care deal could delay Congress’ next action on the debt ceiling.
RBA meeting minutes showed that the board spent some time discussion the neutral interest rate, noting that it equated to a neutral nominal cash rate of around 3.5%. It also argued that estimates of the neutral real rate suggested that monetary policy had been clearly expansionary for the preceding five years or so. Also noted that recent Govt budgets suggest fiscal policy will be more expansionary in 2017/18 than had previously been expected. Infrastructure investment was expected to have significant positive spillovers to other parts of the economy. Also see some probability of an increase in the cash rate by mid-2018. AUD/USD rose to 0.7887 on the more hawkish view.
Rio Tinto reported its Q2 production data, coming in slightly lower y/y and lower than expected, also cut FY17global iron ore shipments by ~20Mt to 330Mt. Coal guidance also was cut after Cyclone Debbie closed down production for many of the miners. In China property prices rose in June for all 70 cities y/y. New home prices fell in Beijing, Shanghai and Shenzhen m/m but all rose y/y.
Key economic data
(NZ) NEW ZEALAND Q2 CPI Q/Q: 0.0% V 0.2%E; Y/Y: 1.7% V 1.9%E
(CN) CHINA JUN PROPERTY PRICES M/M: RISE IN 60 OUT OF 70 CITIES VS 56 PRIOR; Y/Y: RISE IN 70 OUT OF 70 CITIES V 69 PRIOR
(AU) Australia ANZ Roy Morgan Weekly Consumer Confidence Index: 112.5 v 113.0 prior
(AU) AUSTRALIA JUN NEW MOTOR VEHICLE SALES M/M: 1.2% V 2.9% PRIOR; Y/Y: 3.6% V 4.9% PRIOR
(NZ) New Zealand RBNZ Q2 Sectoral Factor Model Inflation Index y/y: 1.4% v 1.5% prior (1st slowdown since Q3 2015)
(NZ) New Zealand Q1 CoreLogic House Price Index y/y: 10.2% v 13.9% prior
Speakers and Press
China
(CN) China's State Planner (NDRC) to allow 200M tons of new coal capacity to be launched in 2017, to keep coal prices in a reasonable range
(CN) China’s National Development and Reform Commission (NDRC) Yan: Companies should be prudent in their outbound investment decisions
(CN) China PBOC affirms monetary policy to be prudent and neutral; to strengthen macro-prudential management and counter cycle adjustments
Australia/New Zealand
(AU) Australia ACCC releases report on private health insurer; Continues to focus on consumer issues in private health insurance as one of its priority areas in the 2017 Compliance and Enforcement policy
Korea
(KR) According to Barclay's South Korea's hourly minimum wage hike may push up inflation expectations, which could potentially bring forward any decision by the Bank of Korea to raise the policy interest rate
Japan
(JP) Bank of Japan (BOJ) bond buying said to raise concerns among some officials
(JP) Japan Fin Min Aso: No change to FY20 primary balance surplus goal
Asian Equity Indices/Futures (00:30ET)
Nikkei -0.5%, Hang Seng -0.1%, Shanghai Composite -0.6%, ASX200 -1.2%, Kospi -0.1%
Equity Futures: S&P500 -0.1%; Nasdaq -0.1%, Dax -0.2%, FTSE100 -0.3%
FX ranges/Commodities/Fixed Income (00:30ET)
EUR 1.1538-1.1472; JPY 112.66-111.99; AUD 0.7904-0.7787; NZD 0.7347-0.7263
Aug Gold +0.3% at 1,236/oz; Aug Crude Oil +0.2% at $46.09/brl; Sept Copper +0.04% at $2.73/lb
(AU) Australia sells A$150M in indexed bonds, avg yield 1.1158%, bid to cover 3.57x
(CN) China PBoC OMO: injects CNY200B in 7 and 14 day reverse repos v CNY170B prior
USD/CNY (CN) PBOC SETS YUAN REFERENCE RATE AT 6.7611 V 6.7562 PRIOR
(NZ) New Zealand sells NZ$100M in 3-month bills; avg yield 1.785%
Equities notable movers
Australia
Village Roadshow, VRL.AU Guides FY17 Adj Net profit A$20-23M v A$24Me; Expects to record Wet'n'Wild impairment A$65M pre-tax; Narrows lower FY17 theme park adj EBITDA A$55M (prior A$55-65M); -0.5%
Rio Tinto, RIO.AU Reports Q2 global iron ore production 79.8Mt v 85.30Mt y/y; Shipments 77.7Mt v 81.8Mte; -1.5%
Hong Kong/China
Sunac China Holdings, 1918.HK Domestic banks are said to be reviewing its credit risk following a deal to buy assets from Dalian Wanda Group; -10.4%
South Korea
Hanssem, 009240.KR Reports Q2 (KRW) Op 33.7B v 30.6B y/y; Rev 481.8B v 434.9B y/y; -7.1%
Japan
Toshiba Corp, 6502.JPJudge delays ruling on Western Digital’s attempt to block chip unit sale, new target of closing sale of chip unit by end of March; +8.3%
US markets on close: Dow -0.04%, S&P500 0.0%, Nasdaq +0.03%, Russell +0.2%
Best Sector in S&P500: Utilities
Worst Sector in S&P500: Healthcare
Biggest gainers: FCX +3.2%; M 3.1%; KSS +2.7%
Biggest losers: CCI -4.2%; BLK -3.1%; SIG -2.2%
At the close: VIX 9.82 (+0.31pts); Treasuries: 2-yr 1.36% (+0.3%), 10-yr 2.31% (-0.2%), 30-yr 2.90% (-0.3%)
US Market Summary
Stocks closed mostly flat on the day while investors appeared to be on the sidelines as the market awaits the starting pistol of earnings season. Volume was on the low side, 23% and 19% below the 3-month average for the NYSE and Nasdaq respectively. Best performing sectors in the S&P were utilities, gaining 0.4%, with Real Estate and Consumer Discretionary both rising 0.2%.
(US) Treasury markets were choppy today, finally giving way to a rally in prices as yields fell. 10-year yield dropped 2 bps on the day to 2.31%, and 30-year yield lost as much as 4 bps at one point before closing higher at 2.90%. 10s30s spread widens to 59 bps.
US Afterhours Movers
NFLX Reports Q2 $0.15 v $0.16e, Rev $2.78B v $2.76Be; Guides Q3 $0.32 v $0.22e, total Rev $3.0B v $2.88B, total streaming Rev $2.9B, domestic streaming Rev $1.6B, international streaming Rev $1.3B; net operating margin 6.9%; Guides Q3 total streaming net adds 4.4M, domestic streaming net adds 0.8M, international streaming net adds 3.7M; +10.7% afterhours
PBYI FDA grants approval for Nerlynx for the extended adjuvant treatment of early-stage, HER2-positive breast cancer; +7.4%
The ECB’s Bank Lending Survey Is Due For Release
Market Movers Today
The minutes from the Riksbank meeting in July are due for release and could attract additional attention as the Riksbank's statement made it clear it remains ready to act again if needed and did not contain any signs of hawkishness – thereby deviating from the latest communication among global central banks. Notably, Governor Stefan Ingves said during the press conference that he cannot see Riksbank hiking rates before the ECB.
The ECB's Bank Lending Survey is due for release. The latest report from April showed loan growth continued to be supported by increasing demand across all loan categories supported by the general level of interest rates. Added to this, credit standards (i.e. banks' internal guidelines or loan approval criteria) for loans to enterprises eased slightly due to competitive pressure whereas banks' risk tolerance had a tightening impact.
The German ZEW expectations are also due for release today and we estimate another modest decline in July. The lack of continued progress in the expectations component is, however, likely to reflect a very strong existing situation as reflected in the current assessment indicator, which points to staying at levels seen only in 2007 and 2011.
In the UK, the CPI inflation figures are set to be published and we estimate a small decline in both headline and CPI core inflation. However, the risk is that if the figures surprise on the upside, it could fuel speculations about the Bank of England (BoE) tightening its monetary policy. The market is currently pricing in a 50% probability of a 25bp hike from the BoE at the meeting in November, which is one of the ‘big' meetings.
Note that we published a Bank of Japan preview, 17 July, ahead of the meeting ending 20 July.
Selected Market News
EUR/USD is trading above 1.15 on USD weakness, which is also reflected in lower US stocks given the US healthcare reform is effectively dead in its current form. Two more Republican senators announced their opposition to the Republican healthcare reform, arguing it does not go far enough to address the rising cost of healthcare. Senate majority leader Mitch McConnell said yesterday evening he will now seek for a vote on a simple repeal to be delayed by two years in order to give lawmakers time to seek a replacement, but such a vote is also very likely to fail.
Yesterday, the Trump administration declared reducing US trade deficits with Canada and Mexico a top priority for its renegotiation of the North American Free Trade Agreement (NAFTA). The administration also said it wants an ‘appropriate' provision to deter currency manipulation by trading partners. This mention is the first in a US trade deal and appears to be aimed at future trade deals rather than at Canada and Mexico specifically, who are not considered currency manipulators.
Daily Technical Analysis: EUR/USD Continues Uptrend After Major Break Above 1.15 Resistance
Currency pair EUR/USD
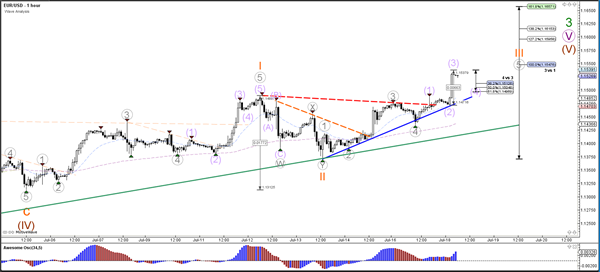
The EUR/USD uptrend is ready to continue higher now that price has broken above the resistance trend line (dotted red) and 1.15 round level. The bullish breakout confirms the continuation of the wave 3 (green).
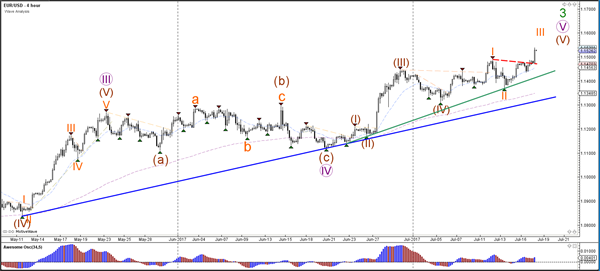
The EUR/USD is most likely building a wave 3 (orange) momentum. Within the 3rd wave price seems to be extending the bullish impulse via 5 waves (purple) within the 5th wave (grey). A small retracement could occur now or later as part of the wave 4 (purple) and the Fibonacci levels of wave 4 vs 3 could act as potential support for a new bounce towards the Fibonacci targets of wave 3 vs 1.
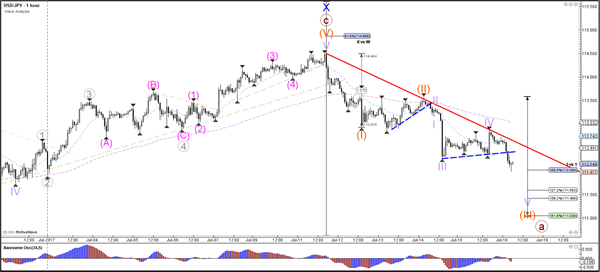
Currency pair USD/JPY
The USD/JPY continuation of the bearish momentum is increasing the chance of a bearish reversal and the completion of a wave X (blue) at the top.
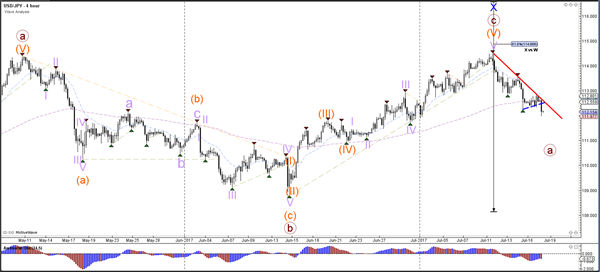
The USD/JPY indeed turned at the resistance trend line (red) which confirmed the wave 4 (purple). The break below the support trend line (dotted blue) could indicate the potential for USD/JPY to move lower towards the Fibonacci targets.
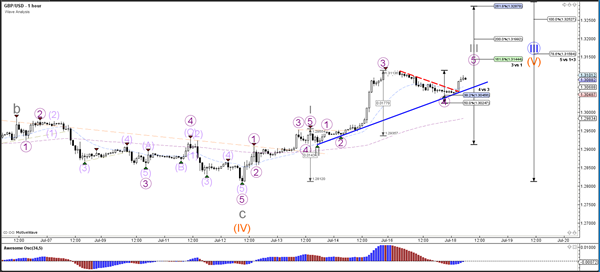
Currency pair GBP/USD
The GBP/USD is continuing with the uptrend after the break above the 1.30 resistance level (dotted red). The Fibonacci levels of wave 5 (orange) are the next targets.
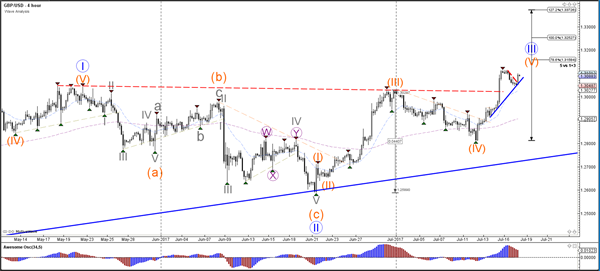
The GBP/USD completed a retracement to the 338.2% Fibonacci support level of wave 4 vs 3 (purple) and used the support for a bullish bounce. The bullish breakout above resistance (dotted red) will probably start the wave 5 (purple) of wave 3 (grey).
Daily Technical Analysis: EURUSD, GBPUSD, USDJPY, USDCHF
EURUSD
The EURUSD attempted to push lower yesterday bottomed at 1.1434 but closed higher at 1.1477 and breaks above 1.1500, hit 1.1532 earlier today in Asian session. The bias remains bullish in nearest term testing 1.1615 region (weekly EMA 200 and 2016 high). Immediate support is seen around 1.1485/65 area. A clear break below that area could lead price to neutral zone in nearest term testing 1.1400 support area but as long as stay above 1.1285 key support I remain bullish and any downside pullback should be seen as a good opportunity to buy. On the upside, a clear break above 1.1615 would expose 1.1712 region (2015 high).
GBPUSD
The GBPUSD was corrected lower yesterday but overall still maintain its bullish bias and able to stay above 1.3050 key support so far. The bias remains bullish in nearest term testing 1.3200 area. Immediate support is seen around 1.3050 region. A clear break back below that area could lead price to neutral zone in nearest term testing 1.3000 region. On the upside, a clear break and daily close above 1.3200 would expose 1.3350 area.
USDJPY
The USDJPY was indecisive yesterday but overall still able to maintain its bearish short-term bias and hit 112.15 earlier today in Asian session. The bias remains bearish in nearest term as a part of the bearish scenario after the appearance of the bearish pin bar last week, testing 111.45 region (daily EMA 200). Immediate resistance is seen around 112.75. A clear break above that area could lead price to neutral zone in nearest term testing 113.50 region. On the downside, a clear break and daily close below 111.45 would expose 111.30/00 area. Overall I am neutral on this pair.
USDCHF
The USDCHF was indecisive yesterday but traded lower earlier today in Asian session hit 0.9589. The bias remains bearish in nearest term testing 0.9550 – 0.9450 area which remains a key support and good place to buy with a tight stop loss below 0.9450. Immediate resistance is seen around 0.9635. A clear break above that area could lead price to neutral zone in nearest term retesting 0.9700 region. As you can see on my daily chart below, price is still moving below the daily EMA 200 suggests a bearish view with key resistance seen at 0.9700 – 0.9765 region. On the downside, a clear break below 0.9450 would expose 0.9250 area.
USDJPY Bearishness Set To Extend
Key Points:
- The Dollar-Yen should sink below the 100 day EMA this week.
- Numerous technical readings support further losses.
- Downsides should be limited to the 110.00 handle.
Further losses are looking more and more likely for the Dollar-Yen this week as its technical outlook remains stubbornly bearish. Indeed, we expect the pair to sink through the 100 day moving average to test support around the 110.00 handle within the next week or so. This being said, the greenback has been anything but predictable recently which could mean a reversal is not altogether improbable.
Nevertheless, on the balance of things, the argument for such a reversal is fairly flimsy. The main thing one might point out is the fact that the EMA bias is highly bullish and that the 100 day moving average can often prove to be a source of dynamic support. Unfortunately for the bulls out there, the USDJPY has been oscillating around the 100 day EMA rather comfortably and ignoring any potential support or resistance that it could be generating. Moreover, the pair has yet to move into oversold territory and the next potential zone of support is the 50.0% Fibonacci level – often one of the softer retracements.
Conversely, the evidence for ongoing losses is actually fairly compelling and suggests that the pair could depreciate by as much as 1.50% in the near term. Specifically, the parabolic SAR is notably bearish and in little danger of inverting in the absence of a major fundamental upset. Meanwhile, the recent crossover of the MACD and the signal line tends to indicate that momentum has shifted which could put heightened pressure on the pair.
Nevertheless, whilst losses are expected moving forward, they are likely to be somewhat limited. More precisely, we can't ignore the presence of the broader pennant structure which should prevent the pair from pushing below the 110.00 handle. This view is only reinforced by the fact that the 78.6% Fibonacci level exists just above this handle at the 110.28 mark which severely limits the chances of us seeing a downside breakout from the USDJPY.
Overall, keep an eye on this pair as even though it remains within a consolidation phase, it has plenty of movement left. For now, the movement looks predisposed to the downside for the reasons discussed above. However, don't forget to keep half an eye on the fundamental side of things as this still has the ability to disrupt the so far orderly decline of the Dollar-Yen.
Is A Higher Aussie Dollar Complicating Rebalancing?
Key Points:
- AUDUSD continues to appreciate thereby complicating economic rebalancing.
- Nominal real interest rates have continued to decline towards 1.00%.
- RBA unlikely to undertake monetary policy action in the near term.
The Australian Dollar has seen a stunning run over the past few weeks as the currency pair has been buoyed by a range of increasingly negative U.S. economic data. In particular, a softening in the Fed’s position regarding rate hikes has seen capital flowing into the AUD and, subsequently, price action has risen to presently trade around the 0.7843 mark. However, this could be complicating the path of rebalancing for the economy and might trouble the Reserve Bank in the coming months.
The fact is that the Australian economy is still somewhat reeling from the impact of the end of the commodity super cycle. In fact, the rebalancing process from mining to service based industries is still ongoing and reduced trade competition, based on an appreciating currency, is likely the last thing that the reserve bank needs to deal with right now.
However, it isn’t all bad news for the central bank with the latest round of minutes suggesting that the recent rises in employment are likely to support an improvement in the household income and spending. This is most certainly n economic silver lining, despite the appreciating Australian Dollar, especially given that the RBA is estimating that the neutral real interest rate has fallen to 1.00%. Additionally, Unemployment continued to trend lower and the latest projections seem to suggest that the rate will move towards 5.0% over the next 18 months.
However, despite ongoing tightening within the labour markets, along with increasing inflationary pressures, the RBA is unlikely to take anything in the way of monetary policy action in the coming months. Although there is a broad trend of various central banks moving towards a tightening phase, Australia is unlikely to be one of them in the remainder of 2017. In fact, the coming year is likely to bring with it renewed expansionary fiscal policy which would likely cancel out any tightening. Subsequently, the RBA is likely to sit on the side lines in the coming month especially if they believe that the government will undertake a fiscal expansion in the near future.
However, the Australian economy is continuing to do relatively well considering the sharp domestic shock the end of the mining boom posed. Regardless, the RBA is unable to retain rates at the presently low level for too long lest they worsen much of the capital and lending issues within the banking sector whilst also encouraging further risky leveraging. Ultimately, the time will come for the central bank to take action and this can only occur after a significant rebalancing within the economy.