

Sample Category Title
USD/CHF Weekly Outlook
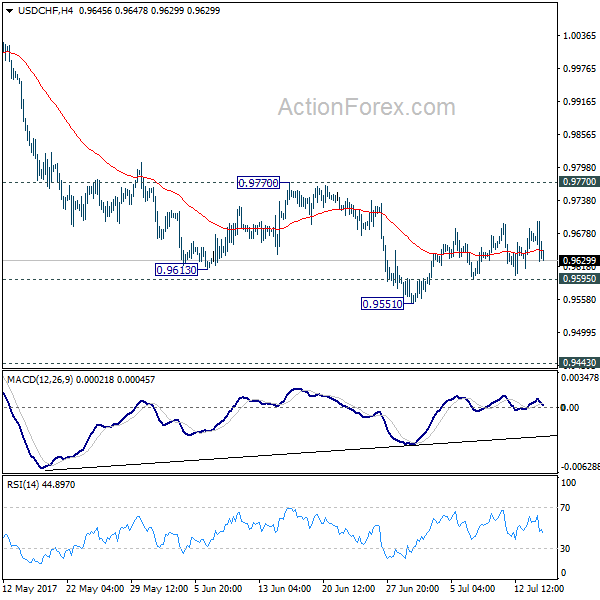
USD/CHF stayed in the consolidation pattern from 0.9551 last week and outlook is unchanged. Initial bias remains neutral this week first. IN case of another rise, upside should be limited by 0.9770 resistance and bring fall resumption. Below 0.9595 minor support will turn bias to the downside. Break of 0.9551 will extend the whole fall from 1.0342 and target 0.9443 key support level next. At this point, we'd expect strong support from there to bring rebound. Meanwhile, firm break of 0.9770 will indicate near term reversal, on bullish convergence condition in 4 hour MACD.
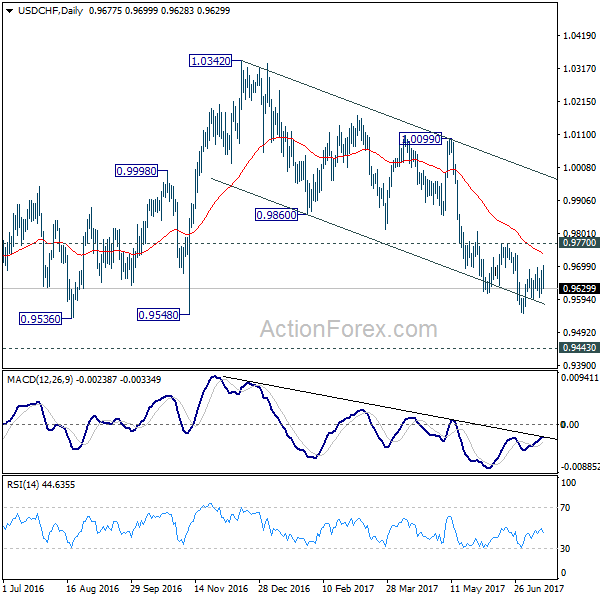
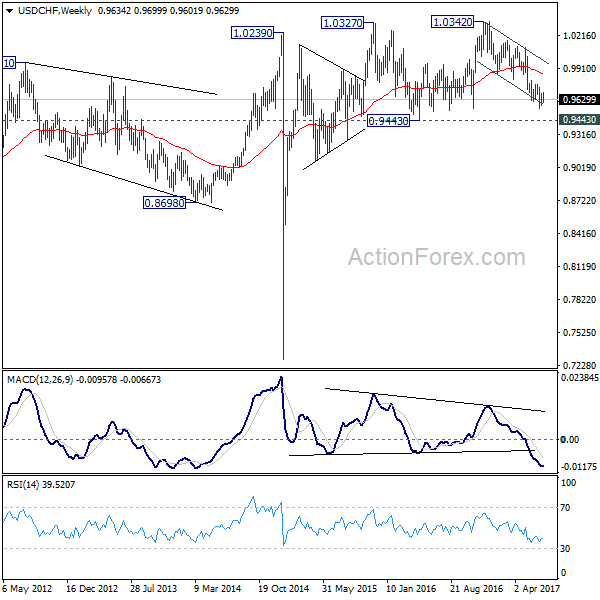
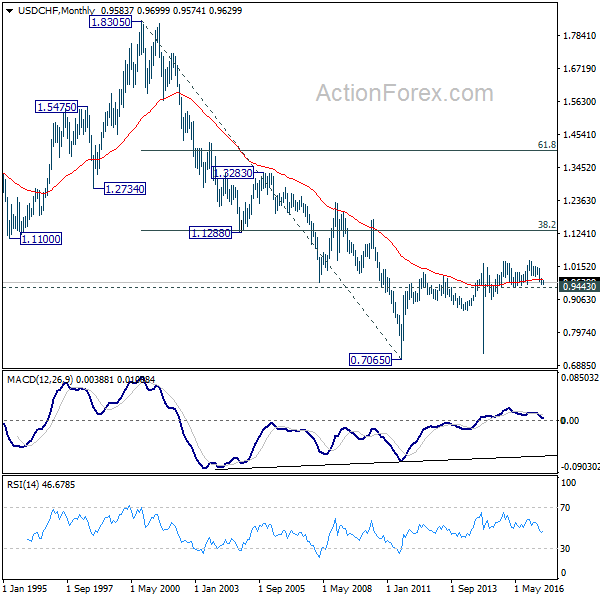
In the bigger picture, USD/CHF is still bounded in medium term range of 0.9443/1.0342 for the moment. Consolidative trading would likely continue and medium term outlook remains neutral. Break of 1.0342 key resistance is needed to confirm underlying bullish momentum in the pair. Meanwhile, downside attempts should be contained by 0.9443 key support level. However, sustained break of 0.9443 will carry larger bearish implication and target 0.9 handle.
AUD/USD Weekly Outlook
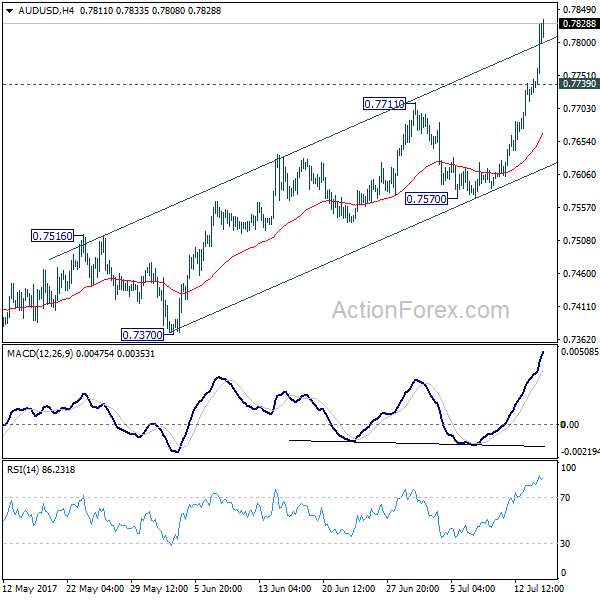
AUD/USD surged to as high as 0.7833 last week as rise from 0.7328 extended. The upside acceleration argues that it's resuming larger rebound from 0.6826 bottom. Initial bias remains on the upside this week. Firm break of 0.7833 resistance will confirm this bullish case and target 61.8% projection of 0.6826 to 0.7833 from 0.7328 at 0.7950 next. On the downside, below 0.7739 minor support will turn intraday bias neutral first. But near term outlook will stay cautiously bullish as long as 0.7570 support holds.
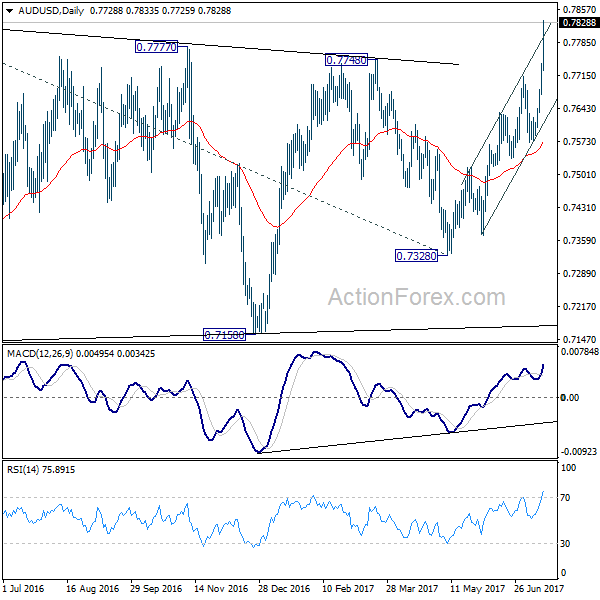
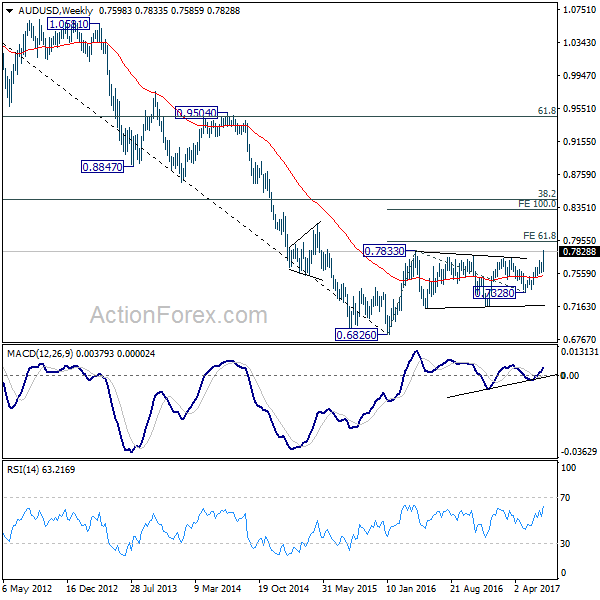
In the bigger picture, current development suggests that rebound from 0.6826 is developing into a medium term rise. There is no confirmation of trend reversal yet and we'll continue to treat such rebound as a corrective pattern. But in any case, further rise is now expected to 55 month EMA (now at 0.8100) or even further to 38.2% retracement of 1.1079 to 0.6826 at 0.8451. Break of 0.7328 support is needed to confirm completion of the rebound. Otherwise, further rise is now in favor.
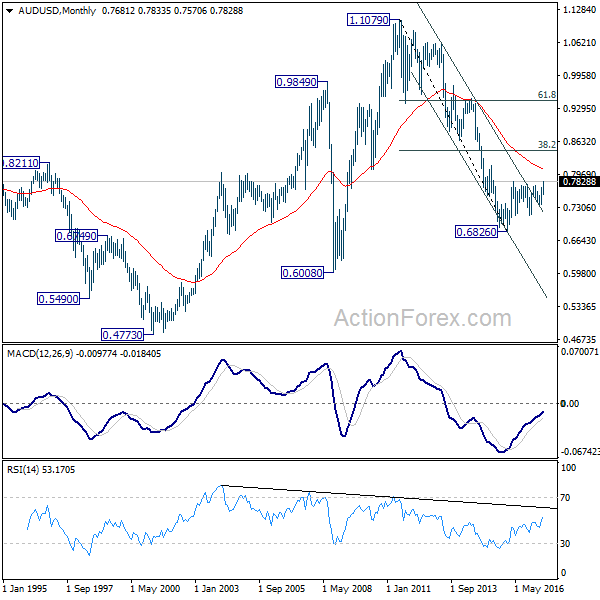
In the longer term picture, 0.6826 is seen as a long term bottom. Rise from there could either reverse the down trend from 1.1079, or just develop into a corrective pattern. At this point, we're favoring the latter. And, as long as 38.2% retracement of 1.1079 to 0.6826 at 0.8451 holds, we'd anticipate another decline through 0.6826 at a later stage.
USD/CAD Weekly Outlook
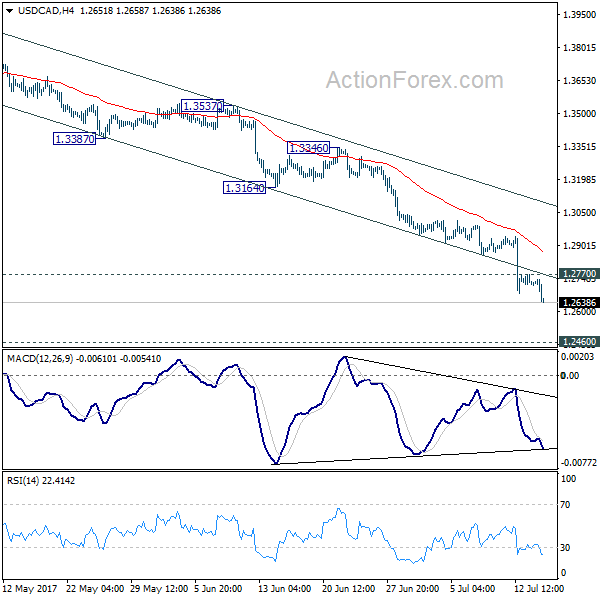
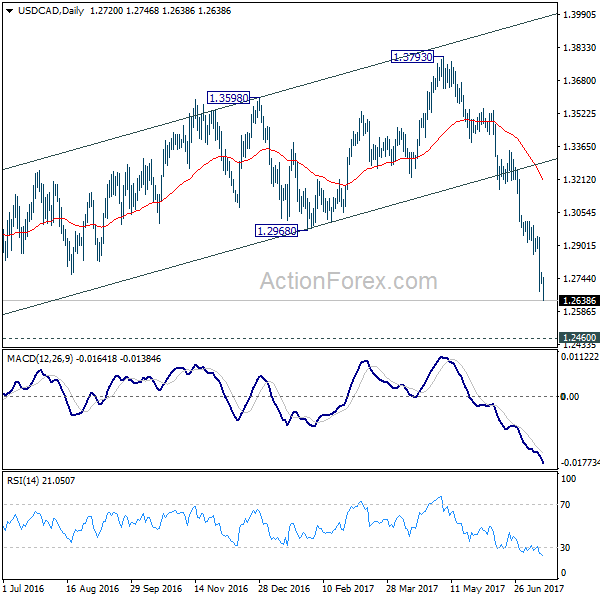
USD/CAD's fall from 1.3793 extended last week to as low as 1.2638. Break of near term falling channel showed further downside acceleration. Initial bias remains on the downside this week for 1.2460 low next. On the upside, above 1.2770 minor resistance will turn bias neutral and bring consolidation before staging another decline.
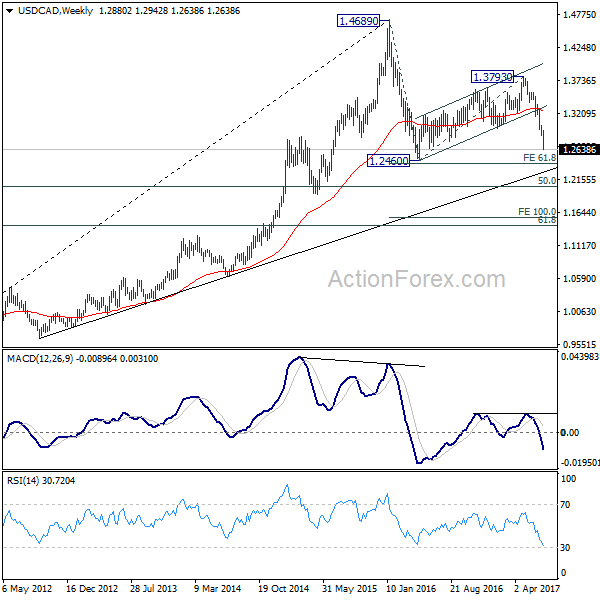
In the bigger picture, price actions from 1.4689 medium term top are seen as a correction pattern. Fall from 1.3793 is seen as the third leg and should target 50% retracement of 0.9406 to 1.4869 at 1.2048. At this point, we'd look for strong support from there to contain downside and bring rebound. However, firm break there will target 100% projection of 1.4689 to 1.2460 from 1.3793 at 1.1564.
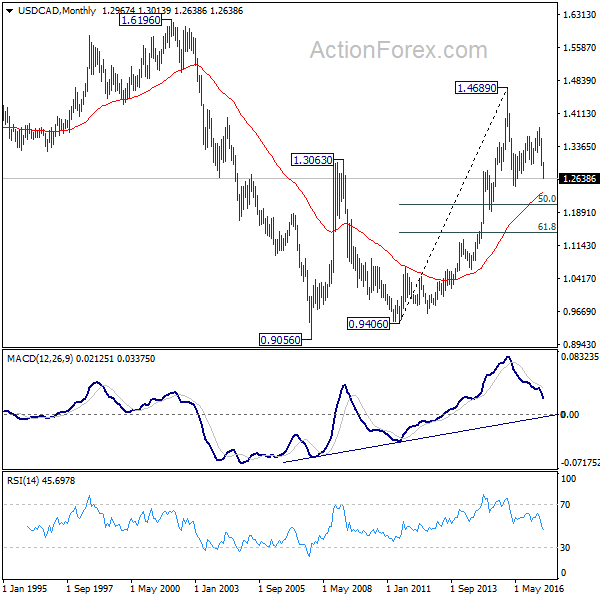
In the longer term picture, rise from 0.9056 (2007 low) is viewed as a long term up trend. It's taking a breath after hitting 1.4689. But such rise expected to resume later to test 1.6196 down the road. But firm break of 50% retracement of 0.9406 to 1.4869 at 1.2048 will raise doubt over this view.
GBP/JPY Weekly Outlook
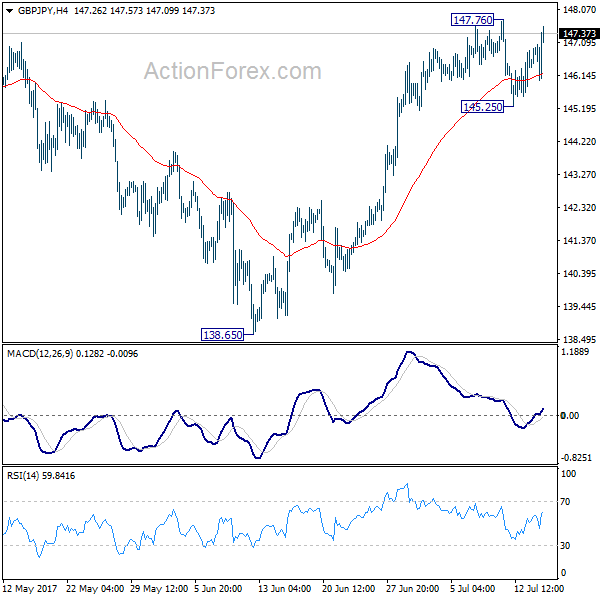
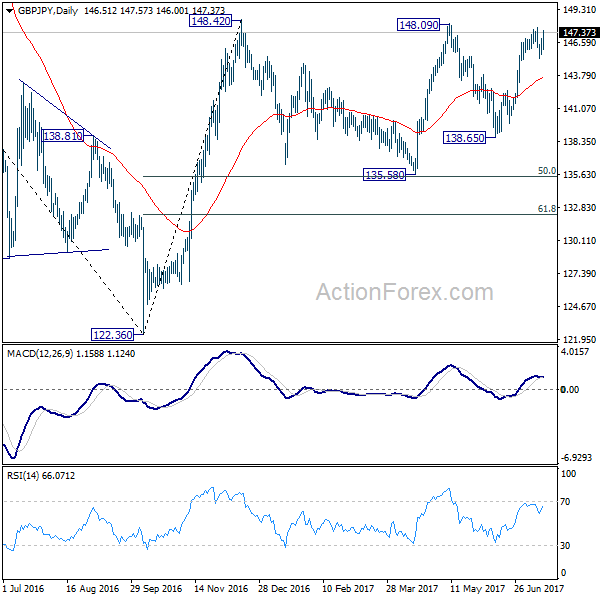
GBP/JPY dropped quite sharply to 145.25 last week but quickly recovered. Outlook is a bit mixed and initial bias is neutral this week first. On the upside break of 147.76 will resume rise from 138.65. And firm break of 148.42 key resistance will also resume the whole rally from 122.36 to long term fibonacci level at 150.43 and above. Meanwhile, on the downside, break of 145.25 will revive the case of rejection from 148.09/42 resistance zone. Intraday bias would then be turned back to the downside for 55 day EMA (now at 143.72) and below.
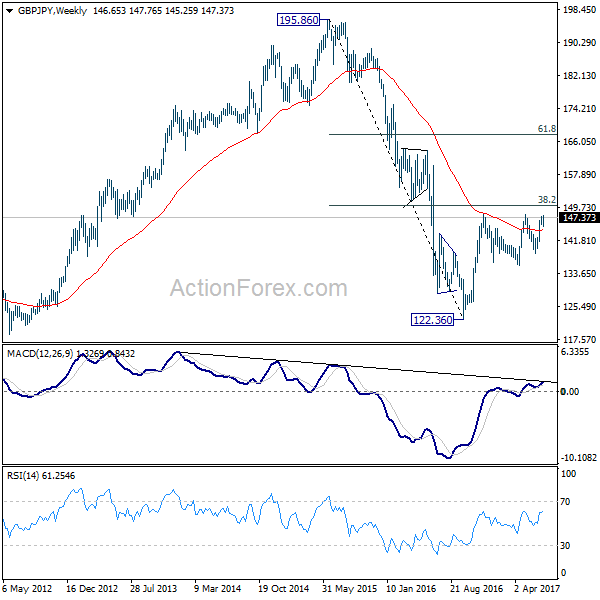
In the bigger picture, rise from medium term bottom at 122.36 is expected to continue to 38.2% retracement of 196.85 to 122.36 at 150.43. Decisive break there will carry long term bullish implications and pave the way to 61.8% retracement at 167.78. In case the sideway pattern from 148.42 extends, we'd be looking for strong support from 135.58 and 50% retracement of 122.36 to 148.42 at 135.39 to contain downside.
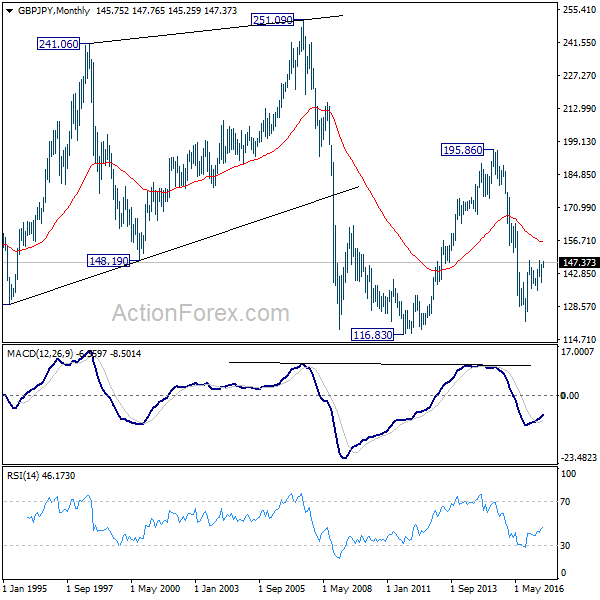
In the longer term picture, it remains to be confirmed is whole down trend from 195.86 has completed at 122.36 already and there is no confirmation yet. But in any case, firm break of 38.2% retracement of 195.86 to 122.36 at 150.43 would pave the way to 61.8% retracement at 167.78. And with that, the 55 month EMA will be firmly taken out which suggests that price actions from 116.83 is indeed a sideway pattern that could last more than a decade.
EUR/JPY Weekly Outlook
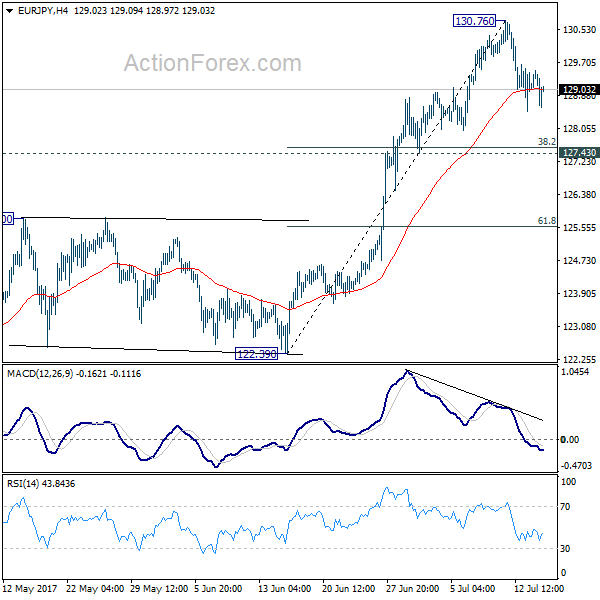
EUR/JPY edged higher to 130.76 last week but formed a short term top there, on bearish divergence condition in 4 hour MACD, and retreated. Initial bias stays neutral this week for more consolidative trading. In case of deeper fall, downside should be contained by 127.43 cluster support (38.2% retracement of 122.39 to 130.76 at 127.56) and bring rebound. Above 130.76 will extend the larger rally to next key fibonacci level at 134.20.
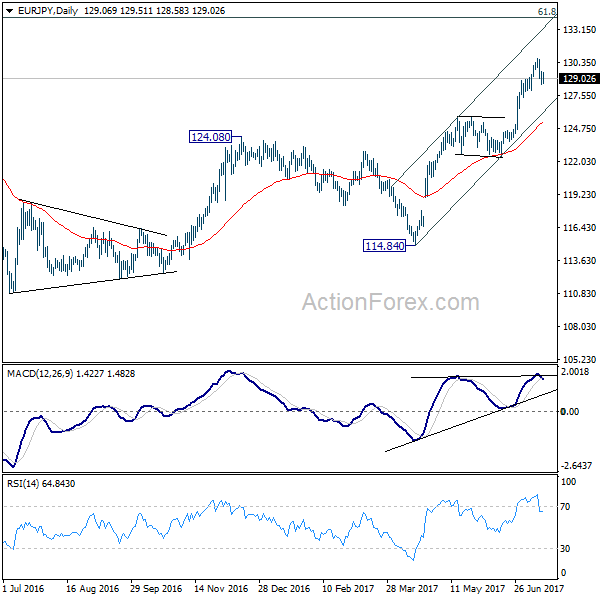
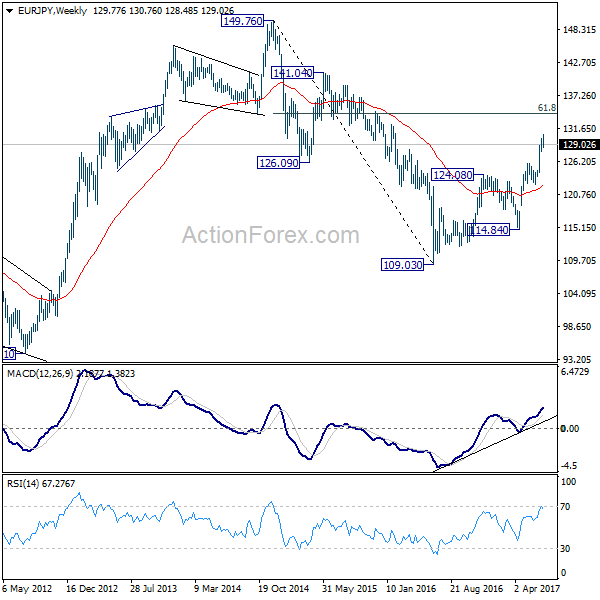
In the bigger picture, the down trend from 149.76 (2014 high) is completed at 109.03 (2016 low). Current rally from 109.03 should be at the same degree as the fall from 149.76 to 109.03. Further rise is expected to 61.8% retracement of 149.76 to 109.03 at 134.20. Sustained break there will pave the way to key long term resistance zone at 141.04/149.76. Medium term outlook will remain bullish as long as 124.08 resistance turned support holds.
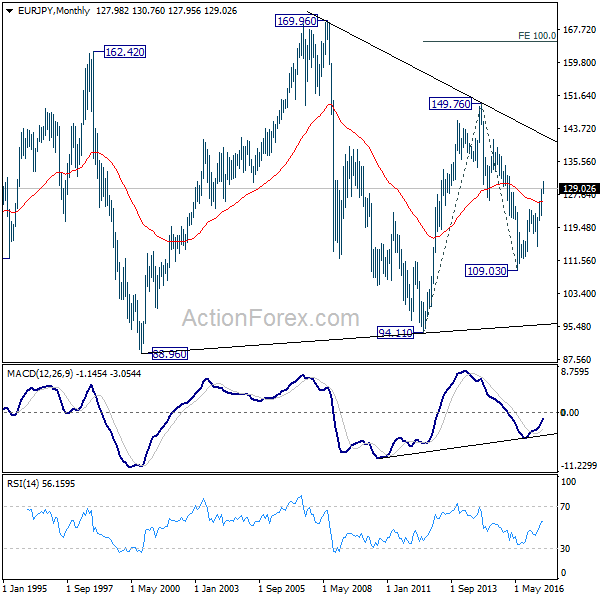
In the long term picture, at this point, there is no clear indication that rise from 109.03 is resuming that from 94.11. Hence, we'd be cautious on topping below 149.76 to extend range trading. Nonetheless, firm break of 149.76 will indicates strong underlying buying. In such case, EUR/JPY will target 100% projection of 94.11 to 149.76 from 109.03 at 164.68.
EUR/GBP Weekly Outlook
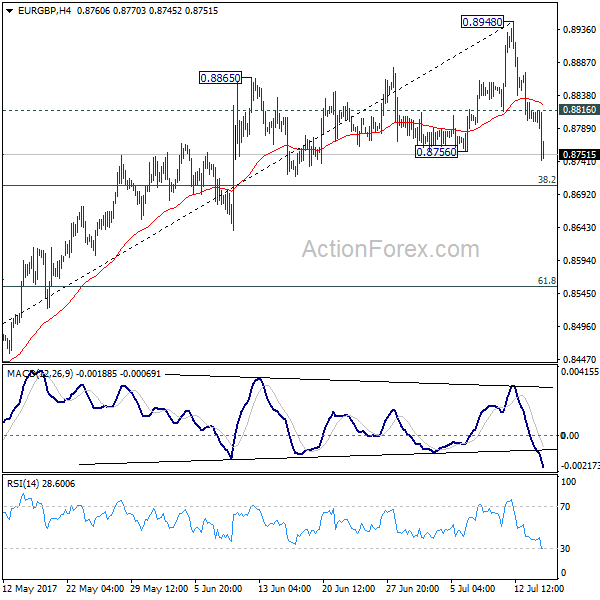
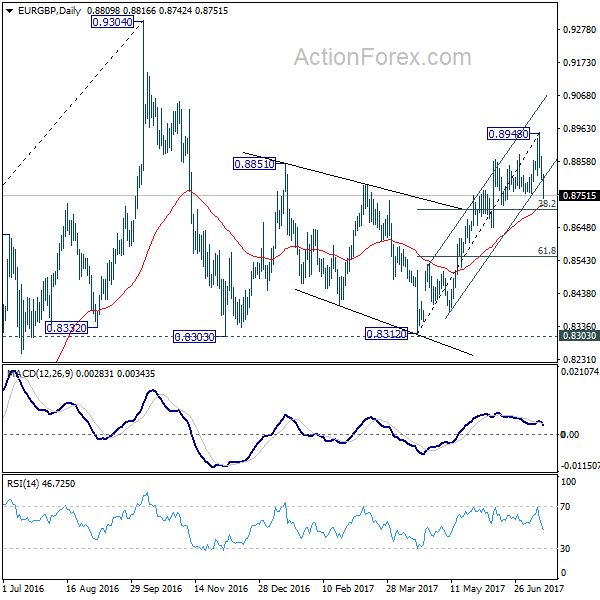
EUR/GBP surged to 0.8948 initially last week but reversed from there. Break of near term rising channel and 0.8756 support argues that rise from 0.8312 has completed, on bearish divergence condition in 4 hour MACD. Initial bias is now on the downside this week for 38.2% retracement of 0.8312 to 0.8948 at 0.8705 first. Break will target 61.8% retracement at 0.8555 next. On the upside, above 0.8816 minor support will turn intraday bias neutral and bring recovery. But deeper decline is now in favor as long as 0.8948 resistance holds.
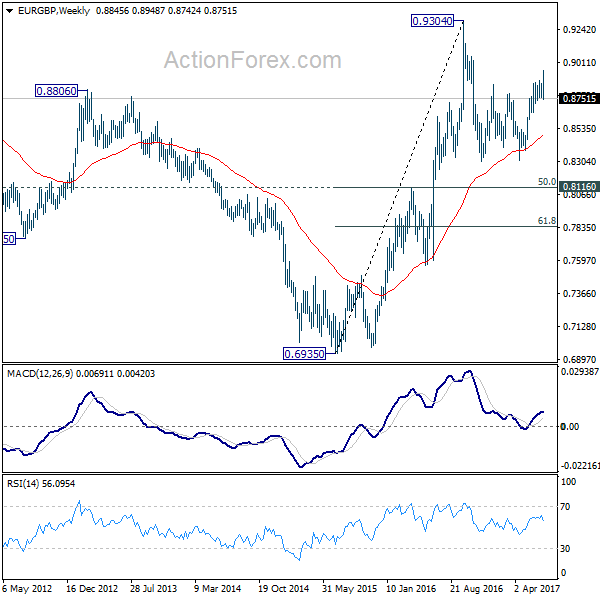
In the bigger picture, price actions from 0.9304 are viewed as a medium term corrective pattern. It's uncertain whether it is finished yet. But in case of another fall, we'd expect strong support from 0.8116 cluster support (50% retracement of 0.6935 to 0.9304 at 0.8120) to contain downside and bring rebound. Whole up trend from 0.6935 is expected to resume after consolidation from 0.9304 completes.
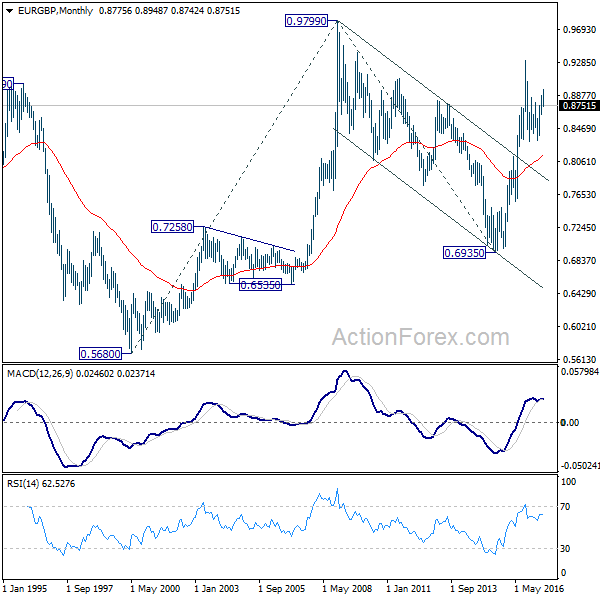
In the long term picture, firstly, price action from 0.9799 (2008 high) is seen as a long term corrective pattern and should have completed at 0.6935 (2015 low). Secondly, rise from 0.6935 is likely resuming up trend from 0.5680 (2000 low). Thirdly, this is supported by the impulsive structure of the rise from 0.6935 to 0.9304. Hence, after the correction from 0.9304 completes, we'd expect another medium term up trend to target 0.9799 high and above.
EUR/AUD Weekly Outlook
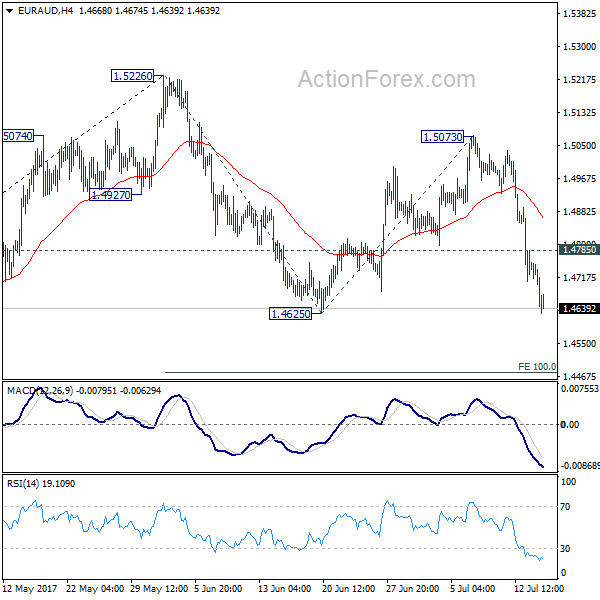
EUR/AUD's sharp decline last week indicates that the correction from 1.5226 is resuming. Initial bias remains on the downside this week. Decisive break of 1.4625 will target 100% projection of 1.5226 to 1.4625 from 1.4472 next. We'll look for bottoming signal below 1.4472. On the upside, above 1.4785 minor resistance will turn bias neutral and bring consolidations. But deeper fall is still expected as long as 1.5073 resistance holds.
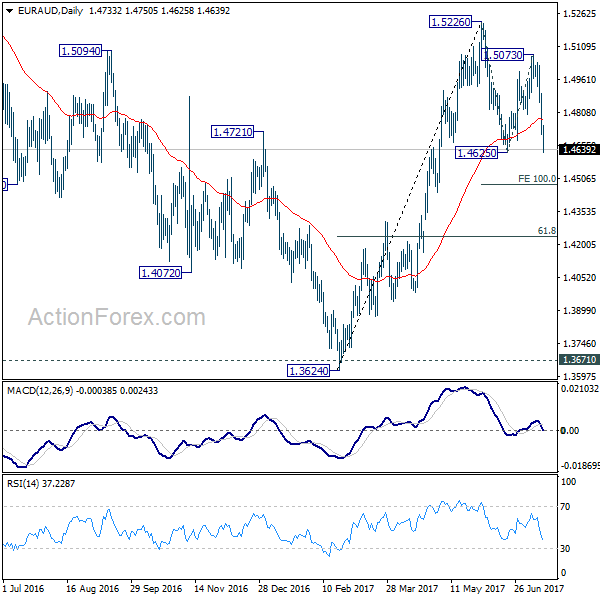
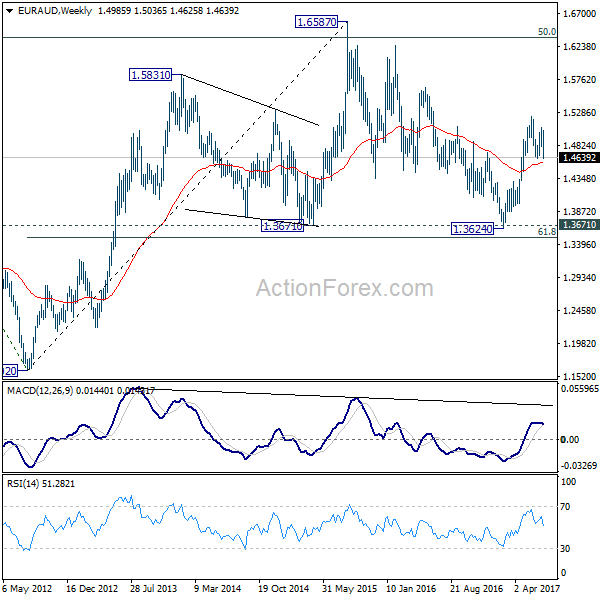
In the bigger picture, we're holding on to the view that corrective decline from 1.6587 medium term has completed at 1.3624. But we will monitor the structure of the decline from 1.5226 to adjust our view. Above 1.5226 will target a test on 1.6587 key resistance. However, further downside acceleration will dampen our view and would drag EUR/AUD lower to retest key support zone around 1.3624.
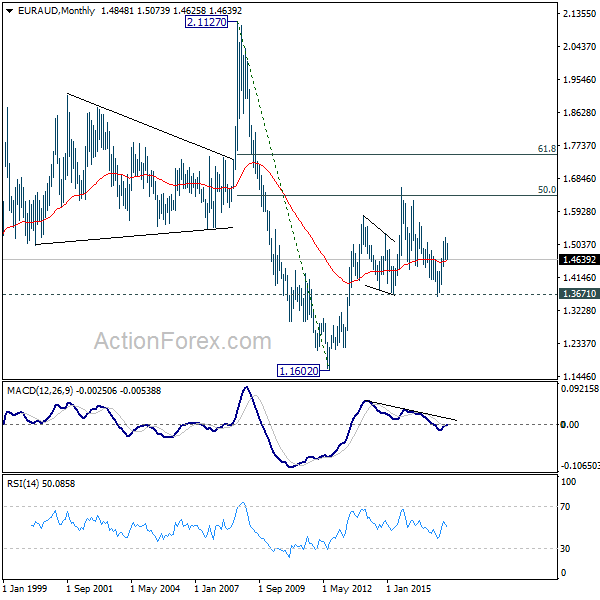
In the longer term picture, the rise from 1.1602 long term bottom isn't over yet. We'll keep monitoring the development but there is prospect of extending the rise to 61.8% retracement of 2.1127 to 1.1602 at 1.7488 and above. However, sustained trading below 1.3671 should confirm trend reversal and target 1.1602 long term bottom again.
EUR/CHF Weekly Outlook
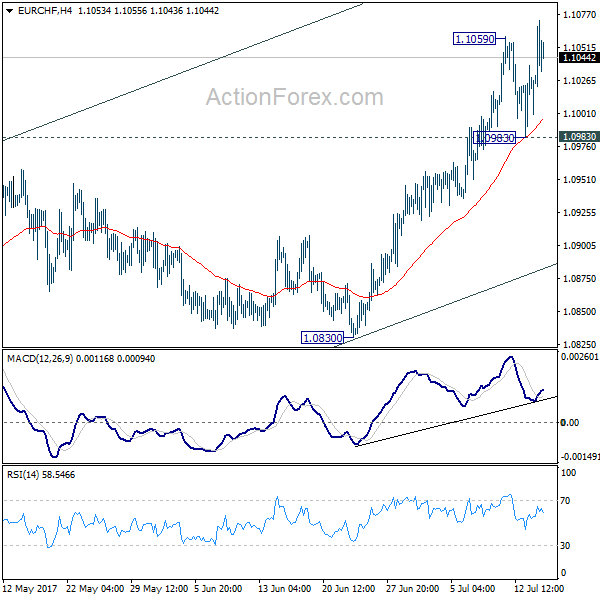
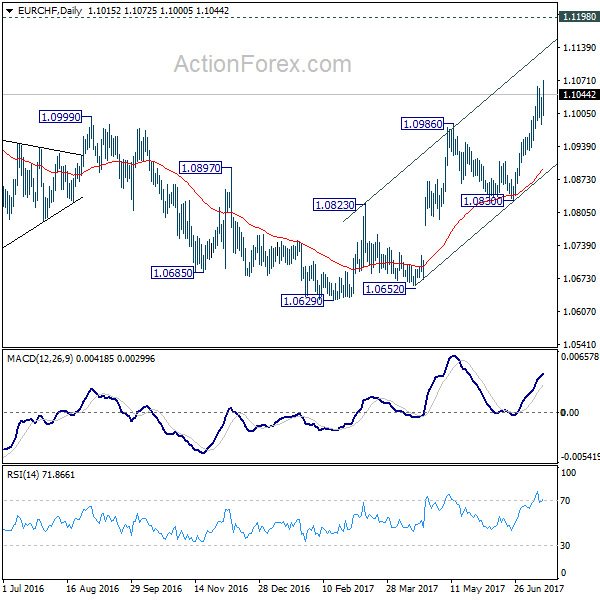
EUR/CHF surged to as high as 1.1072 last week and the development confirmed resumption of whole rally from 1.0629. Initial bias remains on the upside this week for key resistance at 1.1127/98. On the downside, break of 1.0983 support is needed to indicate short term topping. Otherwise, outlook will remain bullish in case of retreat.
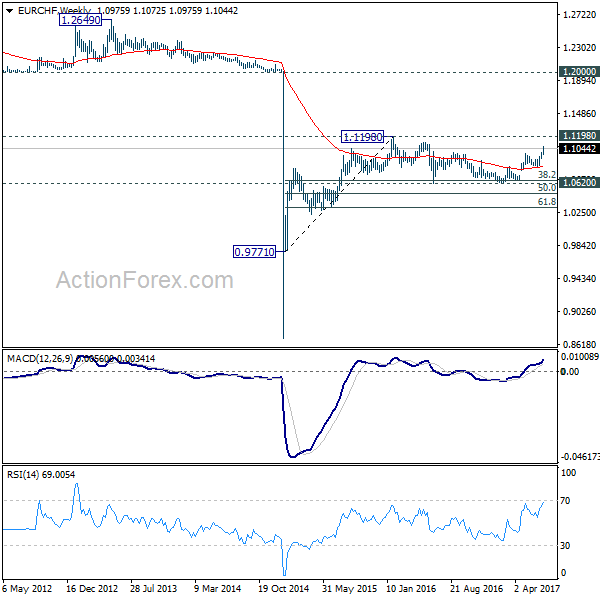
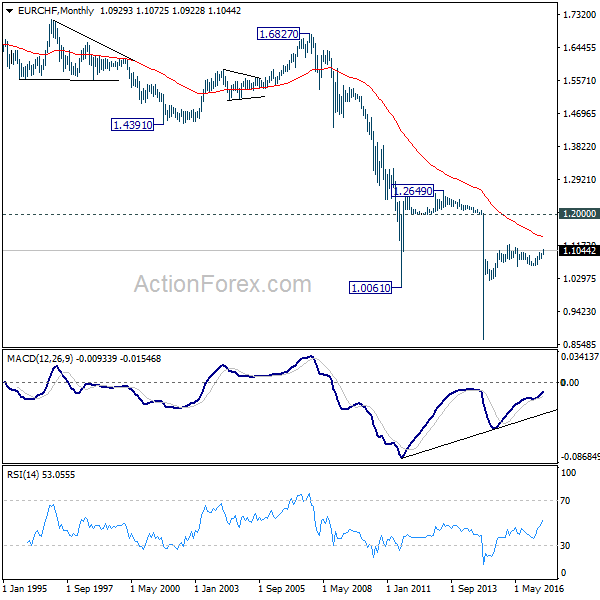
In the bigger picture, the price actions from 1.1198 are seen as a corrective move. Such correction could have completed after defending 38.2% retracement of 0.9771 to 1.1198 at 1.0653. Decisive break of 1.1198 will resume the long term rise from SNB spike low back in 2015. In such case, EUR/CHF could eventually head back to prior SNB imposed floor at 1.2000. However, rejection from 1.1198 will extend the multi-year range trading with another fall.
Dollar Broadly Lower after Dovish Yellen, Loonie Outshone by Aussie
Dollar ended last week as the weakest currency as markets took Fed Chair Janet Yellen's testimony as a dovish one. Traders further pared back bet on a rate hike in September. And the development was accompanied by surge in stock indices to record highs. Canadian Dollar ended as the second strongest as lifted by BoC rate hike and rebound in oil prices. But it was outshone by Australian dollar which soared on iron ore prices. Sterling followed as markets continued to adjust their expectations on a near term BoE hike after central banker comments. Euro and Swiss Franc followed Dollar as the weakest ones ahead of ECB meeting this week. Meanwhile, Yen traded mixed as focus is turning to BoJ meeting.
Yellen indicated rate not far from neutral
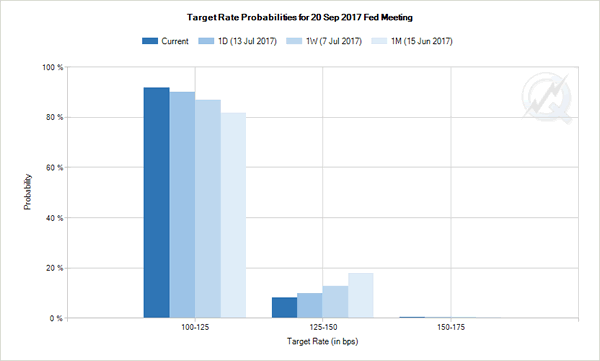
Fed Chair Janet Yellen delivered mostly what the markets expected during her testimony to Congress last week. She reiterated that Fed is still on course for "gradual" rate hike. The unwinding of the USD 4T balance sheet will start later this year. Nonetheless, the biggest surprise was that in her view, federal funds rate "would not have to rise all that much further" to reach a neutral level. Markets perceived that as a dovish sign that there is not much room for Fed to hike even if the tightening cycle is going to continue. Further more, traders continued to pare bet on rate hike after disappointing CPI and retail sales data. Currently, Fed fund futures are only pricing in 8.4% chance of a September hike. That's less than half of 18% pricing a month ago.
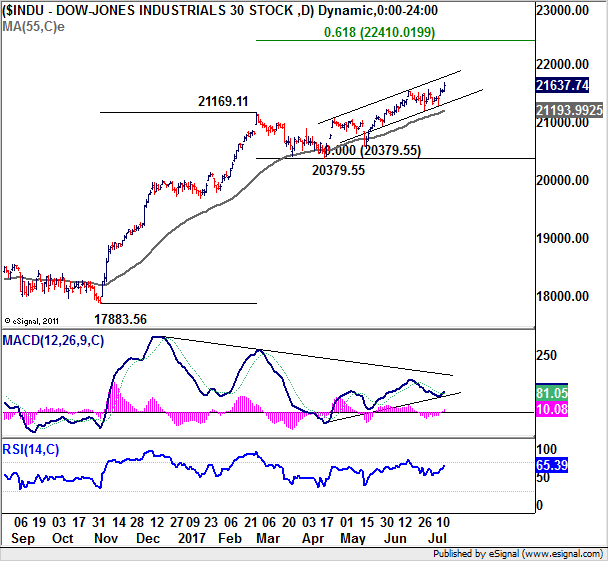
DOW and S&P 500 hit record highs
Such sentiments and expectation is also clearly seen in surging equity, falling yields and Dollar. US equity indices staged a strong upside breakout on Friday and surged to new records highs. DOW rose 84.65 pts, or 0.39% to close at 21637.74. S&P 500 rose 11.44 pts, or 0.47%, to close at 2459.7. Both are new records. NASDAQ also tried to catch up and rose 38.03 pts, or 0.61% to close at 6312.47, just inches below record high at 6341.70. DOW's up trend is relatively healthy and is set to extend. The index stayed comfortably above rising 55 day despite recent consolidation. Daily MACD also turned up above signal line, indicating regaining of momentum. The key will now be on near term channel resistance. Break there will indicate further upside acceleration and would likely violate the bearish divergence condition in daily MACD. In that case, DOW would target 61.8% projection of 17883.66 to 21169.11 from 20379.55 at 22410.02 next.
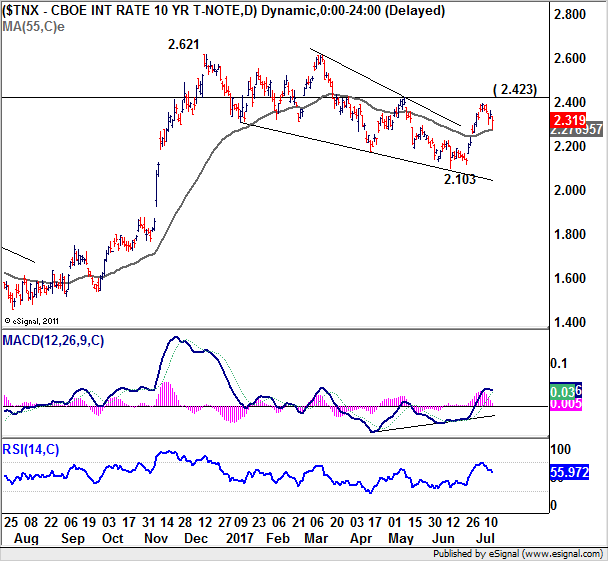
10 year yield rejected from near term resistance
Treasury yield, on the other hand, was rather unconvincing. The deep pull back in 10 year yield last week raised the chance that it's rejected by 2.423 resistance. But this it isn't confirmed yet as for the moment, TNX is still supported by 55 day EMA. Break of 2.423 will confirm that the consolidation pattern from 2.621 has completed at 2.103 and should bring retest of this high. However, sustained trading below 55 day EMA (now at 2.276) will extend the consolidation with another fall through 2.103.
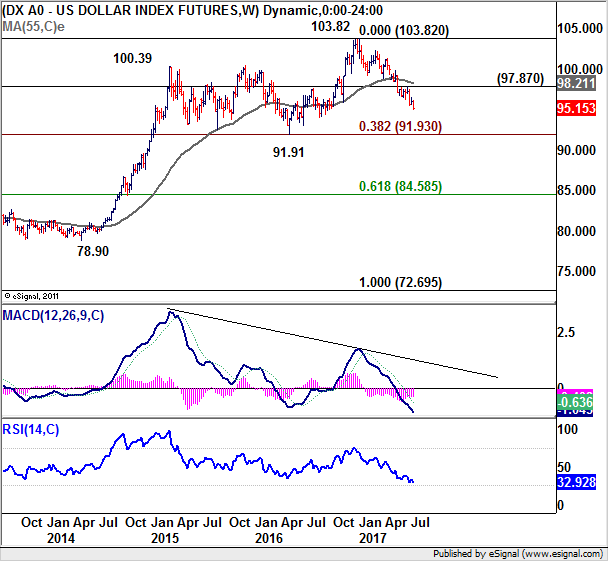
Dollar index extending long term correction
Dollar index's decline from 103.82 continued last week to close at 95.15. There is no change in the near term bearish outlook. Such fall from 103.82 is correcting the long term up trend from 2011 low at 72.96. Further fall is expected as long as 97.87 resistance holds. Deeper decline would be seen to 91.91 cluster level (38.2% retracement of 72.69 to 103.82 at 91.93) before having enough support for sustainable rebound.
Loonie jumped on BoC hike and oil rebound
Canadian Dollar was boosted by the neutral BoC rate hike last week, as well as rebound in oil price. As we noted before, there was a risk to Canadian Dollar if BoC signaled that the highly anticipated rate hike was a one-off. Instead, the central bank said in the statement that ""future adjustments to the target for the overnight rate will be guided by incoming data as they inform the Bank's inflation outlook". This was taken by the markets as an indication that BoC is now in a tightening cycle. Upcoming data, including this week's CPI and retail sales, could drive the Loonie further high.
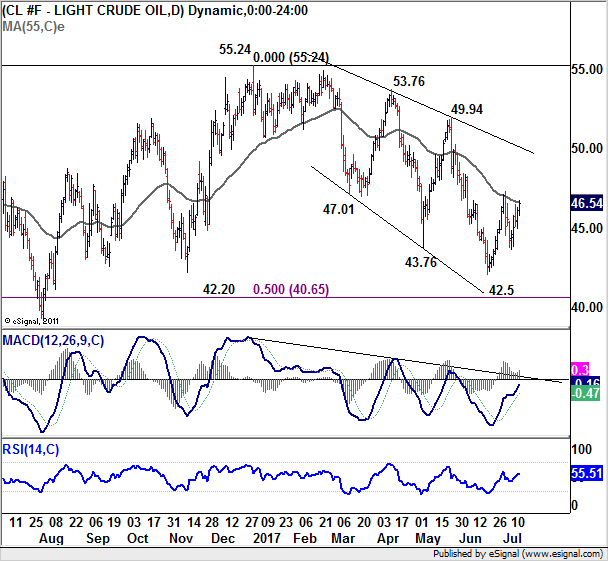
At the same time, oil price will be another factor for Loonie traders to watch. Last week's rebound put 55 day EMA back into focus ( now at 46.64). Sustained break there will extend the rebound from 42.5 to trend line resistance, which is close to 50 handle. Nonetheless, rejection from 55 day EMA will bring another fall towards 50% retracement of 26.05 to 55.24 at 40.65 before completing the correction from 55.24.
Aussie surged on increasing Chinese demand on Iron Ore
While Canadian Dollar was strong, it was indeed out-performed by Australian Dollar, which ended as the strongest currency last week. A key boost to Aussie was report that iron ore price jumped on pickup in Chinese demand. It's reported that China imported 94.7m tonnes of iron ore in June, up from 91.5m tonnes in May. A total of 539m tonnes was imported in the first half of the year. And, China is going to buy as much as 1b tonnes of iron ore from overseas producers this year. More importantly, if the pace in the first half continued, China iron ore import would top record of 1024b tonnes. Iron ore price was back to 65 level after tumbling to 53 back in June on concerns of slowing China import. AUD/USD jumped to close at 0.7828 and the upside acceleration could push for a strong breakout that indicate larger trend reversal.
Sterling saved by hawk McCafferty
Sterling was the third strongest currency as market looked past recent disappointing economic data. BoE Deputy Governor Ben Broadbent's comment that he's not ready to vote for a hike in August triggered brief setback in the Pound. But BoE hawks Ian McCafferty's talk of unwinding the GBP 435b assets revived speculations of tightening. This was indeed the first time a BoE official talked about unwinding in public. And McCafferty has made it very clear that he will still vote for a rate hike in the next meeting. Sterling staged a strong come back as markets were repositioning themselves ahead of this week's inflation data from UK.
Euro weakened as ECB likely to be outpaced by BoC and RBA
Euro was the third weakest currency, next to Dollar and Swiss Franc. It's still generally expected that ECB would announce tapering of some sort in September, or by latest in October. There were also talks that ECB President Mario Draghi would make use of the annual Jackson Hole conference in US to signal a policy shift. However, there were also media reports that ECB would prefer to maintain flexibility and not indicate a clear end to the asset purchase program. Markets will be eager to look into ECB rate decision and press conference this week for more guidance, but there is unlikely anything new. For now, judging from the steep decline in EUR/CAD and EUR/AUD, traders could be trading the fact that even if ECB is on course for stimulus exit would be far outpaced by BoC and RBA.
Trading strategy: Buy GBP/CHF
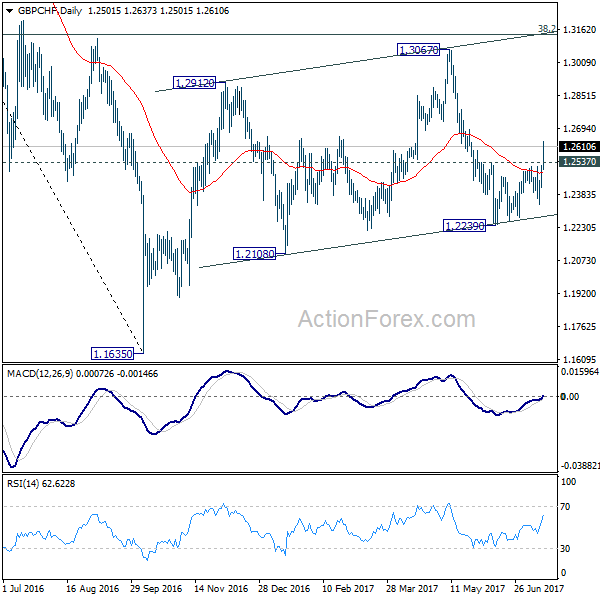
The overall theme in the markets is unchanged. That is, we're now entering into an era of monetary stimulus removal. Yen and Swiss Franc will continue to lag behind other major currencies. For the moment, we'd prefer not to chance rally in Loonie and Aussie, as well as Yen crosses. Instead, we'll try to buy GBP/CHF as the late rebound is taken as a sign of near term reversal. The strong break of 1.2537 resistance indicates that pull back from 1.3067 has completed at 1.2239 after drawing support from near term channel. We'll buy GBP/CHF at market this week for short term rally back to 1.3067. At this point, there is no sign of larger reversal yet with 38.2% retracement of 1.5570 to 1.1635 at 1.3138 intact. Hence, we'll get out at 1.3000, with a stop put at 1.2450.
AUD/USD Weekly Outlook
AUD/USD surged to as high as 0.7833 last week as rise from 0.7328 extended. The upside acceleration argues that it's resuming larger rebound from 0.6826 bottom. Initial bias remains on the upside this week. Firm break of 0.7833 resistance will confirm this bullish case and target 61.8% projection of 0.6826 to 0.7833 from 0.7328 at 0.7950 next. On the downside, below 0.7739 minor support will turn intraday bias neutral first. But near term outlook will stay cautiously bullish as long as 0.7570 support holds.
In the bigger picture, current development suggests that rebound from 0.6826 is developing into a medium term rise. There is no confirmation of trend reversal yet and we'll continue to treat such rebound as a corrective pattern. But in any case, further rise is now expected to 55 month EMA (now at 0.8100) or even further to 38.2% retracement of 1.1079 to 0.6826 at 0.8451. Break of 0.7328 support is needed to confirm completion of the rebound. Otherwise, further rise is now in favor.
In the longer term picture, 0.6826 is seen as a long term bottom. Rise from there could either reverse the down trend from 1.1079, or just develop into a corrective pattern. At this point, we're favoring the latter. And, as long as 38.2% retracement of 1.1079 to 0.6826 at 0.8451 holds, we'd anticipate another decline through 0.6826 at a later stage.
Eco Data 7/21/17
[php_everywhere] [/php_everywhere]