Sample Category Title
China’s Factory Rebound: What You Need To Know
Key Points:
- Chinese GDP Growth rockets to 6.9% y/y.
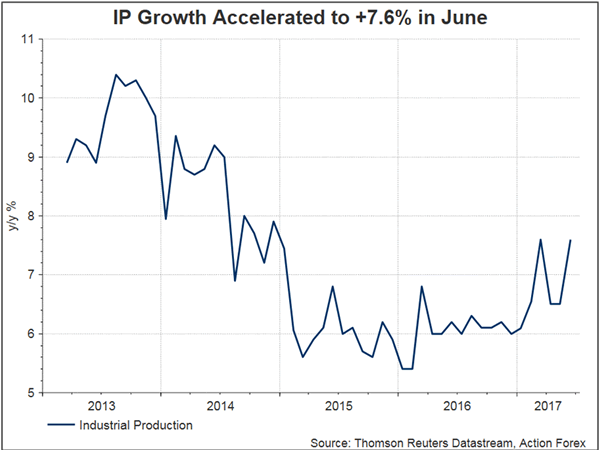
- Industrial Production also increases to 7.6% y/y.
- However, credit impulse is not yet evident in latest GDP figures.
Markets largely got a shock overnight as China released its latest iteration of GDP growth and Industrial Production figures. Surprisingly, the data showed that the Chinese economy grew by over 6.9% y/y in the second quarter whilst Industrial Production rose to an exceedingly strong 7.6% y/y. Subsequently, the momentum remained in place for the manufacturing powerhouse but it remains to be seen if the trend continues given some of the headwinds facing the economy.
The reason the result is so surprising is the fact that the Chinese economy has undergone some significant shocks in the past three months, which have included a national deleveraging, real estate slow down, and sinking macro indicators. Subsequently, the consensus view was that the major economic indicators would, again, provide a sharp beat and confirm the domestic softness that many have speculated over in the past few weeks.
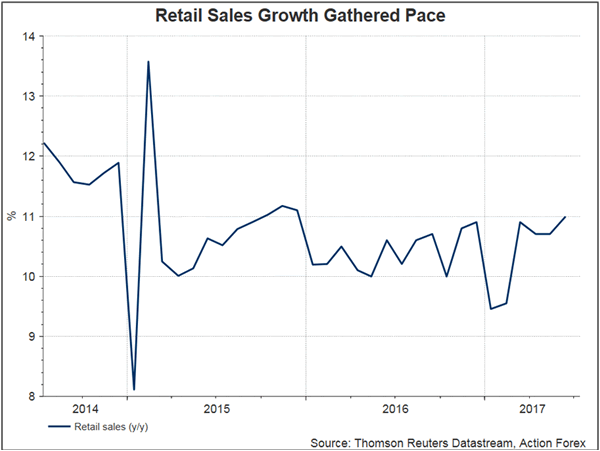
However, instead we received a July surprise with even Retail Sales figures rising sharply to 11.0% but you would be forgiven for questioning the veracity of the data given that 'economic data management' has been known to occur. The narrative around the current results seem to imply that the Asian powerhouse is currently awash in credit and that much of the recent expansion is being driven by consumer demand (as well as exports).
Certainly, the current expansion could be seen as positive or negative depending on your view around the mounting risks of loose and cheap credit. However, it should be noted that China's recent drive towards fixing some of the financial risk issues within the economy is yet to flow through to the wider macroeconomic indicators.
Subsequently, we are likely to see a lagged response to the latest campaign/credit impulse and this will inexorably impact GDP in the near term. However, it's relatively clear that the deleveraging process has been successful for Beijing and was particularly well timed. What's less clear is what role fiscal policy is playing in the broader economic sense given that it has previously been an important part in recent growth figures.
At the time of writing, there has been little impact on the Yuan but Chinese equities have soared in response to the data dump. However, it remains to be seen in the near term if the sentiment remains in place and, subsequently, buoys the Yuan. Ultimately, the impact of the risk deleveraging is likely to flow through to the wider economy over the next few months and it will absolutely affect the positive view that most analysts have taken following the release of the 'mother of all data dumps'.
China Watch – 2017 Growth Target On Track, Xi Commands To Prevent Risks And Tighten Regulations
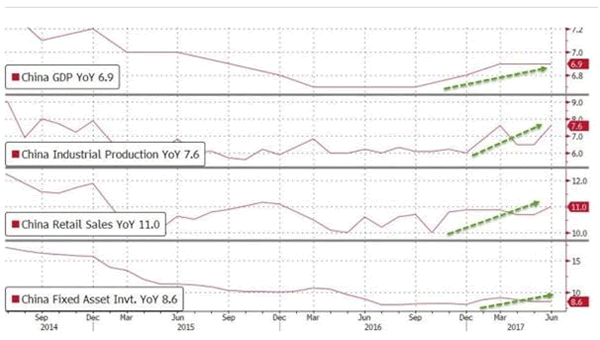
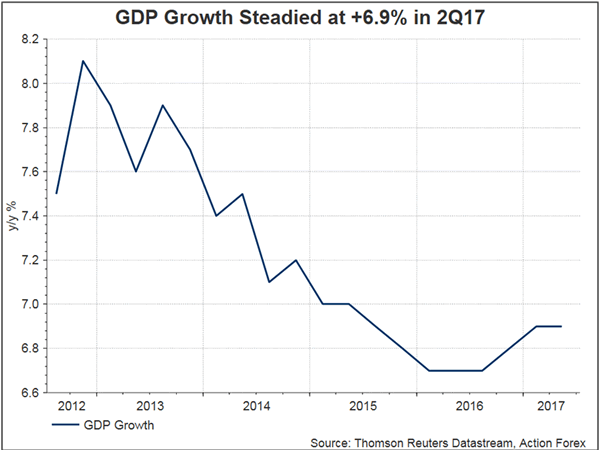
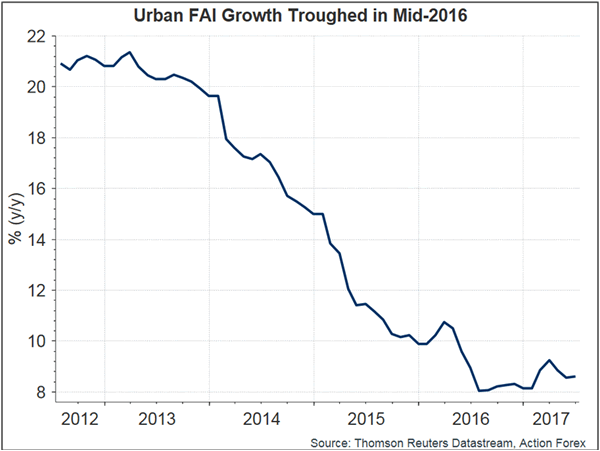
China's macroeconomic data for 2Q17 surprised to the upside. China's GDP expanded +6.9% y/y in 2Q17, same pace as the prior quarter but above consensus of +6.8%. Economic activities in June continued to improve. Industrial production growth accelerated to +7.6% y/y in June, beating consensus of and May's +6.5%. Retail sales expanded +11% y/y in June, up from +10.7% a month ago. The market had anticipated mild deceleration to +10.6%. Fixed asset investment in urban areas grew +8.6% y/y in the first half of the year, same pace as in the first five months of the year. The government acknowledged that the country's economy continued to improve. It appears that the country's growth is on track to meet the government target of “around +6.5%”.
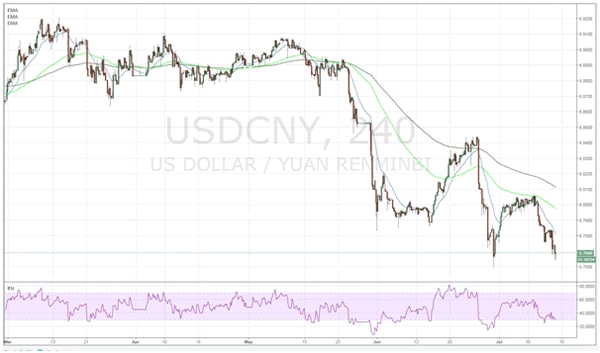
Renminbi extended its recent strength against the US dollar after the releases. Onshore USDCNY fell to as low as 6.7644 at one point, only modestly above the 7-month low of 6.7598. The government has aggressively fixed the currency at 6.7562 against the greenback, down from 6.7774 on Friday. Today's fixing marks the lowest since November 2016.
Xi Highlighted Risks and Regulations at National Financial Work Conference
In his first address at the National Financial Work Conference, which is held once every five years, over the weekend, Chinese President Xi Jinping affirmed that the PBOC would play a stronger role in defending against risks, calling for more work on safeguarding the financial system and modernizing its regulatory framework. Interestingly, the word “risk” appeared 31 times in the meeting note, followed by “regulation”, which appeared 28 times, signaling that implementation of “regulations” to prevent financial system “risks” is the key direction of the government's policy.
PBOC Warned of Risks and Pledged to Regulate
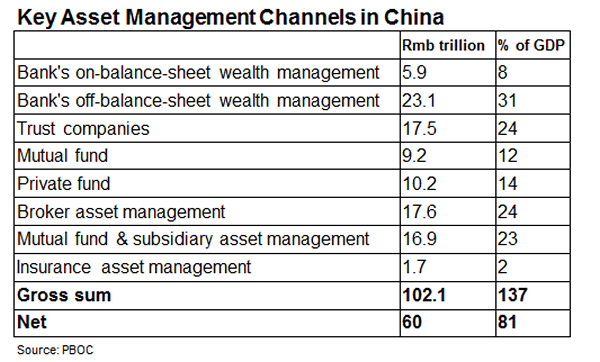
Indeed, the PBOC in its financial stability report, released on July 4, summarized six major risks to domestic economy, namely, downward pressure on growth, high leverages of non-financial corporate, rapid rise in non-performing loans, high risks of informal debt operations in certain local governments, elevated property prices in first and second tier cities and high inventory levels in tier 3 and 4 cities, and unregulated development of financial products. The central bank pledged that it, together with other regulatory bodies, would endeavor to curb risks involved in shadow banking, real estate financing, local government financing platforms, internet financing and illegal fundraising activities. The institutions would increase supervision over outbound investment and prevent shocks from external challenges.
PBOC, for the first time on record, unveiled that the total size of commercial banks off-balance-sheet asset was at RMB 254 trillion by the end- 2016. This marks 109% of the total on-balance-sheet asset. The central bank cautioned over possible contagious risks to on-balance sheet assets.
We expect the government would continue its tightening policy targeting specific asset classes (including Bitcoin and real estate). With the momentum of economic growth in line with the government's full-year target, the monetary policy would be more likely tighter than looser from the current conditions.
Aussie Dollar Trading Lower In The Asian Session
For the 24 hours to 23:00 GMT, the AUD rose 1.2% against the USD and closed at 0.7825 on Friday.
LME Copper prices declined 0.8% or $44.0/MT to $5858.0/MT. Aluminium prices declined 0.4% or $7.0/MT to $1904.0/MT.
In the Asian session, at GMT0300, the pair is trading at 0.7816, with the AUD trading 0.12% lower against the USD from Friday's close.
Earlier today, data showed that China's, Australia's largest trading partner, gross domestic product (GDP) rose more-than-expected by 6.9% YoY in the second quarter of 2017, aided by a pick-up in industrial output and strong investment. The GDP had recorded a similar rise in the prior quarter, while market participants anticipated for an expansion of 6.8%. Further, the nation's industrial production gained 7.6% on an annual basis in June, exceeding market expectations for a rise of 6.5%. In the previous month, industrial production had climbed 6.5%. Also, the nation's retail sales grew more-than-anticipated by 11.0% YoY in June, rising at its fastest pace since December 2015. In the previous month, retail sales had advanced 10.7%.
The pair is expected to find support at 0.7756, and a fall through could take it to the next support level of 0.7696. The pair is expected to find its first resistance at 0.7855, and a rise through could take it to the next resistance level of 0.7894.
Looking ahead, the Reserve Bank of Australia's recent meeting minutes, slated to release in the early hours of tomorrow, will be eyed by traders.
The currency pair is trading above its 20 Hr and 50 Hr moving averages.

Euro-Zone’s Trade Surplus Slightly Widened In May
For the 24 hours to 23:00 GMT, the EUR rose 0.63% against the USD and closed at 1.1469 on Friday.
On the data front, the Euro-zone's seasonally adjusted trade surplus widened less-than-expected to a level of €19.7 billion in May, following a revised surplus of €18.6 billion in the previous month, while markets were anticipating the region's trade surplus to expand to a level of €20.2 billion.
The greenback lost ground against its major counterparts on Friday, on the back of disappointing US inflation and retail sales data that fuelled fresh doubts over the Federal Reserve's (Fed) ability to increase interest rates for a third time this year.
Data indicated that the US consumer price index (CPI) remained flat on a monthly basis in June, compared to market expectations for a rise of 0.1% and following a drop of 0.1% in the previous month. Meanwhile, on an annual basis, the CPI climbed less-than-expected by 1.6% in June, posting its smallest gain since October 2016. In the previous month, the CPI had gained 1.9%, while investors had envisaged for an advance of 1.7%. Additionally, the nation's advance retail sales unexpectedly dropped 0.2% on a monthly basis in June, declining for a second straight month and defying market consensus for a rise of 0.1%.
In the prior month, advance retail sales had fallen by a revised 0.1%. Further, the nation's preliminary Reuters/Michigan consumer sentiment index fell to a 9-month low level of 93.1 in July, surpassing market expectation for a drop to a level of 95.0, as consumers lost confidence in faster growth prospects in the US under the Trump administration. The index had registered a reading of 95.1 in the prior month.
Another set of economic data revealed that the US industrial production rose 0.4% on a monthly basis in June, topping market expectations for an advance of 0.3%. In the prior month, industrial production had risen by a revised 0.1%. Also, the nation's manufacturing production rebounded 0.2% MoM in June, at par with market expectations and after recording a drop of 0.4% in the prior month. Moreover, the nation's business inventories rose 0.3% in May, meeting market expectations. Business inventories had dropped 0.2% in the prior month.
In the Asian session, at GMT0300, the pair is trading at 1.1463, with the EUR trading a tad lower against the USD from Friday's close.
The pair is expected to find support at 1.1418, and a fall through could take it to the next support level of 1.1372. The pair is expected to find its first resistance at 1.1492, and a rise through could take it to the next resistance level of 1.1520.
Going ahead, traders will look forward to the Euro-zone's final consumer price index data for June and the German Bundesbank monthly report, both slated to release in a few hours. Additionally, the US New York Empire State Manufacturing index for July, scheduled to release later today, will be on investors' radar.
The currency pair is trading above its 20 Hr and 50 Hr moving averages.

UK’s Rightmove House Prices Rebounded In July
For the 24 hours to 23:00 GMT, the GBP rose 1.27% against the USD and closed at 1.3105 on Friday.
In the Asian session, at GMT0300, the pair is trading at 1.3102, with the GBP trading marginally lower against the USD from Friday's close.
Overnight data indicated that Britain's Rightmove house price index rebounded 0.1% on a monthly basis in July, following a drop of 0.4% in the previous month.
The pair is expected to find support at 1.2990, and a fall through could take it to the next support level of 1.2878. The pair is expected to find its first resistance at 1.3164, and a rise through could take it to the next resistance level of 1.3226.
The currency pair is trading above its 20 Hr and 50 Hr moving averages.

Japanese Yen Trading Lower In The Asian Session
For the 24 hours to 23:00 GMT, the USD declined 0.74% against the JPY and closed at 112.54 on Friday.
In the Asian session, at GMT0300, the pair is trading at 112.62, with the USD trading 0.07% higher against the JPY from Friday's close.
The pair is expected to find support at 112.10, and a fall through could take it to the next support level of 111.59. The pair is expected to find its first resistance at 113.30, and a rise through could take it to the next resistance level of 113.99.
On account of a holiday in Japan today, investor sentiment will be governed by global macroeconomic news.
The currency pair is showing convergence with its 20 Hr moving average and trading below its 50 Hr moving average.

Swiss Franc Reverses Its Gains In The Morning Session
For the 24 hours to 23:00 GMT, the USD declined 0.38% against the CHF and closed at 0.9636 on Friday.
In the Asian session, at GMT0300, the pair is trading at 0.9642, with the USD trading 0.06% higher against the CHF from Friday’s close.
The pair is expected to find support at 0.9614, and a fall through could take it to the next support level of 0.9585. The pair is expected to find its first resistance at 0.9686, and a rise through could take it to the next resistance level of 0.9729.
The currency pair is trading below its 20 Hr and 50 Hr moving averages.

Loonie Trading Lower, Ahead Of Canada’s Existing Home Sales Data
For the 24 hours to 23:00 GMT, the USD declined 0.67% against the CAD and closed at 1.2648 on Friday.
In the Asian session, at GMT0300, the pair is trading at 1.2656, with the USD trading 0.06% higher against the CAD from Friday's close.
The pair is expected to find support at 1.2615, and a fall through could take it to the next support level of 1.2574. The pair is expected to find its first resistance at 1.2722, and a rise through could take it to the next resistance level of 1.2788.
Ahead in the day, investors will closely monitor Canada's existing home sales data for June.
The currency pair is trading below its 20 Hr and 50 Hr moving averages.

Market Morning Briefing: Weak US Economic Data
STOCKS
Dow (21637.74, +0.39%) has closed above 21600, breaking a major long term resistance and in case it holds, we could see the rally to continue towards 22000 which could be an immediate resistance. A small dip from 22000 is possible before it resumes its rally towards 22500 and higher in the longer run.
Dax (12631.72, -0.08%) rose sharply last week and could possibly continue towards 12750-12800 before again coming back towards current levels. Near term looks bullish.
There have been some talks of concern over tightening of financial regulations. Shanghai (3189.48, -1.02%) fell to levels near 3139 in the morning trade before again recovering to levels near 3190. Immediate support is seen near 3170 which if holds could keep the prices higher for the coming sessions. A bounce back towards 3200 and higher is on the cards for the near term.
Nikkei (20118.86, +0.09%) needs to bounce back from current levels to move up towards 20300 and higher; else a break below 20000 is possible initiating fall over the coming sessions. For now our preferred view is to see a bounce towards 20300.
Nifty (9886.35, -0.05%) has scope of moving up towards 10000 in the coming sessions before it comes down to 9800. Near term looks bullish.
COMMODITIES
Recent weakness in Dollar index (94.95) has impacted positively across all the commodities. Gold (1231) has managed to break its recent short term down trend channel and hovering around its crucial resistance of 1232. A close above that could open up 1245 and 1258 levels respectively. Silver (16.02) is still within its downward channel though there are chances of a upside rally towards 16.54 regions.
Copper (2.69) moved marginally higher within the trading range of 2.66-2.78. We have been bullish on copper since 22nd of June and we will remain so while it is trading above 2.55 levels. A close above 2.78 regions could open up 2.85 levels as well.
The energy pack had closed higher and it might remain stable while above 47.70 (Brent) and 45 (WTI) respectively. Most factors are supportive for oil at the moment. These Supports has held on weekly basis and Brent (49.06) and WTI (46.67) has moved up in line with our expectation. We think some more rises towards 51.20 and 47.70 is possible within a couple of days.
For the near term, Brent and WTI seems to be trading in a 47-51 and 45-48 range now and the medium term ranges are now 44-52 and 42-50. The big question is whether we will see a rise past 52 (Brent) and 50 (WTI) or not by the end of July and to get a clue on that, we will keep an eye on U.S Weekly crude oil inventories. But we will remain bullish in near term while Brent and WTI are trading above 47 and 45 regions on an closing basis.
FOREX
Weak US economic data increased the doubt over any further Fed rate hike this year and kept the pressure on Dollar unchanged.
Dollar Index (95.18) has broken below the support of 95.50-40 in line with expectations and now much lower levels of 94.00 comes into consideration. The trend remains firmly down with 96.50 as a major resistance in the near term.
Euro (1.1462) has broken above its immediate resistance of 1.1440 on the back of the strengthening German 30Yr yields as discussed last week. Cautious stance is recommended in the long term resistance zone of 1.1500-1.1600 despite the firm uptrend till now.
Dollar-Yen (112.63) failed to hold above 112.65 and weakened further. The current correction may extend to 111.50-00 if 112.30 is unable to hold. With other majors in a firm footing, the chances of seeing 111.50-00 look stronger.
Aussie (0.7815) has seen a major breakout as it tested the 15-month high of 0.7835. If it can sustain above 0.7700 in the any correction in the next few sessions and the breakout doesn’t turn out to be a false one, then it can be taken as a long term shift to the bullish side and the immediate target would be 0.8150-75.
Pound (1.3101) had a similar major breakout above the resistance zone of 1.3030-50 to register a 10-month high and now may rise towards 1.32 and later, 1.34.
Dollar-Rupee (64.45) closed absolutely flat in the last session but our view remains unchanged as we look forward to 64.20 being tested this week on a break below 64.40-35.
INTEREST RATES
The US yields are almost stable. Note that they are all trading below crucial long term resistances and could be bearish for the medium term. The 10-5YR (0.46%) could face some rejection from 0.4625% and could come off in the next few sessions.
The UK yields have started to rise again and look bullish for the current week. The 10YR (1.31%) could move up towards 1.40% while the 30Yr (1.83%) and the 5YR (0.69%) can move up towards 1.90% and 0.75% respectively.
The UK 10-5Yr (0.62%) is testing resistance near current levels and if that holds, a corrective fall is possible in the coming sessions.
The German yields are trying to rise and could move up slowly in the coming sessions.
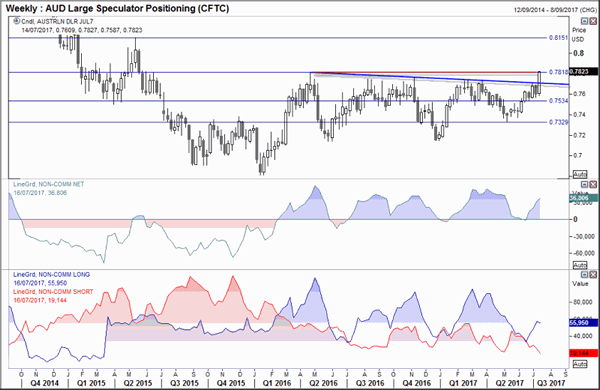
Back To The Futures: 17th July 2017
A snapshot view of large speculative positioning from the weekly CFTC report and analysis of related futures markets.
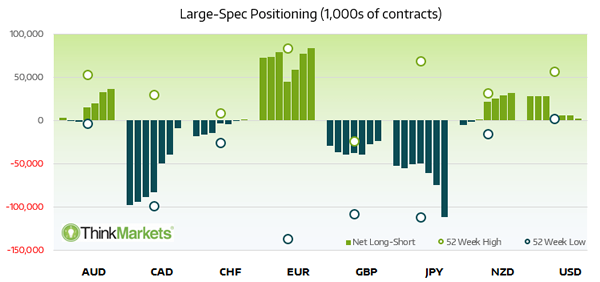
The Yen experienced the largest weekly change to positioning, with +34.2k shorts added to drag net exposure to its most bearish level since June 2016.
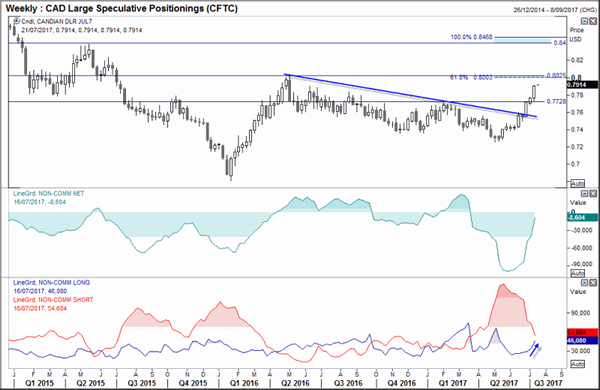
Canadian Dollar bears closed -18.9k contracts and added +11.8k bullish positions, to send net short exposure to its lowest level since March.
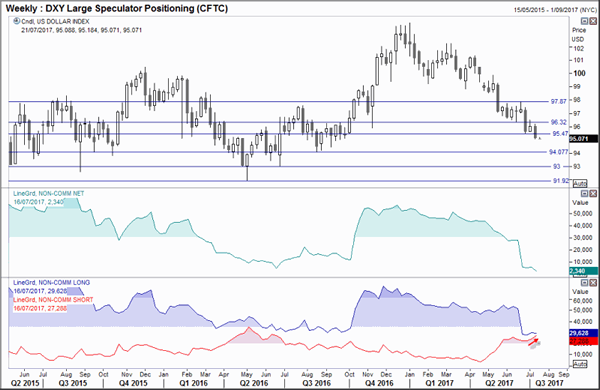
The US Dollar Index is on the verge of switching to net short, although price action following the report suggests this may have already occurred.

DXY: The S Dollar Index is on the verge of flipping to net short. Price action following Tuesday's close (when report is compiled) suggests we may already be net short as the index touched a 10-month low by the close. The rise of gross short positioning takes it to its highest level since Q1 2016 and if data continues to disappoint, then DXY is likely headed for 93 over the coming weeks.
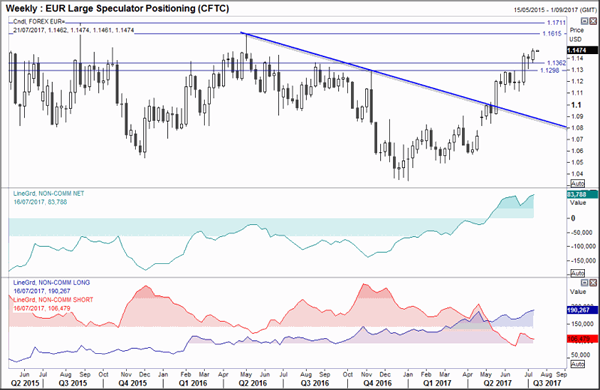
EUR: The Euro continued its ascent, helped higher by a dovish Fed and weak US inflation. 116 is the next target and we will seek to buy the dips whilst above last week's low. The steady stream of gross longs continues to rise and gross shorts remains subdued, which is the sign of a healthy trend. However, a quick glance at the charts suggests commodity currencies benefitted from the weak US Dollar more than Euro did so, whilst we remain bullish on Euro, it is not necessarily the best outperformer around a weaker US Dollar.
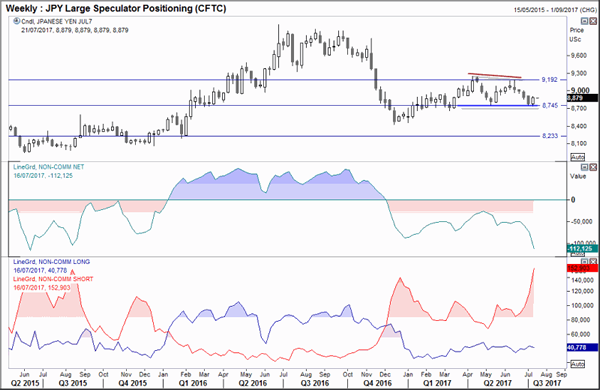
JPY: The Yen respected 8,745 support to further delay the potential double top. If we ray from here then we can consider a triple top of triangle formation. Yet speculative positioning appears to be front running a bearish break. Gross short positioning has risen sharply these past three weeks which has dragged the net short interest to its lowest level since 2015. Fundamentally we are bearish the Yen so now await the technicals to confirm what the bearish speculators already suspect – a bearish follow-through over the coming week/s.
AUD: The Australian Dollar jumped to the 2016 high on Friday after making light work of the neckline. A break of 0.7818 appears imminent, which then puts 0.80 and 0.8151 in focus. That recent gains have been seen as gross longs also rise adds extra confidence in the move. However, we also know the RBA do not want their currency to rise too much so there may be concerns of an easing bias to return if the rally moves too far too fast. Technically further gains appear more likely on the near-term so it remains in our bullish watch list this week.
CAD: The Canadian Dollar has seen a heavy reduction of gross short exposure, some of which has flipped to the long side. What was originally a rally fuelled by short-covering is now supported by fresh bids. The BoC raised rates last week, yet also surprised markets with a hawkish statement. So, like AUD, CAD remains in our bullish watchlist for the week as technicals and fundamentals remain supportive.