Sample Category Title
Eco Data 7/20/17
[php_everywhere] [/php_everywhere]
Eco Data 7/19/17
[php_everywhere] [/php_everywhere]
Eco Data 7/18/17
[php_everywhere] [/php_everywhere]
Eco Data 7/17/17
[php_everywhere] [/php_everywhere]
Summary 7/17 – 7/21
Monday, Jul 17, 2017
[php_everywhere] [/php_everywhere]
Tuesday, Jul 18, 2017
[php_everywhere] [/php_everywhere]
Wednesday, Jul 19, 2017
[php_everywhere] [/php_everywhere]
Thursday, Jul 20, 2017
[php_everywhere] [/php_everywhere]
Friday, Jul 21, 2017
[php_everywhere] [/php_everywhere].
Weekly Economic and Financial Commentary
U.S. Review
Key Economic Indicators Mixed in June
- All eyes were on Chair Janet Yellen this week as she gave testimony at the Semiannual Monetary Policy meeting to Congress. She reiterated components of the economy where the Fed is less certain about the path of growth, namely inflation.
- Retail sales and consumer prices came in below expectations in June, while industrial production posted a stronger than expected reading. Although retail sales were weaker than expected, the year-over-year rate still suggests the expansion in consumer spending has room to grow. Year-over-year core consumer prices were unchanged at 1.7 percent in June.
Revisiting the Four Big Uncertainties
"The quest for certainty blocks the search for meaning. Uncertainty is the very condition to impel man to unfold his powers." Erich Fromm (American psychoanalyst)
In mid-2016, Chair Janet Yellen highlighted four big uncertainties confronting the U.S. economy. At the time, she mused whether domestic spending would continue to be the main driver of real GDP growth, offsetting weak business fixed investment growth and the outlook for the global economy, productivity growth, and inflation dynamics.
About one year later, in the biannual Monetary Policy Report to the Congress, the theme of uncertainty was revisited and although the text is somewhat different, the list of unknowns looks vaguely familiar. Topics rekindled included inflation, in particular, how it will respond to low resource slack, fiscal policy, and an old favorite, global trade, especially as the Bank of Canada is among the first major central banks, other than the Fed, to begin tightening monetary policy. Indeed, indicators released during the week continued to shed light on some of these uncertainties.
Producer prices excluding, food, energy, and trade services, which is a measure of core wholesale prices, rose 2.0 percent in June relative to a year earlier, a tick softer than the gain in prices in the previous month. Core prices further back in the pipeline were mixed, with intermediate goods excluding food and energy down on the month, marking the first decline in 16 months. Unprocessed goods, nonfood excluding energy edged higher and are up 3.4 percent year over year. Although the increase in raw material prices appears to support the view that prices should climb higher in the coming months, the pass through to the consumer has been limited.
Headline consumer prices were flat in June, with weakness in commodities, wireless telephone services, lodging, airline fees, and apparel. Year over year, headline prices are up 1.6 percent, which is roughly in line with core prices. Core prices, which exclude food and energy, rose modestly in June, marking the third straight monthly gain. The shelter component, which is the largest core segment, grew more than 3 percent over the past year; roughly around the same pace registered since early-2016. The read on the trend in inflation after the June CPI report is largely unchanged.
Nominal retail sales came in below expectations in June, falling 0.2 percent, with the largest declines registered at gasoline stations, restaurants, and miscellaneous stores (e.g. bakeries, and flower shops.) However, nominal and real retail sales grew 3.0 percent on the year. Nonstore retailers and building material stores, consistent with our single-family housing outlook, continue to post the strongest year over year gains, with nearly all of the increase due to sheer volume rather than inflation. On the other hand, modest increases in electronics, health, clothing, and gasoline were mostly due to inflation.
Industrial production was also released during the week, increasing 0.4 percent in June, with gains in manufacturing and mining, while the utilities component was flat on the month.
U.S. Outlook
Import Price Index • Tuesday
Import prices softened in May, led lower by the third consecutive decline in imported petroleum prices. Ex-fuel, import prices were flat in May and up 0.8 percent over the year, a pullback from the five-year high reached in April. Export prices also slid amid broadly-based monthly deflation.
We expect another slide in energy prices to keep import prices flat for June. In the near-term, energy prices will likely continue to keep a lid on overall import price growth. Taking a longer-term view, our currency strategists' outlook for medium-term U.S. dollar weakness, if realized, would apply some modest upward pressure to nonfuel import prices, all else equal. With core inflation moving further away from the FOMC's two percent target, a reversal of the dollar's strength over the past few years could help halt this recent slide in core inflation.
Previous: -0.3% Wells Fargo: 0.0% Consensus: -0.2% (Month-over-Month)
Housing Starts • Wednesday
Housing starts once again disappointed in May, with single-family starts falling 3.9 percent and multifamily starts declining 9.7 percent. Permits also fell for both single- and multifamily, suggesting there is more at play than statistical noise. With builder confidence near cycle-highs, price gains steady and inventory historically low, the drop in single-family permits is perplexing.
Starts are still running 3.2 percent ahead of their year-ago pace through May, with single-family accounting for all of the gain. Worker shortages may be a growing issue, with the number of single-family homes authorized but not started rising 4.0 percent in May and surging 14.7 percent over the past year. Construction employment was up 3.1 percent year-over-year in June, down from a cycle-high of 6.1 percent in late 2014, and at 1.5 percent the threemonth annualized rate for construction hiring suggests limited near-term momentum.
Previous: 1.092M Wells Fargo: 1.173M Consensus: 1.160M (Annualized Rate)
Leading Economic Index • Thursday
The Leading Economic Index (LEI) rose for the ninth consecutive month in May. The interest rate spread, ISM new orders and consumer expectations all helped drive the index higher. Building permits were the lone drag on this indicator of future economic activity. Another solid monthly gain helped push the six-month annualized change to a two-year high.
The LEI is a key input into our preferred recession forecasting model, which produces the probability of a recession in the next six months. The recent run of solid readings from the LEI has pushed the probability of a recession in the next six months down to very low levels. We anticipate another gain in the LEI in June. If realized, this should produce a model result that suggests the probability of a recession in the second half of this year remains low.
Previous: 0.3% Wells Fargo: 0.4% Consensus: 0.4% (Month-over-Month)
Global Review
Global Economy Shows Further Signs of Improvement
- Eurozone industrial production was higher than the consensus estimate with an increase of 1.3 percent increase in May after an increase of 0.3 percent in the previous month.
- The central bank of Canada this week decided to increase its overnight interest rate by 25 basis points. The bank justified its move by recognizing the improvement in the global economic landscape as well as an improving Canadian economy.
- In Mexico, industrial production was up 0.1 percent in May, month on month, and by 1.0 percent on a year-earlier basis thanks to improvements in construction, public utilities and mining output while manufacturing output was down.
Eurozone Industrial Activity Gives Credence to Tightening Talk
As expected, Eurozone industrial production was higher than consensus estimates with an increase of 1.3 percent in May after a 0.3 percent rise in the previous month. This was the first time we had three consecutive positive prints for Eurozone industrial production since the second half of 2013 and speaks to the improving production environment in the region today. Furthermore, this strong increase means that it is not only Germany and France (which released strong industrial production prints last week, 1.2 percent and 1.9 percent, respectively) are doing better, but confirms that the rest of the region has also joined the club, which is positive for Eurozone economic growth as well as for global economic activity.
Canada's Central Bank Joins the Few
As expected, the Bank of Canada this week decided to increase its overnight interest rate by 25 basis points, the first change in interest rates since June 2015 when it lowered its rate to 0.50 percent. The bank justified its move by recognizing the improvement in the global economic landscape as well as an improving Canadian economy. Furthermore, the bank indicated that although inflationary pressures have abated somewhat they expect this to be temporary and see inflation returning to "close to 2 percent by the middle of 2018."
At the same time, the bank is expecting economic growth to actually slow-down from current rates with the economy's output gap closing by the end of this year. According to the central bank, the economy is expected to grow 2.8 percent in 2017 and only 1.6 percent in both 2018 and 2019.
Latin American Largest Economies
In Mexico, industrial production was up 0.1 percent in May, month on month, and by 1.0 percent on a year-earlier basis thanks to improvements in construction, public utilities and mining output while manufacturing output was down in the month. However, the good news was that the weakness in manufacturing output was not due to weakness in automobile production but in other sectors. We have also seen improvements in automobile exports to the United States market, which also points to improving automobile demand north of the border during the second quarter after a very weak first quarter. The bad news was that the weakest sectors are closely linked to domestic consumption, which has started to weaken in the second quarter of the year. In Brazil, political turmoil remains prevalent for a while longer with Judge Moro's decision to convict ex-president Lula da Silva to an almost 10 year prison term on corruption charges linked to the Lava Jato influence peddling case. Furthermore, the May economic activity index dropped 0.5 percent after increasing 0.2 percent in April, month over month, while increasing 1.4 percent on a year-earlier basis after a decline of 1.7 percent year-over-year in April. The Brazilian economy continues to be exposed to the whims of the political system.
Global Outlook
China GDP • Monday
China will release June data on retail spending, industrial production and fixed asset investment on Monday. But the highlight of the data barrage on Monday will be the GDP data for the second quarter, which will subsume the monthly data for June.
Economic growth in China has clearly downshifted since the beginning of the decade. That said, the year-over-year rate of real GDP growth has stabilized between 6.5 percent and 7.0 percent over the past few years. Chinese authorities have shown an adroit ability in recent years to tweak macroeconomic policies in an attempt to stabilize GDP growth. By and large, they have succeeded in this objective. We are in line with the consensus forecast, which expects that the year-over-year rate of real GDP growth in China ticked down to 6.8 percent in Q2-2017 from 6.9 percent in the first quarter.
Previous: 6.9% Wells Fargo: 6.8% Consensus: 6.8% (Year-over-Year)
U.K. Retail Sales • Thursday
Real GDP growth in the United Kingdom has been driven largely by consumer spending in recent years. However, growth in real retail spending has weakened recently, which has led to deceleration in the British economy this year. The culprit behind the slowdown in consumer spending appears to be higher inflation, spurred by depreciation of the British pound in the wake of last June's Brexit referendum, which has eroded growth in real disposable income. Data for retail spending in June are on the docket on Thursday.
Speaking of inflation, data on CPI inflation in June will print on Tuesday. The year-over-year rate of CPI inflation rose to a four-year high of 2.9 percent in June, well above the Bank of England's target of 2 percent. Although there are some members of the Monetary Policy Committee who would like to raise rates, most members believe that inflation will drift lower in coming months due to the sluggish pace of economic growth at present.
Previous: -1.6% Consensus: 0.5% (Month-on-Month)
Canada Retail Sales • Friday
After slipping into a mild recession in early 2015, real GDP growth in Canada has come roaring back. This rebound in the Canadian economy has been driven, at least in part, by strong growth in consumer spending. To wit, the value of retail sales in Canada was up 7.0 percent on a year-ago basis in April. Data on retail spending in May are slated for release on Friday.
The Bank of Canada conducts monetary policy in order to keep CPI inflation in a range of 1 percent to 3 percent. At only 1.3 percent, the current rate of CPI inflation is near the bottom of this range. As described on page 4, however, the Bank of Canada (BOC) decided this week to raise its main policy rates by 25 bps, its first rate hike in seven years. Policymakers argued that above-potential economic growth will eventually cause the inflation rate to move higher. CPI inflation data for June are also on the docket on Friday.
Previous: 0.8% Consensus: 0.3% (Month-over-Month)
Point of View
Interest Rate Watch
Closer to Neutral
Fed Chair Yellen's mid-year economic testimony was slightly more dovish than expected, helping drive bond yields lower and equity prices higher. One key takeaway is the federal funds rate is closer to neutral than earlier thought. Yellen cautioned the neutral rate would rise over time, as more of the recovery broadens. The process is proving slower than expected, as evidenced by the continued underperformance of retail sales and inflation.
June's disappointing retail sales are a real head scratcher, as employment, income and consumer confidence all should support increased spending. The data may simply reflect that government statistics often have difficulty incorporating massive structural shifts like we are currently seeing to online retailing. The slew of store closings has also likely depressed both prices and retail sales – which are reported in nominal terms. Merchandise is being liquidated throughout the supply chain and goods destined for retailers are undoubtedly finding their way to off-price brick-and-mortar and online merchants.
As the Fed is so fond of saying, the lack of inflationary pressures is in all likelihood transitory. The economy is almost certainly at or near full employment and even 2 percent real GDP growth will ultimately drive wages and prices higher. The process is taking much longer, however, and a growing number of Fed presidents and governors are now hinting the trajectory of future rate hikes may be more gradual.
Yellen's comments likely take a September rate hike off the table – which we had already done – and raise some doubts about a December move. There is an awful lot of time between now and December, however, and the economic and inflation environment are both likely to firm considerably by then.
There was little additional insight into the Fed's plans to reduce their balance sheet. While there are legitimate concerns about the Fed taking monetary policy to a place it has not gone before, the Fed plans to start slowly and proceed cautiously. We look for a September announcement and initial roll off in December.
Credit Market Insights
Large Consumer Credit Increase
Consumer credit rose by $18.4 billion in May, the largest increase of the year thus far. The increase represents a 5.8 percent increase at a seasonally adjusted annual rate. April's soft print was also upwardly revised. The May increase was led by a recovery in revolving credit, which rose by $7.4 billion. This marks the largest increase in revolving credit in 2017 and the second largest since June 2016. Nonrevolving credit continues to climb at a remarkable pace, while the level of revolving credit is close to its prerecession high.
Outstanding student loans continue its upward march, eclipsing $1.4 trillion dollars in the most recent reading. The level of outstanding motor vehicle loans has shown recent signs of stabilization, but remains elevated at $1.1 trillion.
This month's release also contained data on interest rates for various forms of consumer borrowing. On balance, interest rates ticked modestly higher; the interest rate on a 48-month new car loan, for instance, rose 15 bps from Q1 to 4.67 percent in May. Likewise, credit card rates continue to tick higher. Charge-off rates at commercial banks for all consumer loans, edged higher in May. But at 2.1 percent, charge-off rates are well below the rates seen leading up to the Great Recession. The Fed raising rates at its most recent meeting could create a headwind at the margin for consumers. A tight labor market and strong consumer confidence, however, should help offset the drag.
Topic of the Week
Dollar Outlook Shifts as Global Monetary Policy Starts to Converge
The U.S. dollar has had a challenging year, with losses of around 6 percent on a major trade-weighted basis yearto- date. Greenback weakness has primarily reflected shifting expectations for monetary policy both in the United States and in other key developed economies.
In the United States, key inflation measures have slowed, economic activity has been restrained and prospects for growth supportive fiscal stimulus have receded, all of which have brought into question the degree to which the Federal Reserve might raise interest rates going forward. This represents a marked shift from the dollar outlook at the beginning of the year, when U.S. data were more robust, supportive fiscal policy was widely expected and the Federal Reserve was signaling a faster pace of interest rate hikes.
Meanwhile, just as Fed rate expectations have been pared back, other key global central banks have moved toward a less accommodative policy bias. In particular, the Bank of Canada raised interest rates earlier this week, becoming the first major developed market central bank to do so after the Federal Reserve, while the European Central Bank and Bank of England have also hinted at the eventual reduction of policy accommodation. Accordingly, while we had expected monetary policy divergence (that is, wider U.S./global yield spreads) would be the key theme in 2017, the focus has instead shifted toward monetary policy convergence (narrower U.S./global yield spreads).
As a result of these shifting dynamics, we have gradually evolved our view over the course of this year from one of medium-term U.S. dollar strength to one of mediumterm U.S. dollar weakness. We now believe that the greenback's multi-year appreciation cycle—which began in mid-2011—peaked around the beginning of this year, and the greenback has now entered a multi-year depreciation cycle. Accordingly, our current view is for trend weakness in the U.S. dollar and trend strength in most foreign currencies over time.
The Weekly Bottom Line
U.S. Highlights
- Fedspeak took center stage this week. Fed Chair Yellen delivered prepared remarks to Congress, where among other things, she acknowledged the uncertainty as to when inflation would rise back toward its target.
- Taken together with Governor Brainard's comments, markets interpreted the tone as dovish, with long-term Treasury yields and U.S. dollar falling, while U.S. equities soared toward all-time highs.
- Both the CPI and retail sales reports came in below consensus, adding further downside risk to the pace of Fed hikes over the next year and a half.
Canadian Highlights
- The Canadian dollar gained more than a cent vis-à-vis its U.S. counterpart since mid-week as the Bank of Canada hiked interest rates for the first time since 2010 and indicated that more increases are likely in store.
- Hawkish statements and a solid economic outlook both suggest that another policy rate increase is coming soon – most likely in October. A more gradual pace of hikes is expected thereafter.
- Governor Poloz noted that the path forward will be 'data dependent', but with inflation forecast to remain soft through the remainder of this year, the pace of future hikes will likely hinge on the continued rotation of economic growth. Non-commodity investment and exports are the indicators to watch most closely.
U.S. - Soft Inflation Risks Delaying Fed Hike
Fedspeak took center stage this week with six members of the FOMC making public appearances. In what may be her last Congressional testimony as Fed Chair, Janet Yellen delivered prepared remarks and answered questions in both the House and Senate this week. She reiterated the Fed's narrative that the economy is healthy enough to withstand further rate increases and that the process of balance sheet reduction is expected to begin this year. That said, she did acknowledge the uncertainty as to when inflation would rise back toward its target, noting that a handful of past factors would pressure inflation down until they drop out of the annual calculation. Inflation numbers out this morning confirmed that price pressures remained subdued in June, with the softness casting some doubt as to the idiosyncratic nature of the recent loss in momentum (Chart 1).
The Chair elaborated on the neutral rate of interest, noting that it is currently low, necessitating patience as far as rate hikes. However, she suggested that the neutral rate would likely move higher towards the 3% mark as the temporary factors holding it down ease off, motivating additional rate hikes over the coming years. This marked a divergence from Governor Brainard, who suggested in her remarks this week that the neutral rate is "likely to remain close to zero in real terms over the medium term." Taken together, markets interpreted the comments as dovish, with long-term Treasury yields and U.S. dollar falling, while U.S. equities soared toward all-time highs. The latter were also buoyed by rising oil prices, on account of a bullish U.S. inventory report.
Yields and the dollar were further weighed down by a soft retail spending report with sales retreating in June, falling short of expectations for a modest gain (Chart 2). While the softer print leaves our second quarter consumption estimate still near 3%, the story is less upbeat as far as momentum heading into the third quarter with consumption on track to decelerate closer to the mid-2% mark. Together with the relatively broad-based weakness in discretionary spending categories, the poor spending performance leaves us somewhat puzzled – particularly given the continued strength in the labor market. On the whole, the combination of the weak CPI and retail sales reports adds some downside risk to the pace of Fed hikes over the rest of the next year and a half.
Still, we expect inflation pressures will begin to build through the remainder of the year, helped by an increasingly tight labor market. The labor market strength was reaffirmed by secondary data releases this week, with the JOLTS report indicating improved hiring and quit levels – the latter reflecting worker confidence – and upbeat worker compensation plans among small businesses in the NFIB survey. That said, the process of firming inflationary pressures is proving slower than expected.
Outside of the U.S., improving global growth appears to be emboldening other central banks to consider reducing stimulus. The Bank of Canada saw through soft inflation figures and raised its overnight lending rate this week for the first time in 7 years. Meanwhile, tightening talk has gained further traction at the Bank of England, and the European Central Bank looks to announce a taper schedule of its asset purchases later this year. Such convergence in monetary policy direction would help the Fed's interest rate normalization plans, but for now all eyes remain firmly on inflation.
Canada - Where to From Here?
Market moves this past week were dominated by the Bank of Canada's decision to hike its key policy interest rate by 25 basis points to 0.75% on Wednesday. The increase was largely expected by markets, but the hawkish tone of the statement and press-conference pushed the loonie up by more than a cent in anticipation of a faster pace of future rate hikes (Chart 1). Further supporting the Canadian dollar were soft U.S. data and higher oil prices, which rose by more than $2 U.S. per barrel as of Friday morning.
If there was a 'missing piece' going into Wednesday's monetary policy decision, it was inflation – which has been trending lower in recent months. This softness was attributed by the Bank of Canada to special factors such as electricity rebates. But, 'core' inflation measures, designed to provide a picture of the trend excluding such idiosyncratic factors, also weakened. Regardless, this was a departure from earlier communication that had suggested inflation was being held back by past economic shocks and should thus be near a turning point.
Regardless of what is driving current inflation, it is increasingly clear that the Bank of Canada will look through it. Governor Poloz likened relying on current inflation to guide monetary policy as "driving using only the rear-view mirror". Extending this metaphor further, we would argue that monetary policy 'driving' more resembles using a video game (or simulation), as his decisions rely on what models suggest inflation will do. While the economic backdrop generally supports gradual monetary tightening, there nevertheless would have been little harm in waiting slightly to begin increasing rates, were it not for the aggressive communication strategy to prep markets for Wednesday's decision.
Indeed, with another robust quarter of economic growth looking increasingly likely, and a broadening of growth drivers, emergency-level interest rates are no longer needed. In fact, the current tracking suggests that 2017 growth is likely to slightly outpace the Bank of Canada's upgraded forecasts (Chart 2). This suggests that the path forward is likely paved with further interest rate increases.
The key questions are therefore: how aggressive will the Bank of Canada be in removing monetary stimulus; and what factors could delay further interest rate increases? Given the healthy near-term growth outlook, the Bank will seek to remove the remainder of the 2015 policy rate cuts later this year, likely at its October meeting. Once that is accomplished, a more gradual pace is likely. We expect one 25 basis point hike every six months or so, aiming to balance support for an ongoing growth rotation while containing inflationary pressures.
Governor Poloz focused on 'data dependency' as guiding the path forward. The Bank of Canada is forecasting further deceleration in inflation in the near term. Making inflation unlikely to have much bearing on Poloz's thinking over the coming quarters, unless the deceleration is severe. More important will be the evolution of non-commodity business investment and export dynamics going forward. These will serve as important bellwethers for the durability of Canadian economic growth and any sustained weakness in these categories will likely give the Bank of Canada cause for concern.
Canada: Upcoming Key Economic Releases
Canadian Manufacturing Sales - May
Release Date: July 19, 2017
April Result: 1.1% m/m
TD Forecast: 1.0% m/m
Consensus: 0.7% m/m
The manufacturing renaissance underpinning the recovery in the goods sector is expected to continue into May with a forecasted 1.0% m/m increase in manufacturing sales. Underpinning our forecast is a strong rebound in motor vehicle shipments after a 3.7% decline last month, presaged by a sharp rise in auto exports while a further improvement in metal/mineral products should add to the headline strength. However, there are a few offsetting factors to consider - we expect a sizeable contraction in wood product shipments following the new softwood lumber tariffs and gasoline sales will be negatively impacted by falling prices at the pump. Due to an offsetting increase in core producer prices, we would look for volumes to be in line with the nominal print, which would leave real manufacturing sales growth at its strongest level since late 2014 on a year-ago basis.
Canadian Consumer Price Index - June
Release Date: July 21, 2017
Previous Result: 0.1% m/m
TD Forecast: 0.0% m/m
Consensus: 0.0% m/m
We look for June headline inflation to slip further to 1.1% y/y vs 1.3% y/y in May, reflecting unchanged prices on the month. The lift from energy prices on a year-ago basis is expected to turn to a drag, led by lower gasoline prices, while food price deflation should dissipate in line with rising agricultural prices. We expect continued strength in shelter costs as presaged by the ongoing acceleration in the new housing price index, while falling vehicle prices remains a downside risk. We look for more signs of stabilization in the core metrics of inflation (CPI common, trimmed mean and median), which averaged a cycle low of 1.3% y/y in May. However, a continued downward pull from lagged effects of slack cannot be ruled out.
Canadian Retail Sales - May
Release Date: July 21, 2017
April Result: 0.8% m/m; ex-auto: 1.5% m/m
TD Forecast: 0.3% m/m, ex-auto: -0.1%
Consensus: 0.4% m/m, ex-auto: 0.4%
Retail sales are forecast to advance by a moderate 0.3% m/m in May, led by a further pickup in motor vehicle sales. In contrast to the United States, we have yet to see any plateau in Canadian auto sales thus far in 2017 and there are indications that May might have been another record setting month. This will help to offset a sizeable drag from lower gasoline prices and housing related purchases and will leave ex-auto sales 0.1% lower on the month, though volumes should outperform the nominal print. Existing home sales in the Toronto region fell by roughly 25% in May following the introduction of new macroprudential regulations, which should constrain demand for furniture and other household furnishings. Elsewhere, we look for continued labour market gains (full time employment rose by 77k during the month) to support household spending in the near-term before the combination of higher interest rates and a more tepid housing outlook introduce a healthy cooling to the retail sector over the second half of the year.
Week Ahead Dollar Stumbles on Soft Inflation and Retail Sales Drop
US CPI and retail sales miss raise concerns on further Fed rate hikes
The US dollar is lower across the board after the release of the US retail sales and consumer price index (CPI) data on Friday. The CPI was unchanged from June and retail sales in the United States fell for the second month in a row. The Fed is confident that inflation is low due to temporary factors and anticipates that a strong labour market will lift inflation via wage increases. The disappointing data raises concerns about the U.S. Federal Reserve's plan of action in the second half of the year. The central bank is expected to raise rates at least once and start trimming its balance sheet before the end of 2017 but persistent soft inflation could derail those well laid plans.
Next week will kick off with the release of China's updated gross domestic product (GDP) calculation for the second quarter. The new methodology will include the contributions from health care, tourism and the so-called new economy. It is unclear how gradual the introduction of the new calculation will be with estimates calling for a 6.9 percent gain. China's National Bureau of Statistics will release the GDP quarterly data on Sunday, July 16 at 10:00 pm EDT.
UK inflation has accelerated this year in the aftermath of the Brexit vote. The drop in the pound has hit British households as the pace of inflation has outgunned wage growth, leaving real wage growth in negative territory for 2017. The Office for National Statistics will publish the British consumer price index (CPI) on Tuesday, July 18 at 4:30 am EDT. Inflation was 2.9 percent last month and analysts are forecasting a repeat of that print, but there is risk it comes at 3 percent.
Central banks appear to have coordinated their change in rhetoric to a more hawkish tone following the lead of the U.S. Federal Reserve in 2017. The Bank of Japan (BOJ) and the European Central Bank (ECB) are not expected to make big announcements this week, but rather make some remarks to prepare the market for eventual changes later in the year. The BOJ is likely to mention the improvement of economic fundamentals but with weak inflation the central bank is not anticipated to make any change to its stimulus program. The BOJ will release its monetary policy statement on Wednesday, July 19 near midnight EDT and hold a press conference on Thursday, July 20 at 2:30 am EDT. The ECB could tweak the language of its statement to signal a tapering of its bond buying program. Given the communication fails in the past from the ECB the central bank could cause a bigger reaction in the market. The ECB will publish the minimum bid rate on July 20 at 7:45 am EDT and President Mario Draghi will hold a press conference at 8:30 am EDT.
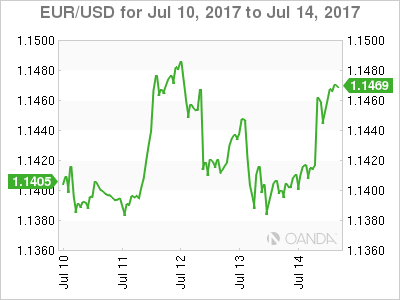
The EUR/USD gained 0.562 percent in the last five days. The single currency is trading at 1.1449 as a dovish Fed and disappointing economic indicators put downward pressure on the USD. Fed Chair Janet Yellen had two back to back days of testimonies before US Congress and the Senate. Although she did not stray far from earlier rhetoric this time the read was more dovish with less confidence on the growth trajectory of the US economy. The Fed Chair's comments and the drop in CPI and retail sales puts in question how much room the central bank really has to push through another rate hike. The lack of momentum of the US economy despite a solid job market could leave a balance sheet reduction as the only tool left in the Fed's bag.
Political uncertainty in Washington on health care reform and the escalating Russian probe has not helped the USD. Gold and the JPY have risen as safe havens for investors concerned on the ability of the Trump Administration to pass pro-growth legislation when its encumbered by political hurdles. Softer economic data is not a disaster for the USD, but combined with rising political risk will make the market pare back growth expectations going forward.
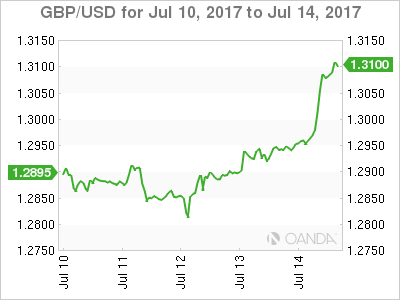
The GBP/USD gained 1.527 percent in the last five days. Cable is trading at 1.3078 as inflationary pressure might force the Bank of England (BoE) to hike soon at the same time the Fed is facing lack of inflation in the US complicating the path of further rate hikes. The currency pair started the week just below the 1.29 price level and was at weekly lows as the BoE deputy governor issues new Brexit warnings that thought to be Fed dovish comments started the GBP bounce.
Soft data in the US and expectations of the UK over performing in the same indicators with a strong retail sales and inflation data could propel the pound higher. Longer term the fog of Brexit continues to hang over the future of the UK economy with ratings agencies and the central bank concerned about what type of deal Britain can agree with the European Union.
Market events to watch this week:
Sunday, July 16
- 10:00 pm CNY GDP q/y
- 10:00pm CNY Industrial Production y/y
Monday, July 17
- 6:45 pm NZD CPI q/q
- 9:30 pm AUD Monetary Policy Meeting Minutes
Tuesday, July 18
- 4:30 am GBP CPI y/y
Wednesday, July 19
- 8:30 am USD Building Permits
- 10:30 am USD Crude Oil Inventories
- 9:30 pm AUD Employment Change
- Tentative JPY Monetary Policy Statement
Thursday, July 20
- Tentative JPY BOJ Outlook Report
- Tentative JPY BOJ Policy Rate
- 2:30 am JPY BOJ Press Conference
- 4:30 am GBP Retail Sales m/m
- 7:45 am EUR Minimum Bid Rate
- 8:30 am EUR ECB Press Conference
- 8:30 am USD Unemployment Claims
Friday, July 21
- 8:30 am CAD CPI m/m
- 8:30 am CAD Core Retail Sales m/m
*All times EDT
Weekly Market Recap – USD Ruined by US Data
EUR/USD challenges long term resistance
We had volatility on the EUR/USD this week, has rallied on Tuesday and reached the 1.1466 major static resistance. Continues to stay below this major upside obstacle after the last day's sell-off. Today has rallied after the United States data were sent to the public, unfortunately the high impact figures have come in worse than expected. The greenback was punished by the poor data, the USDX plunged much below the 95.45 previous low and 95.18 low, could decrease further in the upcoming hours because is very heavy.
A further USDX's drop will send the EUR/USD much higher in the upcoming days, the perspective is bullish on the daily chart.
Price rallied today and is pressuring the 1.1466 level again, we have a very strong confluence between the median line (ml) with the mentioned static resistance. The false breakout above the median line (median line), the sliding line (sl) and above the 1.1466 level signalled and exhaustion, but the perspective remains bullish as long in trading above the 1.1376 static support.
GBP/USD crucial breakout in play
Price resumed the upside movement and has managed to jump much above the upper median line (UML) of the major descending pitchfork. Is trading above the 1.3047 previous high and above the 150% Fibonacci line (ascending dotted line) and looks determined to approach and reach the upside line of the up channel, where he could find temporary resistance.
Was expected to increase after the failure to reach and retest the 1.2798 static support and the first warning line (wl1) of the ascending pitchfork. The breakout needs confirmation, we could have a buying opportunity if the rate will come back down to retest the upper median line (UML). Is premature to say that we have a valid breakout because we had other false breakout in the past.
USD/CAD registered an unbelievable drop
The Loonie registered an amazing rally against its major rival (USD), the USD/CAD continues to drop after the poor US data and could reach fresh new lows because looks unstoppable. USD/CAD dropped more than 260 pips since Wednesday and ignored major support levels. Was driven lower by the fundamental factors, even if it was a little oversold at the start of this week.
The rate plunged much below the median line (ML) of the major descending pitchfork, the third warning line (wl3) of the minor ascending pitchfork and below the 1.2678 static support, the next downside target will be at the lower median line (lml) of the minor descending pitchfork.
AUD/USD ignored major resistance levels
AUD/USD edged higher aggressively and ignored all resistance levels, now is very close to hit the major static resistance from 0.7835 swing high. Was almost to reach also the upper median line (uml) of the minor ascending pitchfork, where he could find resistance again.
The pair has managed to breakout from the major extended symmetrical triangle and above the 0.7755 long term static resistance. We'll see how long this upside momentum will be and if the bulls will have more energy to push the rate much higher in the upcoming days.
BoC Acts as the Fed’s Dancing Mate – Will Others Join the Party?
At the start of the year, the Federal Reserve was the only major central bank engaging in as well as communicating that it remains on a path of policy normalization. At that point in time, the Fed had already hiked rates twice since last reducing them back in 2008, while it has delivered two additional rate increases so far during the year. The Bank of Canada's decision to raise rates for the first time in roughly seven years could be a sign that a hiking trend is to follow amid signs for an improved outlook for the global economy.
After the decision by the BoC to raise its target for the overnight rate by 25 bps to reach 0.75% on July 12, the Canadian dollar rose versus its US counterpart to touch its highest in nearly thirteen months. Specifically, dollar/loonie fell to as low as 1.2680 (a fall reflects a strengthening loonie). The greenback later recovered part of its losses but still finished the day lower by a sizable 1.3%.
It is noteworthy that the Canadian dollar experienced significant gains in the weeks before the BoC decision. The rise in that period was in part attributed to the imminent rate increase by the Canadian central bank. In other words, the rate hike was already almost completely priced in by the markets before it officially materialized. It is thus interesting to examine what caused the loonie's surge on the day of the announcement - year-to-date, the loonie advanced 5.5% relative to the greenback.
In its accompanying statement, the Bank interpreted weak inflation data to be non-persistent, expressing that inflation is on track to reach its 2% target, as the Bank's Governor, Stephen Poloz, maintained an overall hawkish tone in his message. Moreover, the Bank expressed content for the country's economic recovery, while Poloz acknowledged the lag between monetary policy actions and future inflation (i.e. that it takes time for monetary policy decisions to have their intended effect on inflation). Therefore, it is clear that the loonie's jump higher was spurred by market participants expecting further hiking soon. The BoC is next scheduled to make a monetary policy decision announcement on September 6.
When asked about the credit-fueled boom prior to the 2007-09 financial meltdown, Chuck Prince, the then Citigroup chairman and chief executive, famously said that "as long as the music is playing, you've got to get up and dance". The BoC has just joined the dance in the party that was started by the Federal Reserve. This begs the question: Will other central banks soon join the party? According to financial market analysts, there is some reasoning for central bankers to follow through on the actions of their peers, especially if their currencies are moving in a direction that is detrimental for their respective economies.
It is also of interest that similar to Poloz, the European Central Bank head, Mario Draghi, recently played down not so strong inflation figures, attributing them to global factors. Back then, those comments by Draghi led to the euro rallying relative to other majors. Soon after, Bank of England officials, including Governor Mark Carney, followed suit with hawkish comments.
A Wall Street Journal report hitting the markets yesterday stated that the ECB is likely to signal in its September meeting that its asset purchase program will be gradually scaled down starting next year. In the case of the BoE, recent not-so-upbeat economic data, combined with political uncertainty (predominantly due to Brexit), might not allow its decision makers to enter a phase of normalization as soon as they would have otherwise wished. As of now, the Bank of Japan seems to be standing as the odd one out. Its Governor, Haruhiko Kuroda, delivered a broadly dovish message after the Bank's last meeting on June 16, saying that "there's some distance to achieving (the Bank's) 2% inflation" target. The BoJ maintaining its ultra-loose monetary policy at a time when others are either hiking rates or signaling readiness to normalize policy, is expected to add downside pressure on the Japanese currency over the short- to medium-term.
For history's sake, Chuck Prince's stance backfired, leaving Citigroup with a sizable exposure to the subprime mortgage market as the most damaging recession since the Great Depression of the late 1920s-early 1930s unfolded. It remains to be seen whether the world's central banks will face a similar faith; for the time being though such a scenario seems unlikely.