
Sample Category Title
USD/CHF Daily Outlook
Daily Pivots: (S1) 0.9609; (P) 0.9654; (R1) 0.9680; More...
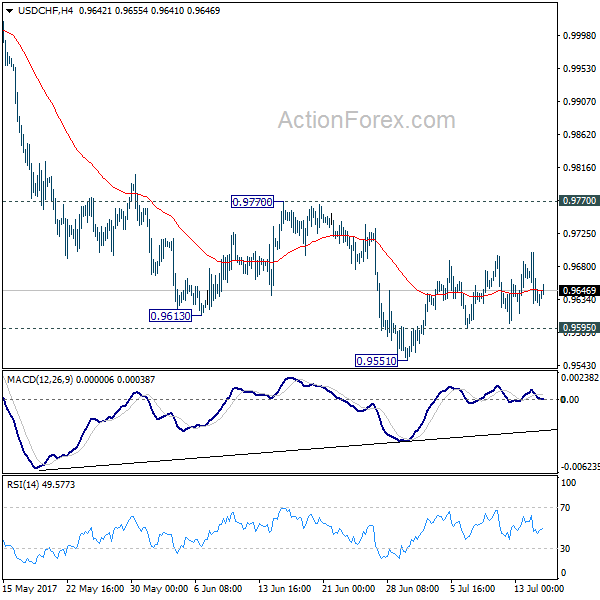
Intraday bias in USD/CHF remains neutral as consolidation from 0.9551 continues. In case of another rise, upside should be limited by 0.9770 resistance and bring fall resumption. Below 0.9595 minor support will turn bias to the downside. Break of 0.9551 will extend the whole fall from 1.0342 and target 0.9443 key support level next. At this point, we'd expect strong support from there to bring rebound. Meanwhile, firm break of 0.9770 will indicate near term reversal, on bullish convergence condition in 4 hour MACD.
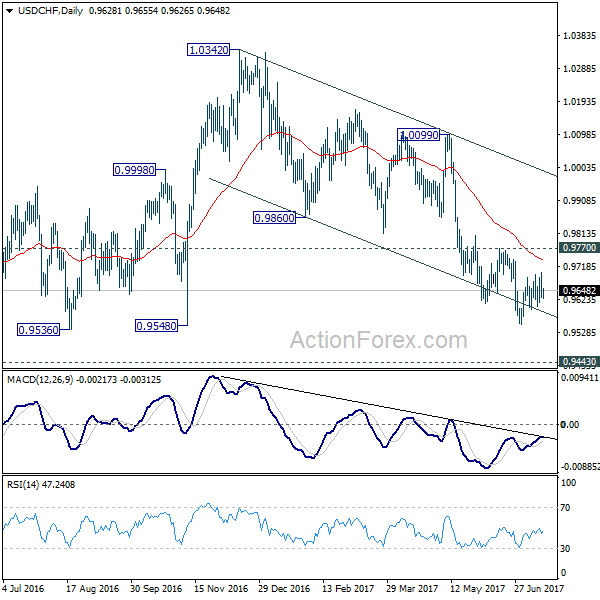
In the bigger picture, USD/CHF is still bounded in medium term range of 0.9443/1.0342 for the moment. Consolidative trading would likely continue and medium term outlook remains neutral. Break of 1.0342 key resistance is needed to confirm underlying bullish momentum in the pair. Meanwhile, downside attempts should be contained by 0.9443 key support level. However, sustained break of 0.9443 will carry larger bearish implication and target 0.9 handle.
Currencies: Dollar Struggles, But EUR/USD Doesn’t Set New Correction Top
Sunrise Market Commentary
- Rates: Wait-and-see ahead of Thursday's ECB?
Today's thin eco calendar probably won't impact trading. Q2 earnings reports could influence markets via risk sentiment. Overall, we expect trading to remain confined to tight ranges ahead of Thursday's ECB meeting. Rumours could cause some volatility, but shouldn't have a lasting impact. - Currencies: Dollar struggles, but EUR/USD doesn't set new correction top
Soft US data kept the dollar in the defensive on Friday, but EUR/USD wasn't able to overcome the 1.1489/1.15 resistance area. Are investors turning a bit more cautions on additional euro longs going into Thursday's ECB policy meeting?
The Sunrise Headlines
- WS closed with gains as Fed hike expectations were lowered (S&P500 +0.47%). Asian trading opened with an uptick on this positive sentiment. Chinese equities initially sold off but recovered, together with the other Asian markets, after the better than expected China data. Japan has an official holiday today.
- China's GDP increased 6.9% in Q2 Y/Y (1.7% Q/Q), higher than the 6.8% estimate and matching the Q1 growth pace, thanks to robust industrial output, retail sales and exports. A slowdown is expected in the next quarters.
- Brexit Secretary David Davis and EU's Michel Barnier are set to launch a first round of negotiations on Britain's withdrawal from the EU today. Three more weeks of talks will follow from late August until early October.
- The US senate majority leader announced that he's postponing the debate on the controversial Republican health care bill as one of the potential Senate backers, John McCain, will be recovering from unexpected surgery this week.
- The eco-calendar is wafer-thin today with the only data of note being the EMU final June CPI and the US July Empire manufacturing. There will be no Fedspeak this week as the blackout period kicks off today
Currencies: Dollar Struggles, But EUR/USD Doesn't Set New Correction Top
Dollar holds near the recent lows
US CPI was marginally softer than expected last Friday. Retail sales showed quite a substantial miss. US yields and the dollar declined as markets positioned for slower Fed-policy normalisation. EUR/USD rebounded, but a but a real test of the recent top (1.1489) didn't occur. The pair closed the day at 1.1470. USD/JPY was hit harder, even as US equities reacted in a positive way. The pair finished the day at 112.53.
China Q2 GDP printed stronger than expected at 6.9 Y/Y (6.8% was expected) this morning. June retail sales and industrial production also beat consensus by a substantial margin. Mainland Chinese stock markets were under pressure though on concerns of more financial regulation, but sentiment improved after the publication of the data. USD/JPY (112.60 area) tries to find a bottom after Friday's losses. AUD/USD is holding stable in the low 0.78 area after last week's impressive gains. The kiwi dollar (NZD/USD 0.7330) lost slightly ground on RBNZ comments that a lower NZD would help rebalancing growth. EUR/USD (1.1460) is holding within reach of the recent top, but no test had occurred yet.
EMU June final CPI is expected to be confirmed at 1.3%Y/Y today. This should have little impact on markets even if ongoing soft inflation might ease markets' expectations that the ECB will already give concrete hints on a scaling back of policy stimulation at this week's policy meeting. The prospect for a cautious ECB might slow further euro gains after the recent rally. In the US, the Empire manufacturing survey is expected to ease from a strong 19.8 to a still solid 15.0 in July. The focus for (FX) trading is on price data rather than on activity data. So, even a good report probably won't help the dollar much. This week, the US earnings season will come in full swing. Of late, the dollar, including USD/JPY was more sensitive to price data/yields than to the US equity performance. So, it's not evident that good US earnings will be a big help for the dollar
The dollar remained in the defensive last week. Mediocre US wage growth in the payrolls, Yellen's focus on the recent setback in inflation and soft eco data made markets doubting the pace of future Fed normalisation and weighed on the dollar. Especially USD/JPY looks quite vulnerable. On the other hand, EUR/USD didn't set a new short-term top after Friday's disappointing US data. We don't draw any firm conclusions yet. Is this an indication that already quite some bad news for the dollar/good news for the euro is discounted at current levels. We don't row against the tide yet, but look out whether the 1.1489/1.15 resistance holds.
Technical picture: USD looking for a bottom
A combination of hawkish ECB comments and soft US data pushed EUR/USD above the 1.1300/66 resistance area end June. The payrolls were not good enough to trigger a sustained USD rebound. Next resistance in the 1.15 area is looming. LT-correction tops stand at 1.1616/1.1714. A break would end the long consolidation period that followed the sharp decline of EUR/USD in 2014/early 2015. Such a key area will be difficult to break for now. A return below the 1.13 area would be a first indication of a loss in upside momentum. EUR/USD 1.1119/10 is the next important support.
The USD/JPY rally ran into resistance in early May and the pair returned lower in the 108.13/114.37 range. The post-Fed USD rebound pushed the pair above the 112.13 correction top, but follow-through gains remain modest. USD/JPY 114.37 resistance was tested, but for now the test is rejected. This at least suggests a pause in the recent USD/JPY uptrend. We stay cautious on USD/JPY long positions despite the recent decent performance.
EUR/USD: soft US data keep pair well supported, but no sustained break higher yet
EUR/GBP
Cable breaks above 1.3000/50 resistance
There was hardly any UK specific news to guide sterling trading today. There were plenty of press articles on the UK accepting the principle of a financial settlement, but the debate had no impact on sterling trading. EUR/GBP initially held an extremely tight sideways range around the 0.88 pivot. Late in the session, cable clearly outperformed EUR/USD after disappointing US eco data. EUR/GBP closed the session at 0.8754. Cable finished the week strong and closed above the 1.3050 resistance.
Overnight, Rigthmove House prices rose 0.1% M/M and 2.8% Y/Y. There are no other important UK eco data today. The focus will therefore be on the next episode in the Brexit negotiations that will start today. Of late Brexit wasn't a big issue for sterling trading. If there is no substantial progress in the Brexit-talks and if more division occurs within the UK conservative party, the recent sterling rebound could slow.
From a technical point of view, EUR/GBP recently set a minor top north of 0.8854/66 resistance (2017 top) and temporary broke below the 0.89 barrier but the move finally fell prey to profit taking (sterling short squeeze). A break below 0.8720 would suggest that upside momentum is easing. For now, we see the current sterling rebound as technical in nature and we don't expect a sustained rebound. Even so, we look to how the technical break in cable turns out. We don't row against the ST positive sterling tide yet
EUR/GBP topside test rejected, for now
USD/JPY Daily Outlook
Daily Pivots: (S1) 111.98; (P) 112.78; (R1) 113.30; More...
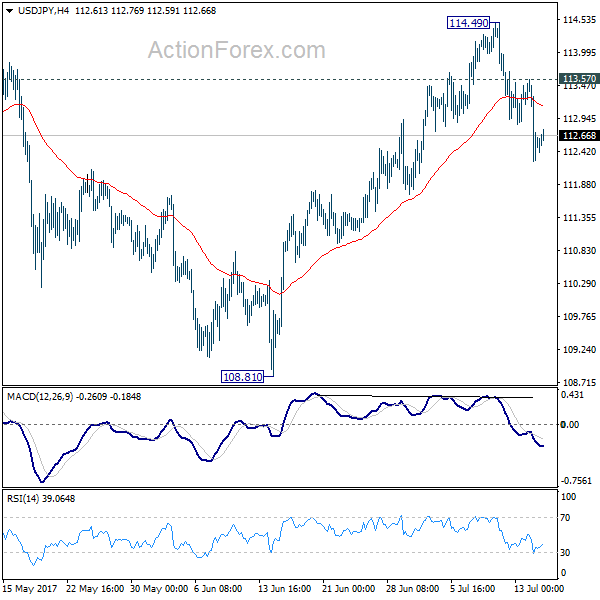
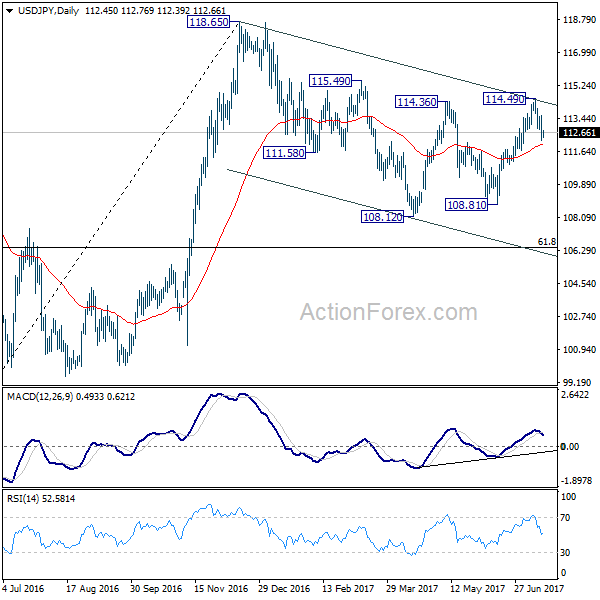
Intraday bias in USD//JPY remains on the downside for 55 day EMA (now at 112.03). The rejection from 114.36 resistance suggests that whole correction from 118.65 is possibly still in progress. Sustained break of 55 day EMA will pave the way to 108.12 and below. On the upside, above 113.57 minor resistance will turn focus back to 114.49 resistance instead.
In the bigger picture, the corrective structure of the fall from 118.65 suggests that rise from 98.97 is not completed yet. Break of 118.65 will target a test on 125.85 high. At this point, it's uncertain whether rise from 98.97 is resuming the long term up trend from 75.56, or it's a leg in the consolidation from 125.85. Hence, we'll be cautious on topping as it approaches 125.85. If fall from 118.65 extends lower, down side should be contained by 61.8% retracement of 98.97 to 118.65 at 106.48 and bring rebound.
Central Bank Events to Dominate the Week, Brexit Talks Round Two Starts
The forex markets are pretty steady today with Japan on holiday. Upbeat economic data from China didn't trigger much reactions. Traders are having their mind on the upcoming central bank events in the week, most notably ECB rate decision and press conference. In addition, there will be quite a number of key economic data to watch including UK CPI, Australia employment and Canada CPI. As for today Eurozone CPI final for June will be released. Canada will release international securities transactions while US will release Empire State manufacturing index. Also, some attention will be on EU and UK as the second round of Brexit negotiations starts.
China GDP grew 6.9% in Q2.
Released from China, GDP expanded 6.9% yoy in Q2, same pace as the prior quarter but above consensus of 6.8%. Economic activities in June continued to improve. Industrial production growth accelerated to 7.6% yoy in June, beating consensus of and May's 6.5%. Retail sales expanded 11% yoy in June, up from 10.7% a month ago. The market had anticipated mild deceleration to 10.6%. Fixed asset investment in urban areas grew 8.6% yoy in the first half of the year, same pace as in the first five months of the year. The government acknowledged that the country's economy continued to improve. It appears that the country's growth is on track to meet the government target of "around 6.5%".
In his first address at the National Financial Work Conference, which is held once every five years, over the weekend, Chinese President Xi Jinping affirmed that the PBOC would play a stronger role in defending against risks, calling for more work on safeguarding the financial system and modernizing its regulatory framework. Interestingly, the word "risk" appeared 31 times in the meeting note, followed by "regulation", which appeared 28 times, signaling that implementation of "regulations" to prevent financial system "risks" is the key direction of the government's policy.
More in China Watch - 2017 Growth Target On Track, Xi Commands To Prevent Risks And Tighten Regulations
Brexit negotiation round 2
The second round of Brexit negotiation starts today in Brussels. UK Brexit Secretary David Davis said ahead of the week long meeting that "we made a good start last month, and this week we'll be getting into the real substance." He noted that "protecting the rights of all our citizens is the priority for me going into this round and I'm clear that it's something we must make real progress on." There will be working groups focusing on three areas, including citizen's rights, the divorce bill and other loose ends. Another group will focus on the border of Ireland. Three more weeks of talks will be held till early October. By that time, EU chief negotiator Michel Barnier would hope to show "significant" progress to EU leaders to approve moving the negotiations to trade agreements.
Central bank activities to be main focuses ahead
There are some important central bank events ahead in the week. Of most attention is the ECB meeting on Thursday. President Mario Draghi would likely add more hawkish flavor in the meeting statement. Yet, it remains a 50-50 chance over whether the policymakers would decide to drop the forward guidance on QE (e.g.: the ECB is ready to extend size and/or duration of the current bond purchases of 60B euro/ month). Ahead of it, the central bank would release the quarterly Bank Lending Survey on Tuesday.
RBA minutes would be released on Tuesday. Recall that the market dumped Aussie instantly after the July meeting as the central bank failed to deliver a more hawkish monetary policy stance. However, the weakness was short-lived and Aussie jumped last week on strong iron ore prices. The upbeat Chinese dataflow should also give Aussie a boost as China is the world's biggest consumer of iron ore and the largest importer of Australia's iron ores.
BOJ would be meeting on Thursday (Japan time). There are talks that BoJ could once again upgrade growth forecasts. That's a sensible expectation based on recent upbeat economic assessments. Nonetheless, BoJ would also be lowering inflation forecasts again as recent readings remained sluggish. Recent surge in global bond yields triggered BoJ to offer to buy an unlimited amount of JGBs, earlier in July. That's a move under the Yield Curve Control framework to hold long term interest rate near zero. BoJ might provide some comments on the operations too.
In addition to central activities, there are some key economic data to watch. New Zealand CPI; Australia employment; UK CPI; German ZEW, Canada CPI and retail sales will also be closely watched.
Here are some highlights for the week ahead:
- Tuesday: New Zealand CPI; RBA minutes; UK CPI, PPI, house price index; German ZEW; US import prices, NAHB housing index
- Wednesday: Canada manufacturing shipments; US housing starts and building permits
- Thursday: Japan trade balance, BoJ; Australia employment; Swiss trade balance; German PPI; Eurozone current account, ECB; US jobless claims, Philly Fed survey, leading indicators
- Friday: UK public sector borrowing; Canada CPI, retail sales
USD/JPY Daily Outlook
Daily Pivots: (S1) 111.98; (P) 112.78; (R1) 113.30; More...
Intraday bias in USD//JPY remains on the downside for 55 day EMA (now at 112.03). The rejection from 114.36 resistance suggests that whole correction from 118.65 is possibly still in progress. Sustained break of 55 day EMA will pave the way to 108.12 and below. On the upside, above 113.57 minor resistance will turn focus back to 114.49 resistance instead.
In the bigger picture, the corrective structure of the fall from 118.65 suggests that rise from 98.97 is not completed yet. Break of 118.65 will target a test on 125.85 high. At this point, it's uncertain whether rise from 98.97 is resuming the long term up trend from 75.56, or it's a leg in the consolidation from 125.85. Hence, we'll be cautious on topping as it approaches 125.85. If fall from 118.65 extends lower, down side should be contained by 61.8% retracement of 98.97 to 118.65 at 106.48 and bring rebound.
Economic Indicators Update
| GMT | Ccy | Events | Actual | Forecast | Previous | Revised |
|---|---|---|---|---|---|---|
| 23:01 | GBP | Rightmove House Prices M/M Jul | 0.10% | -0.40% | ||
| 2:00 | CNY | Retail Sales Y/Y Jun | 11.00% | 10.60% | 10.70% | |
| 2:00 | CNY | Fixed Assets Ex Rural YTD Y/Y Jun | 8.60% | 8.50% | 8.60% | |
| 2:00 | CNY | Industrial Production Y/Y Jun | 7.60% | 6.50% | 6.50% | |
| 2:00 | CNY | GDP Y/Y Q2 | 6.90% | 6.80% | 6.90% | |
| 9:00 | EUR | Eurozone CPI M/M Jun | 0.00% | -0.10% | ||
| 9:00 | EUR | Eurozone CPI Y/Y Jun F | 1.30% | 1.40% | ||
| 9:00 | EUR | Eurozone CPI - Core Y/Y Jun F | 1.10% | 1.10% | ||
| 12:30 | CAD | International Securities Transactions (CAD) May | 9.78B | 10.60B | ||
| 12:30 | USD | Empire State Manufacturing Jul | 15 | 19.8 |
The Riksbank Argued That Growth Is Strong
Market Movers Today
It is a very quiet day in terms of data releases with the only figure due for release being the US Empire manufacturing PMI. Consensus estimates a decline but it should not go down to the levels seen in April and May this year.
Later this week, all eyes will be on the ECB meeting, where we expect it to remove its readiness to increase QE in size (but to keep the flexibility in terms of duration) and to have discussed tapering after President Mario Draghi rejected such discussions at the latest meeting in June. In our view, a tapering discussion will be in line with the latest communication from Draghi, that in a situation where the economy continues to recover, monetary policy tightening could be needed in order to keep the policy stance ‘broadly unchanged'. We still believe the ECB will continue QE but at a reduced pace of EUR40bn per month in H1 18.
The minutes from the Riksbank meeting in July are due to be released Tuesday and could attract additional attention as the Riksbank's statement deviated from the communication among global central banks by not including any signs of hawkishness. The Riksbank argued that growth is strong and inflation is approaching 2%, but that continued expansionary policy is needed to stabilise inflation at around 2%. This is very different from the thinking among global central banks that strong growth today will translate into higher wage pressure later.
Selected Market News
This morning's release of the Chinese GDP growth figure for Q2 showed grow target. The retail sales figure for June was up 11.0% y/y, consistent with the past couple of years' development, while industrial production increased 7.6% y/y, which was higher than consensus of 6.5%. The improvement at the end of the quarter is somewhat in line with the PMI data for June, which showed a small increase and thereby fewer downside risks. That said, most of our preferred leading indicators pointed to a weaker cycle in H2, implying that official data should be taken with a pinch of salt, in our view.h of 6.9% in line with the government's
On Friday, we got some weak US data including CPI, which declined to 1.6% y/y in June from 1.9% y/y in May whereas CPI core inflation was unchanged at 1.7% y/y. More surprising was the 0.1% m/m decline in the retail sales control group in June, as consensus had estimated a 0.3% m/m increase. Related to this, the University of Michigan consumer confidence for July showed that consumer sentiment is still upbeat but not as much as previously, as the figure was down to 93.1 from 95.1, which is the lowest since October 2016 (the lowest since Donald Trump won the election). Finally, manufacturing production was up 0.2% m/m in June after declining 0.4% m/m in May, implying the figure rose 1.4% in Q2, which was not as strong as suggested by very strong ISM (Markit PMI was better at capturing the development).
The Week Ahead: Draghi’s Turn To Drag The Euro?
Last week the greenback was the biggest loser among all major currencies. The dollar index slipped to a 10-month low, while the Euro, the Pound, the Loonie and the Aussie all posted new 2017 highs.
The dollar has been falling since the beginning of 2017 despite the two rate hikes that occurred in March and June, and the many hawkish comments from FOMC members. Part of the blame falls upon the delay of President Trump's economic agenda. However, most recently it was the poor economic data that led investors to question the trajectory and speed of interest rates hikes.
Janet Yellen's testimony to Congress on Wednesday and Thursday did not help the dollar either. She did not seem confident that inflation is on the right path and Friday's flat consumer price index raised concerns that the Fed may be done with hiking rates this year. U.S. retail sales figures added salt to the wound after recording the biggest drop in more than a year in May falling by 0.3%. The sluggishness in consumer spending, wage growth and inflation will likely to worry Fed officials. Furthermore, if the weakness persists in the next couple of month, it will prove that the slowdown in the economy is not due to transitory factors but probably structural problems. Until data takes a U-turn, dollar bulls will remain reluctant to jump in and the dollar weakness may resume in Q3.
Next week investors will shift their focus to the European Central Bank and Bank of Japan. It has been almost three weeks since Mr. Draghi said that “Deflationary forces have been replaced by reflationary ones.” His confidence and bullish assessment of the euro zone recovery sent the Euro above 1.13 and despite the ECB officials attempts to dampen investors' expectations over tightening policy the Euro still appreciated by more than 2.5% since 27 June.
I think Mario Draghi will choose his words more carefully when the ECB meets on Thursday. The last thing he wants is a strong Euro and tightened financial conditions for now. Since no changes are expected on current monetary policy the tweaks in the statement and Draghi's tone are all what matters to traders. It is a complicated process to start normalizing policy without disrupting markets, and so while the ECB wants to prepare investors for gradual wind-down of asset purchases, policy makers are likely to hint that rate hikes will remain low for a prolonged period. However, I prefer buying the Euro on dips then selling on rallies with end year target around 1.18.
The dollar's weakness drove Sterling to a 10-month high to trade above 1.31 for the first time this year. The pound also found support from BoE's Ian McCafferty who said the central bank should consider unwinding its 435-billion-pound quantitative easing program earlier than planned and that he's looking to vote for a rate rise again in August. It seems that monetary policy is having more weight than the Brexit talks; if Tuesday's inflation figures from the U.K. surprise to the upside, expect GBP to continue rallying. However, traders should also keep a close eye on Brexit negotiations which are going to resume on Monday.
China's GDP release on Monday will be monitored very closely by Aussie traders. Markets are expecting a 1.7% rise in Q2 from 1.3% in Q1. The RBA minutes are scheduled for release on Tuesday followed by the employment report on Thursday. It requires another set of positive reports to further widen the differentials in bond yields; however, without a shift in monetary policy stance the Aussie gains are likely to be limited.
European Open Briefing: Asian Stock Markets Rose Overnight
Global Markets:
- Asian stock markets: Nikkei up 0.10 %, Shanghai Composite fell 0.10 %, Hang Seng rose 0.60 %, ASX 200 gained 0.10 %
- Commodities: Gold at $1230 (+0.25 %), Silver at $16.03 (+0.60 %), WTI Oil at $46.70 (+0.35 %), Brent Oil at $49.10 (+0.40 %)
- Rates: US 10 year yield at 2.33, UK 10 year yield at 1.31, German 10 year yield at 0.59
News & Data:
- China GDP q/q 1.7 % vs 1.7 % expected
- China GDP y/y 6.9 % vs 6.8 % expected
- China Industrial Production 7.6 % vs 6.5 % expected
- China Retail Sales 11.0 % vs 10.6 % expected
- China Fixed Asset Investment y/y 8.6 % vs 8.5 % expected
- UK Rightmove House Price Index 0.1 % vs -0.4 % previous
- China second quarter GDP growth tops forecasts on strong investment, consumption – RTRS
- Dollar nurses losses, China data beats forecasts – RTRS
CFTC Positioning Data:
- EUR long 84K vs 77K long last week. Longs increased by 7K
- GBP short 24K vs 28K short last week. Shorts trimmed by 4K.
- JPY short 112K vs 75K short last week. Shorts increased by 37K
- CHF short 0K vs 0K short last week. No change
- CAD short 9K vs 39K short. Shorts trimmed by 30K.
- AUD long 37k vs 32k last week. Longs increased by 5K.
- NZD long 32K vs 29K long last week. Longs increased by 3K
Markets Update:
Asian stock markets rose overnight, following better than expected Chinese data. Both the GDP and retail sales numbers beat expectations, suggesting that domestic demand is picking up as well.
The US Dollar remained offered after the disappointing US inflation and retail sales figures. The market does not see a rate hike before December as likely, and the USD is losing its strength as other central banks are becoming more hawkish.
EUR/USD started the week around 1.1460. Resistance is now seen at 1.15, but a break above that level would signal that the pair could rally towards 1.16 soon.
GBP/USD consolidated in a 1.3090-1.3110 range. The next strong resistance level now lies at 1.33, although the pair might struggle to rally much further given the recent soft economic data and concerns about Brexit.
Meanwhile, the Australian Dollar is looking strong following the breakout above 0.78. There is little resistance now until 0.80, and the risk-on sentiment & recovery of commodity prices could get the AUD/USD there.
Upcoming Events:
- 10:00 BST – Euro Zone CPI
- 13:30 BST – US NY Empire State Manufacturing Index
- 23:45 BST – New Zealand CPI
The Week Ahead:
Tuesday, July 18th
- 09:30 BST – UK CPI
- 10:00 BST – German ZEW Economic Sentiment
- 10:00 BST – Euro Zone ZEW Economic Sentiment
- 14:30 BST – Bank of England Governor Carney speaks
Wednesday, July 19th
- 13:30 BST – US Building Permits
- 13:30 BST – US Housing Starts
- 15:30 BST – US Crude Oil Inventories
Thursday, July 20th
- 00:50 BST – Japanese Trade Balance
- 02:30 BST – Australian Employment Change
- 02:30 BST – Australian NAB Business Confidence
- 02:30 BST – Australian Unemployment Rate
- 07:00 BST – German PPI
- 07:00 BST – Swiss Trade Balance
- 07:30 BST – BoJ Press Conference
- 09:30 BST – UK Retail Sales
- 12:45 BST – ECB Rate Decision
- 13:30 BST – ECB Press Conference
- 13:30 BST – US Philadelphia Fed Manufacturing Index
- 13:30 BST – US Initial Jobless Claims
Friday, July 21st
- 13:30 BST – Canadian Retail Sales
- 13:30 BST – Canadian CPI
Weekly Technical Outlook And Review: EUR/USD, GBP/USD, AUD/USD, USD/JPY, USD/CAD, USD/CHF, DOW 30, GOLD
A note on lower timeframe confirming price action...
Waiting for lower timeframe confirmation is our main tool to confirm strength within higher timeframe zones, and has really been the key to our trading success. It takes a little time to understand the subtle nuances, however, as each trade is never the same, but once you master the rhythm so to speak, you will be saved from countless unnecessary losing trades. The following is a list of what we look for:
- A break/retest of supply or demand dependent on which way you're trading.
- A trendline break/retest.
- Buying/selling tails ... essentially we look for a cluster of very obvious spikes off of lower timeframe support and resistance levels within the higher timeframe zone.
- Candlestick patterns. We tend to only stick with pin bars and engulfing bars as these have proven to be the most effective.
We typically search for lower-timeframe confirmation between the M15 and H1 timeframes, since most of our higher-timeframe areas begin with the H4. Stops are usually placed 1-3 pips beyond confirming structures.
EUR/USD
Weekly gain/loss: + 65 pips
Weekly closing price: 1.1465
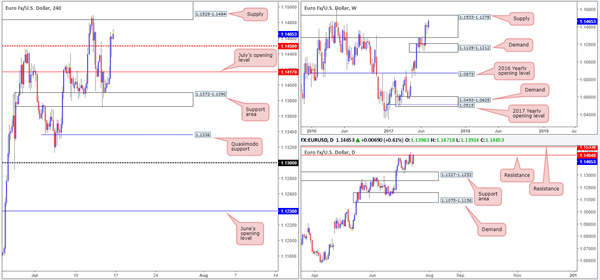
EUR/USD bulls gravitated higher last week despite weekly price being positioned within the walls of a major supply drawn from 1.1533-1.1278, which has capped upside since May 2015. This is the highest we've seen the single currency close since mid-Feb 2015, thus possibly signifying that the bears could be under serious pressure here!
Daily resistance at 1.1464, however, remains in play. This line boasts strong historical significance, managing to cap upside multiple times during the past couple of years, often delivering to-the-pip reactions! Should the bulls overcome this line this week, they'll likely attempt an approach to a daily resistance level seen pegged at 1.1533, essentially denoting the upper edge of the said weekly supply.
A brief look at recent dealings on the H4 timeframe shows that price managed to find a strong pocket of bids around the support area marked at 1.1372-1.1390, and end the week closing above a mid-level resistance at 1.1450. The move was strongly influenced after US inflation and retail sales figures missed consensus, therefore sending the dollar lower and the EUR higher.
For those who have been following recent reports on the EUR/USD you may recall that our desk took a short from 1.1484. 50% of the position was liquidated around July's opening level at 1.1417, with the remaining 50% left in the market to target the H4 Quasimodo support level at 1.1336: seen placed just nine pips above the top edge of a daily support area 1.1327-1.1253. Given Friday's news and the strong close above 1.1450, we decided to close the remainder of our position at 1.1460.
Our suggestions: Although weekly price shows the bulls to have the upper hand right now, it would be unwise of us to disregard the fact that the aforementioned weekly supply is still in motion. What's more, daily resistance at 1.1464 and the nearby H4 supply seen at 1.1529-1.1484 has yet to be breached. Therefore, for us, the bears still have a hand in this fight until proven otherwise.
With the above taken into account, we will be watching the said H4 supply base for shorts again this week. However, instead of entering using a pending order as we did last time, we will be waiting for H4 candle confirmation in the shape of a full, or near-full-bodied bearish candle, before pulling the trigger.
Data points to consider: No high-impacting events on the docket today.
Levels to watch/live orders:
- Buys: Flat (stop loss: N/A).
- Sells: 1.1529-1.1484 ([waiting for a H4 bearish candle – preferably in the form of a full, or near-full-bodied candle – is advised] stop loss: ideally beyond the candle's wick).
GBP/USD:
Weekly gain/loss: + 218 pips
Weekly closing price: 1.3101
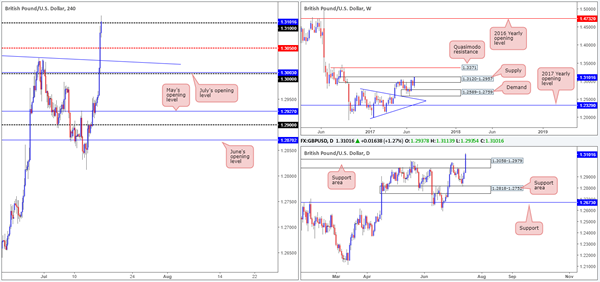
Looking at the weekly timeframe, it's clear to see that a strong succession of bids flowed into the market last week, consequently forming a near-full-bodied weekly candle within supply at 1.3120-1.2957. Assuming that the bulls continue to govern direction here, this could lead to a move being seen up to a Quasimodo resistance level coming in at 1.3371.
Recent action on the daily timeframe, nevertheless, shows price recently crossed above a resistance area at 1.3058-1.2979. Technically speaking, this could potentially stimulate another round of buying this week up to supply drawn from 1.3278-1.3179 (not seen on the screen).
A quick recap of Friday's trade on the H4 timeframe shows that the GBP/USD received a sharp boost of buying, following lower-than-expected US inflation and retail sales numbers. The move, as you can see, pushed price above multiple tech resistances and ended the week closing marginally above the 1.31 handle.
To our way of seeing things, 1.31 is a key level to keep an eye on today. Should the market reject this number, it could imply that the bears may make an appearance within the current weekly supply. A decisive H4 close above this psychological boundary, nonetheless, would likely suggest that the unit could be heading up to a H4 resistance derived from 1.3172 (not seen on the screen), located seven pips below the daily supply mentioned above at 1.3278-1.3179.
Our suggestions: Keep a close eye on 1.31 today as it could play a decisive role in where this market may be headed today/ this week.
A decisive H4 close above 1.31 followed up with a retest and a H4 bull candle (preferably a full, or near-full-bodied candle) would be enough evidence for us to consider a long, targeting 1.3172.
A rejection of 1.31, however, would likely call for a move back down to the top edge of the recently broken daily resistance area at 1.3058/mid-level support at 1.3050. This could be an option should one be able to pin down an entry with a small enough stop to accommodate sufficient risk/reward.
Personally, we prefer looking for longs above 1.31 since risk/reward will likely be much better.
Data points to consider: No high-impacting events on the docket today.
Levels to watch/live orders:
- Buys: Watch for H4 price to print a decisive engulf above 1.31 and then look to trade any retest seen thereafter ([waiting for a H4 bullish candle – preferably in the form of a full, or near-full-bodied candle – to form following the retest is advised] stop loss: ideally beyond the candle's tail).
- Sells: Flat (stop loss: N/A).
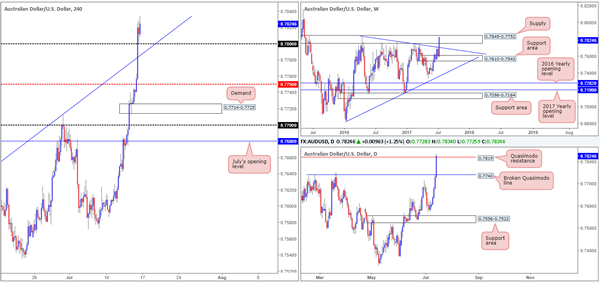
AUD/USD
Weekly gain/loss: + 221 pips
Weekly closing price: 0.7824
A stronger-than-expected rebound was seen from the weekly support area at 0.7610-0.7543 last week, resulting in weekly price running through the trendline resistance extended from the high 0.7835 and aggressively challenging the weekly supply zone seen at 0.7849-0.7752.
Over on the daily picture, we can see that the commodity currency edged its way slightly above a daily Quasimodo resistance at 0.7819 by the week's close. Despite the strong bullish close seen here, we would not consider this line to be engulfed until the apex of the Quasimodo formation has been taken out at 0.7849, which also represents the top edge of the aforementioned weekly supply.
Influenced by Friday's weak US inflation and retails sales data, H4 action rallied through the 0.78 handle and, as you can see, was quickly retested as support. Given that the number held into the week's end, there's a chance that we could witness further buying up to a resistance level pegged at 0.7870.
Our suggestions: Seeing as weekly price is still trading within supply, and daily flow is seen interacting with a Quasimodo resistance, our team is wary of taking any long positions above 0.78 at the moment despite room being seen on the H4 timeframe to punch higher. To that end, opting to stand on the sidelines here may be the best path to take today.
Data points to consider: Chinese growth figures and Industrial production data is scheduled to be released at 3am GMT+1.
Levels to watch/live orders:
- Buys: Flat (stop loss: N/A).
- Sells: Flat (stop loss: N/A).
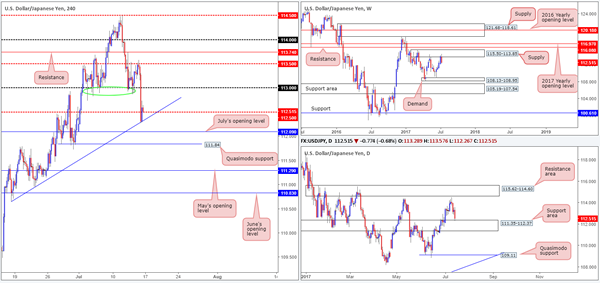
USD/JPY
Weekly gain/loss: – 139 pips
Weekly closing price: 112.51
Following a four-week bullish phase, last week saw the bears stamp in a strong-looking weekly bearish candle from the underside of a weekly supply zone at 115.50-113.85. In the case that the bears continue to push things south from here, the next area of interest on the weekly scale is 108.13-108.95: a demand zone that supported price beautifully mid-way through the month of June.
Bouncing down to the daily timeframe, we can see that the weekly bears have some stiff opposition! Holding firm since late January 2017, the daily support area at 111.35-112.37 was recently brought into play on Friday. Considering the established history surrounding this zone, there's a solid possibility the bulls will attempt to come into the market here.
Zooming in for a closer look at price action on the H4 timeframe, Friday's selloff, influenced by weak US inflation and retail sales figures, saw the 113 handle and the mid-level support at 112.50 consumed, and a H4 trendline support extended from the low 110.64 brought into play. The pair ended the day closing marginally above 112.50, likely helped by the reaction seen from the top edge of the daily support area at 112.37.
Our suggestions: Buying from 112.50 seems a logical idea if one dismisses the weekly timeframe. The next target from 112.50 is likely to be the 113 band given how well it served as support since the beginning of the month (see green circle).
While it is tempting to pull the trigger and buy from 112.50, our team is reluctant to commit, due to where weekly price is positioned at the moment (see above). In regard to selling this market, we're also hesitant. This is obviously because of the daily support area in motion and how restricted H4 structure is right now: July's opening level seen nearby at 112.09, followed closely by the Quasimodo support level at 111.84.
Data points to consider: No high-impacting events on the docket today. Japanese banks will be closed in observance of Marine Day.
Levels to watch/live orders:
- Buys: Flat (stop loss: N/A).
- Sells: Flat (stop loss: N/A).
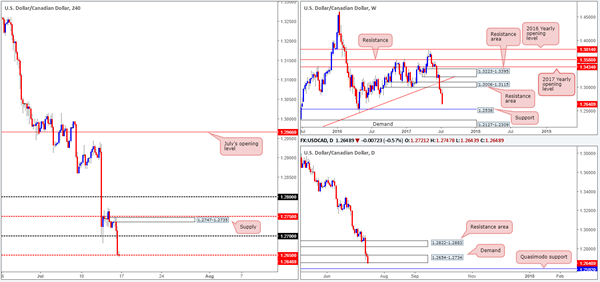
USD/CAD:
Weekly gain/loss: – 229 pips
Weekly closing price: 1.2648
Last week's sharp run to the downside pushed the USD/CAD into further losses, stripping close to 230 pips off its value. The next area of support on the weekly timeframe does not come into view until we reach 1.2538, thus the odds of further selling being seen this week, in our opinion, is relatively high.
Turning our attention to the daily candles, demand at 1.2654-1.2734 suffered a minor breach going into the week's close in the shape of a full-bodied bearish candle. Assuming that the bears remain dominant beneath this zone, it's likely that we'll see price cross swords with a Quasimodo support level coming in at 1.2592 sometime this week.
Looking over to the H4 timeframe, the week ended printing a strong full-bodied bearish candle a few pips below the mid-level support at 1.2650. With this number likely under pressure, we see little reason, from a technical perspective, why the market will not attempt to approach the 1.26 handle (not seen on the screen).
With stop-loss orders likely getting chewed up from beneath the current daily demand at the moment, alongside breakout sellers' orders, a bounce from the 1.2595/1.26 neighborhood is likely to take shape. How much of a bounce is difficult to judge though, since you would be effectively buying into strong weekly selling!
Our suggestions: Should you feel 1.2592/1.26 is worthy of attention, we would strongly recommend waiting for additional confirmation here either in the form of a H4 bull candle or using the lower-timeframe candles (see above for information on how we look for this) before pulling the trigger.
Data points to consider: No high-impacting events on the docket today.
Levels to watch/live orders:
- Buys: 1.2592/1.26 (possible area to hunt for long opportunities).
- Sells: Flat (Stop loss: N/A).
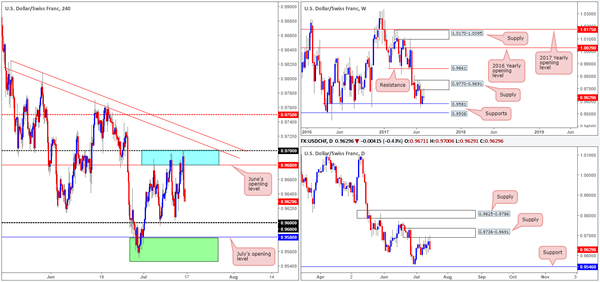
USD/CHF:
Weekly gain/loss: – 10 pips
Weekly closing price: 0.9629
Weekly price, as you can probably see, remains capped by a supply at 0.9770-0.9691 and a support formed at 0.9581. Beyond the supply zone, we can see little stopping price from reaching the resistance level seen at 0.9861, and beneath the current support, there's a nearby level planted at 0.9508 that will likely be challenged should the bears come into this market.
In conjunction with the weekly timeframe, there's also a partner supply seen glued around the underside of the said weekly zone on the daily timeframe at 0.9736-0.9691 that's in play. Should this area continue to hold firm, then the next level of support does not come into view until we reach 0.9546.
Since the 5th May, the H4 candles have been consolidating between 0.97/0.9680 (round number/June's opening level – blue zone) and the 0.96 handle.
With this in mind, we remain interested in the two following zones for potential trades:
The first is the blue resistance zone mentioned above at 0.97/0.9680. We've selected this area since not only is this barrier lodged around the underside of the said weekly supply, but also its partner supply seen on the daily timeframe.
The second zone is a support area marked in green comprised of a daily support at 0.9546 and the weekly support at 0.9581, which also happens to converge closely with July's opening level at 0.9580.
Our suggestions: To initiate a trade at either of the above noted zones, nevertheless, we would require H4 candle confirmation, preferably in the shape of a full, or near-full-bodied candle. This is just a way to confirm that there are other speculators interested in the same zone as we are!
Data points to consider: No high-impacting events on the docket today.
Levels to watch/live orders:
- Buys: 0.9546/0.9581 ([waiting for a H4 bull candle – preferably a full, or near full-bodied candle – to form is advised] stop loss: ideally beyond the candle's tail).
- Sells: 0.97/0.9680 ([waiting for a H4 bear candle – preferably a full, or near full-bodied candle – to form is advised] stop loss: ideally beyond the candle's wick).
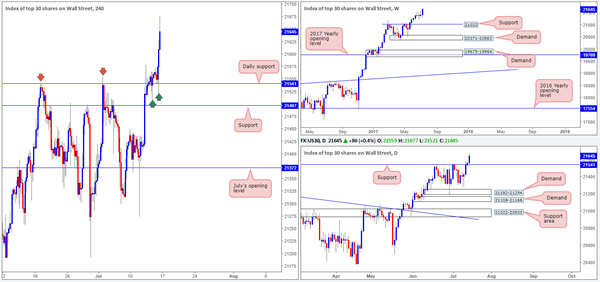
DOW 30:
Weekly gain/loss: + 229 points
Weekly closing price: 21645
US equity prices pushed to a record high of 21677 last week, which led to a strong-looking bullish candle forming. From the weekly timeframe, it is clear to see that this market's underlying trend remains strong. However, should the index pullback, the support level drawn from 21022 is likely the area where we'll see the bulls make an appearance.
Looking down to the daily timeframe, nevertheless, we can see that price recently crossed above the resistance level pegged at 21541, which technically speaking, should now act as a support barrier if it is retested.
There's not much information we can glean from the H4 timeframe that we have not already done so from the higher timeframes. Therefore, the aforementioned daily support level will likely be the first port of call should the market pullback this week.
Our suggestions: Put simply, our team wants to see the daily support level mentioned above at 21541 retested today/this week. This – coupled with a reasonably sized H4 bull candle, preferably a full, or near-full-bodied candle, would be enough evidence for us to confirm a long position as valid.
Data points to consider: No high-impacting events on the docket today.
Levels to watch/live orders:
- Buys: 21541 ([waiting for a H4 bull candle – preferably a full, or near full-bodied candle – to form is advised] stop loss: ideally beyond the candle's tail).
- Sells: Flat (stop loss: N/A).
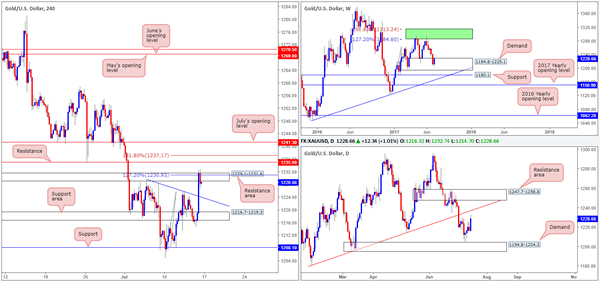
GOLD
Weekly gain/loss: + $16.5
Weekly closing price: 1228.6
After diving relatively deep into weekly demand, the bulls slammed on the breaks last week and reversed price, erasing around 70% of the prior week's losses in the process. According to the weekly timeframe, there's space for the candles to rally back up to an area comprised of two weekly Fibonacci extensions 161.8/127.2% at 1313.7/1285.2 taken from the low 1188.1 (green zone).
On the daily timeframe, nonetheless, price is currently seen trading within a stone's throw away from a trendline resistance extended from the low 1180.4, followed closely by a resistance area pegged at 1247.7-1258.8.
Across on the H4 timeframe, the resistance area at 1229.1-1231.6, which converges with a 127.2% Fib ext. point at 1230.9 taken from the low 1208.1, is currently in play. To our way of seeing things, this area looks vulnerable to the upside. The next line beyond this zone sits nearby at 1235.0: a resistance level that happens to fuse nicely with a 161.8% Fib ext. point at 1237.1 taken from the low 1208.1.
Our suggestions: This is quite a tricky market to judge at the moment. On the one hand we have weekly price suggesting to buy the metal, and on the other hand, we have daily and H4 price nearing reasonably strong resistances!
Therefore, whichever way one choses you'll be trading against higher-timeframe structure. For now, we feel the best route one can take is to remain on the sidelines here until we have all three timeframes trading in unison.
Levels to watch/live orders:
- Buys: Flat (stop loss: N/A).
- Sells: Flat (stop loss: N/A).
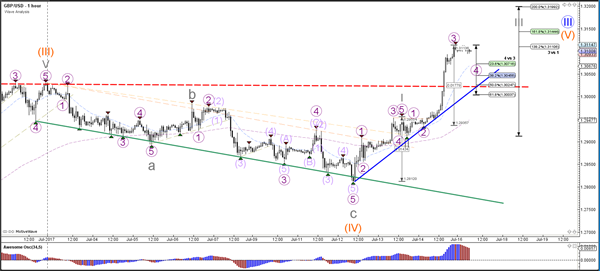
Daily Technical Analysis: GBP/USD Breaks Above Key 1.30 Resistance With Sturdy Impulse
Currency pair GBP/USD
The GBP/USD broke sturdily above the previous top which is indicated by the dotted red trend line. The breakout candle is showing strong momentum, which could indicate that the Cable could continue towards the Fibonacci targets of wave 5 vs 1+3.
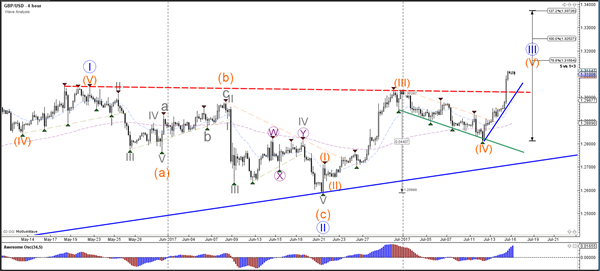
The GBP/USD is in a wave 3 (purple) momentum which could see a retracement develop within the wave 4 (purple) before price continues with the wave 3 (grey) of a higher degree. The Fibonacci levels of wave 4 vs 3 are therefore potential support levels that can be used for a bullish bounce. The broken resistance could also become potential support.
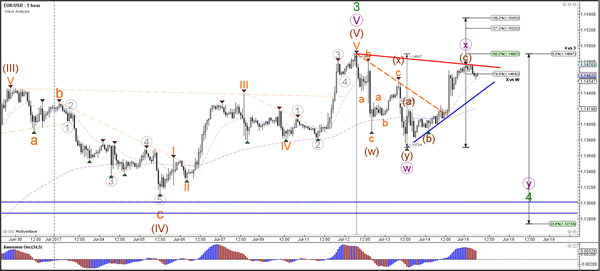
Currency pair EUR/USD
The EUR/USD is at a key decision spot: a bullish breakout above 1.15, the resistance trend line (red) would indicate and the 138.2% Fibonacci level would indicate a likely continuation of wave 3 (green). A bearish bounce however could confirm the wave X (purple) correction within a larger wave 4 (green).
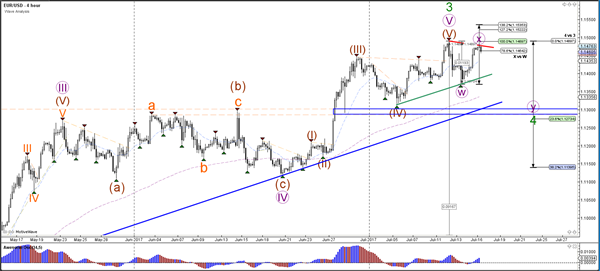
The EUR/USD has either completed an ABC (brown) correction or is showing a continuation of the uptrend. An important factor for this structure are the trend lines (red/blue). A break above resistance or below support could indicate the potential direction.
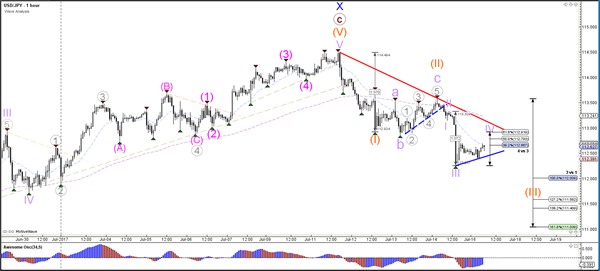
Currency pair USD/JPY
The USD/JPY is either in a new bearish trend (123 orange) or is building a bearish correction within a larger uptrend. A break below the support trend line (blue) is a first clue of a larger bearish reversal but price will need to reach at least the 161.8% Fib target of wave 3 vs 1.
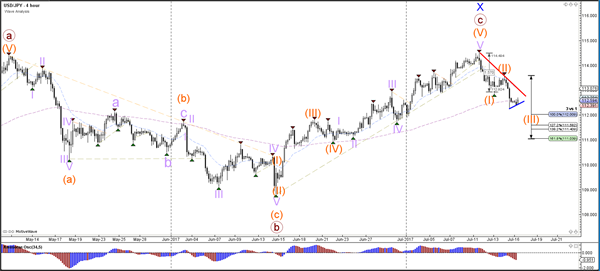
The USD/JPY could be in a wave 4 (purple) as long as price does not break above the 61.8% Fibonacci level of wave 4 vs 3 and the resistance trend line (red).
NZD Strength Could Surprise Again This Week
Key Points:
- The NZD could be poised to rally further this week.
- GDT Prices are likely to be the driving force behind further upsides.
- Technicals are also hinting at another bullish week.
The NZDUSD was under the control of the bulls last week and it completely recovered from recent losses. However, what was driving the move isn't immediately apparent given the general lack of much in the way of NZ economic news. Moreover, the NZ data that was seen was fairly disappointing – the opposite of what we would expect given the strength of the overall upswing. As a result, it's worth taking a closer look at what was influencing the pair last week and what is likely to be impacting it moving forwards.
Starting with last week's performance, the Kiwi Dollar was under pressure from the get go, declining more than 50 pips by the end of Tuesday as the market reacted to a disappointingly flat NZ Electronic Card Retail Sales result. However, interestingly, this selling pressure proved to be rather fleeting and, from Wednesday onwards, the NZD surged higher which, ultimately, saw it close Friday at a fresh high for 2017 around the 0.7345 mark.
By the looks of it, the momentum for the upswing stemmed from a number of factors, most notably Janet Yellen's rather dovish testimony to Congress. This being said, the softer US CPI data and the 0.2% contraction in US Retail Sales also played a heavy hand in fuelling buying pressure as the week drew to a close. Regardless of what played the bigger role, the combination of these factors offset not only the early losses but also the effects of the broadly weaker NZ economic news seen throughout the rest of the week – resulting in a net gain for the pair.
As for what is coming next, given how sensitive the pair was to fundamentals last week, the impending NZ CPI numbers and the GDT Price Index are definitely worth a look in going forward. The CPI results are expected to be somewhat softer than last time at 1.9% y/y and 0.2% q/q which could see the pair moderate some of its recent gains. Nevertheless, any movement could be rather subdued given the general dearth of US data and the fact that many traders will be waiting for the GDT figure before making a move.
It is worth noting here that we have had two consecutive contractions in global dairy prices which could see a bout of panic selling for the NZD should we see a significantly negative result. Conversely, a suitably positive outcome will see the markets breathe a sigh of relief – potentially encouraging the Kiwi Dollar to extend last's week's rally.
Moving on to the technical bias for the week ahead, the Kiwi Dollar is actually fairly well positioned to continue with recent bullishness. Indeed, with the exception of the stochastics, most other technical indicators are signalling that further gains are on the way. Nevertheless, the Parabolic SAR and the MACD readings warrant a closer look given their particularly strong hints of additional upsides. Specifically, the Parabolic SAR inverted twice last week – effectively renewing its longer-term bullish bias. As for the MACD oscillator, it is on the cusp of a signal line crossover which could see the bears back on the defensive moving forward. If the pair tracks higher, resistance is in place around the 0.7352, 0.7406, and 0.7480 levels.
Ultimately, the outlook for the Kiwi Dollar is looking fairly good this week and the pair could extend recent gains. Indeed, the NZD could be on a path to challenge last year's highs which might mean that the 0.75 handle and beyond are now firmly in the bulls' sights. However, even a week of poor fundamentals could put this uptrend in jeopardy which is worth keeping in mind moving ahead.