Sample Category Title
USD Bounces Back. China’s Economy Accelerates
China's stock markets slid despite solid GDP read
Chinese equities tumbled on Monday with the tech focussed Shenzhen index falling 4.28% to 1,800.54, while the Shanghai Composite was off 1.43% to 3,176.46 points. Data showed the world's second largest economy grew 6.9%y/y in the second quarter, matching the previous quarter's performance but beating median forecast of 6.8%. June retail sales also came in higher than expected, printing at 11%y/y versus 10.6% expected. Finally, industrial production expanded 7.6%y/y, beating forecast of 6.5%.
This morning's sell-off in came on the back of rising concerns about the excess of leverage in the economy and questions regarding potential domino effects once deleveraging actually kicks in. In the FX market the yuan, both onshore and offshore, was trading flat lined despite a broad based strength of the greenback.
The dollar index extended gains against most of its peer, rising 0.35% against the Swedish krona and the New Zealand dollar and 0.25% against the single currency, recovering somewhat after Friday's sell-off. Indeed, the last batch of US data left little for excess optimism. Retail sales printed in negative territory for the second month in a row, contracting 0.2%m/m (versus +0.1% expected). Excluding auto and gas, the measure shrunk 0.1%m/m versus +0.4% median forecast. The persistent weakness in US data suggests that what the Fed sees as “transitory” may have deeper roots, which would for sure dampened its rate pace outlook.
US dollar to weaken, as Fed aims to let inflation run and keep interest rates low
The US Federal Reserve wants to let inflation run and keep interest rates low. This, we believe, is for two reasons. First, letting inflation rise will allow erode the US Central Bank's bond-bloated balance sheet in real terms. Second, hiking interest rates above 2% would trigger a major recession and push debt-service payments to an unsustainable level. (The current Federal Funds rate is 1.16%.)
So at the next meeting of the Fed's Open Market Committee, on 25-26 July, we believe interest rates will not be increased. This will weaken the USD against the EUR, hiking it to $1.15 for 1 Euro in the short term.
Last week, in testimony to the US Congress, Fed Chairwoman Janet Yellen admitted that stocks markets are overheated, and that strong “valuation pressures” prevail across a range of assets. Nonetheless, Yellen was unclear whether interest rates will rise before year-end. Her stance is a marked departure from policy of the preceding eight years, when the Fed repeatedly boosted stocks through liquidity and verbal interventions.
EUR/USD Stalling Below 1.1500, GBP/USD Consolidating After Strong Increase, USD/JPY Weakening.
EUR/USD Stalling below 1.1500.
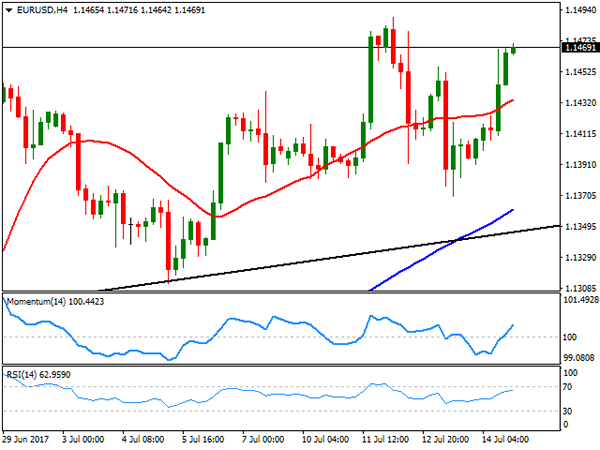
EUR/USD bearish pressures are weak and the pair is way into a consolidation phase. Hourly resistance is given at 1.1489 (12/07/2017 high). Hourly support can be found at 1.1313 (05/07/2017 high). Stronger support lies at 1.1076 (18/05/2017 low). Expected to show sideways price action.
In the longer term, the momentum is clearly negative. We favour a continued bearish bias towards parity. Key resistance holds at 1.1714 (24/08/2015 high) while strong support lies at 1.0341 (03/01/2017 low).
GBP/USD Consolidating after strong increase.
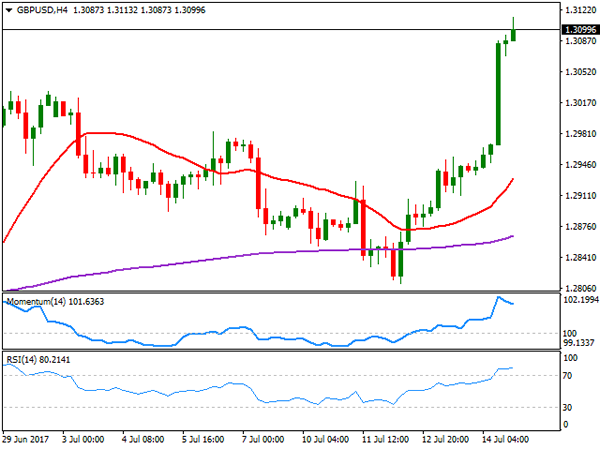
GBP/USD has broken the 1.3000 mark. Strong resistance at 1.3048 (18/05/2017 high) has been broken. Expected to show continued bullish pressures.
The long-term technical pattern is even more negative since the Brexit vote has paved the way for further decline. Long-term support given at 1.0520 (01/03/85) represents a decent target. Long-term resistance is given at 1.5018 (24/06/2015) and would indicate a long-term reversal in the negative trend. Yet, it is very unlikely at the moment.
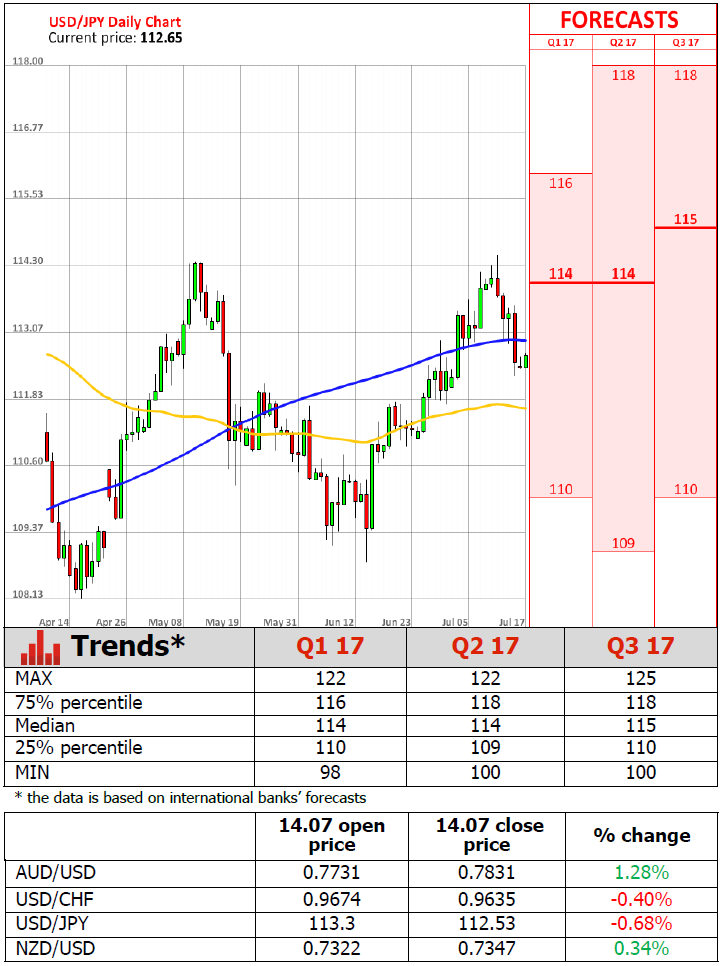
USD/JPY Weakening.
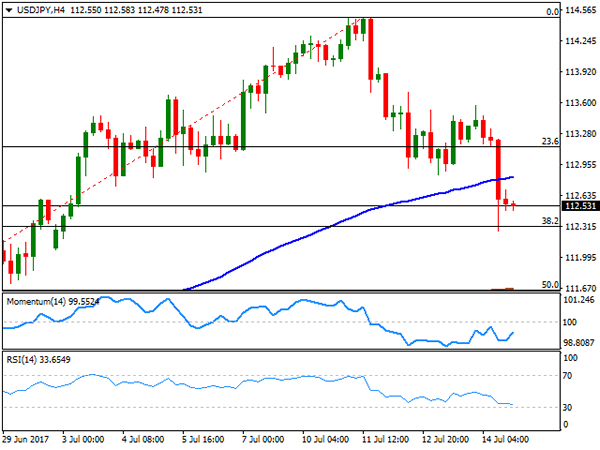
USD/JPY is going lower. Hourly support given at 112.83 (13/07/2017 low) has been broken. Stronger support is located at a distance at 108.13 (17/04/2017 low). Expected to show continued bearish pressures.
We favor a long-term bearish bias. Support is now given at 96.57 (10/08/2013 low). A gradual rise towards the major resistance at 135.15 (01/02/2002 high) seems absolutely unlikely. Expected to decline further support at 93.79 (13/06/2013 low).
Technical Outlook: USDJPY – Close Below 112.32 Fibo Support To Signal Fresh Bear
The pair is consolidating above pivotal support at 112.32 (Fibo 38.2% of 108.80/114.49 upleg) which was cracked on Friday's strong fall.
Repeated close (Thu/Fri) below daily Tenkan-sen confirms negative near-term stance.
Upside attempts were so far capped by initial barrier at 112.78 (Fibo 23.6% of 114.49/112.25 pullback) with thick 4-hr cloud weighing on near-term action (cloud base lies at 113.11, also Fibo 38.2%).
Close below 112.32 to signal fresh downside and expose a cluster of daily MA supports between 111.94 and 111.80, followed by daily Kijun-sen at 111.64 and thickening daily cloud (spanned between 111.23 and 111.07.
Alternative scenario requires sustained break above daily Tenkan-sen (113.37) to sideline immediate downside threats.
Res: 112.78, 113.15, 113.37, 113.57
Sup: 112.32, 111.94, 111.80, 111.64
Euro Slightly Lower, Eurozone CPI Ticks Lower
The euro has posted slight losses in the Monday session. Currently, EUR/USD is trading at 1.1450. On the release front, it's a very quiet start to the week. Eurozone Final CPI edged down to 1.3%, matching the forecast. In the US, today's sole event is the Empire State Manufacturing Index, which is expected to dip to 15.8 points.
Inflation levels in the US remain stubbornly low, but the Federal Reserve remains convinced that it's only a matter of time before inflation levels move higher. This stance was reiterated by Fed Chair Janet Yellen last week, as she testified before congressional and senate committees. With the labor market close to capacity and the unemployment rate at just 4.4%, economists are puzzled why this hasn't pushed inflation to higher levels. In her testimony, Yellen admitted that the Fed was at a loss to explain the lack of inflation, but insisted that it was “premature to conclude that the underlying inflation trend is falling well short of 2 percent”, and that with a strong labor market “the conditions are in place for inflation to move up”. Is Yellen's argument just wishful thinking? The markets aren't buying in, with the odds of a December hike at just 43%, according to the CME Group.
Fed policymakers surely weren't smiling after Friday's consumer inflation and spending numbers. CPI edged up to 0.0%, short of the forecast of 0.1%. There was no relief from Retail Sales, which declined 0.2%, missing the estimate of 0.1%. This marked the third decline in the past four months. Consumer spending accounts for 2/3 of US economic activity, so it's no surprise that weak spending has also meant weak inflation, despite Yellen's claim that low inflation is a temporary phenomenon. The economy had a weak first quarter, with growth of just 1.4%. If the second quarter follows suit, investors could sour on the US dollar in favor of other assets, and the euro could take advantage.
Eurozone inflation levels continue to soften. Eurozone Final CPI edged down from 1.4% to 1.3% in June, marking its weakest gain in 2017. Germany may be the catalyst of the eurozone's economic recovery, but the bloc's largest economy has not been immune to low inflation. Final CPI improved to 0.2% in June, compared to -0.2% in May. CPI has managed just one reading above 0.2% in 2017, and earlier in the week, WPI came in at 0.0%. German and eurozone inflation levels remain well below the ECB's target of 2%, and with no indication that inflation levels will move higher anytime soon, the cautious ECB is unlikely to taper its aggressive stimulus package.
EURUSD Close To 14½-Month High, Bullish In The Medium-Term
EURUSD reached a fourteen-and-a-half-month high of 1.1489 during Wednesday of last week. The price is down in today's trading so far after advancing by 0.6% during Friday's trading.
Looking at the Ichimoku analysis, the positive alignment when the Tenkan-sen line (red) crossed above the Kijun-sen (blue) in late June is still in place – this hints to a bullish market bias. Despite this, momentum in the very short-term seems to be on the downside as indicated by the downward trending RSI.
The area around last Wednesday's high of 1.1489 could prove to be a major barrier to the upside. Should the price climb above, resistance is likely to be met around the 1.15 handle as well.
On the downside, support might be formed around the current level of the Tenkan-sen at 1.14. If this is violated, additional support could come around last Thursday's eleven-day low of 1.1370.
Concerning the medium-term outlook, a bullish cross was formed in mid-May when the 50-day moving average (MA) crossed above the 200-day MA. This points to a positive medium-term picture and price action taking place above the cloud, 50- and 200-day MAs since late April is supporting the strength of this signal.
Dollar Weakness Eases, China Releases Upbeat Economic Data, Commodities Up
As a result of a holiday in Japan the first trading session of the day was more quiet than usual. A set of economic data releases out of China dominated the news flow so far. Pressure on the dollar against major currencies stalled during the Asian session, following the greenback's plunge on Friday amid disappointing inflation and retail sales data.
China's upbeat economic data releases took markets by surprise today. The second quarter GDP rose 6.9% year-on-year, faster than expected (6.8%) as industrial output and consumption picked up and investment remained strong. This gave a boost to China dependent currencies such as the aussie that rose against the dollar following the release, but later gave up on the gains.
The greenback firmed slightly against the yen, up one-tenth of a percent, with dollar/yen last trading at 112.69 ahead of the European session. The dollar index was broadly flat today. This comes after the dollar tumbled on Friday amid the release of disappointing inflation and retail sales figures. The dollar index fell to a fresh 10-month low of 95.25 immediately following the release. Market participants are now especially skeptical about the prospects of future interest rate hikes by the Federal Reserve.
The euro gave up on some of the gains from Friday against the dollar, but remained close to its highest level in a year. Euro/dollar was last trading at 1.1456 ahead of the European session. Looking ahead, June final inflation for the eurozone will be released later today. Economists are expecting an upward revision to the monthly figure. The main event of the week will be the European Central Bank meeting on Thursday.
Sterling also gave up on some of the gains from Friday against the greenback. Pound/dollar was last trading at 1.3090. Traders will likely monitor the second part of the Brexit negotiations that start today in Brussels.
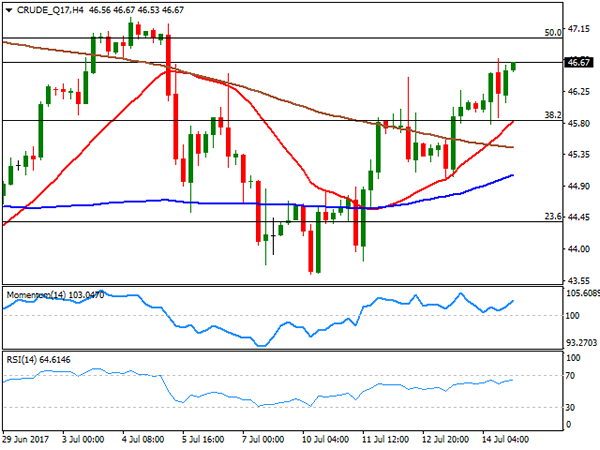
Oil prices continued gaining during the Asian session, amid a slowdown in the US rigs expansion and due to a strong refinery demand from China. WTI was last trading at $46.75 a barrel and Brent at $49.17.
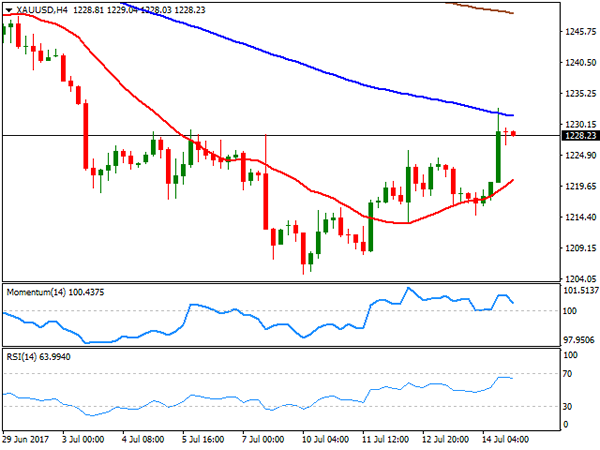
Gold continued building on Friday's strong gain when the precious metal rose amid dollar weakness. Gold was last trading at $1,230.7 an ounce ahead of the European session.
Technical Outlook: Cable Eases After Fibo Barrier At 1.3109 Repeatedly Capped Rallies
Cable is pressuring initial support at 1.3047 (18 May former high) in early Monday's trading, following repeated failure at 1.3113 (Friday's high / near Fibo 38.2% retracement of 1.5016/1.1930 descend) which so far capped the rally.
Further easing on profit-taking after strong rally last week and overbought conditions on daily chart could be anticipated.
Extension below former highs at 1.3047/30 should ideally find support at psychological 1.3000 support (also Fibo 38.2% of 1.2811/1.3113) and 1.2962 (daily Tenkan-sen), before bulls resume.
Bullish technical studies and sentiment on overall weak US dollar keep the pair supported, with clear break above 1.3113 needed to confirm bullish continuation towards 1.3445 (Sep 2016 high).
UK inflation (due on Tuesday) and Retail Sales (due on Thursday) will be closely watched for fresh signals.
Stronger bearish signals could be expected on extension below 1.2930 (Friday's low / Fibo 61.8% of last week's 1.2811/1.3113 rally).
Res: 1.3113; 1.3164; 1.3200; 1.3248
Sup: 1.3047; 1.3030; 1.3000; 1.2962
US Consumer Prices Unchanged In June, Retail Sales Decrease
'The weak trajectory of consumer spending at the end of second quarter adds some challenges to the third-quarter consumption outlook, which reinforces our view that growth will step down modestly in the current quarter.' - Michael Feroli, JPMorgan
Consumer prices in the United States were flat, while retail sales dropped for the second consecutive month in June. The Labour Department reported on Friday that its CPI registered an unchanged reading in the observed month, missing market expectations for a 0.1% rise, as the cost of mobile services and gasoline declining. On a yearly basis, the index surged 1.6% in June, continuing to ease from February's 2.7%, when it showed the strongest gain in five years. Furthermore, the so-called core inflation rose by the same margin of 0.1% for the third straight month. Meanwhile, the country's retail sales registered a 0.2% drop in the reported month, affected by declines in receipts at supermarkets, clothing stores and service stations. Data showed the largest monthly fall of 1.3% in gas station sales. Overall, economists suggested that the weaker-than-expected reports are set to diminish expectations for the Fed to raise interest rates for the third time this year, with inflation being the main uncertainty factor to define the course of further monetary policy changes.
GBP/JPY Daily Outlook
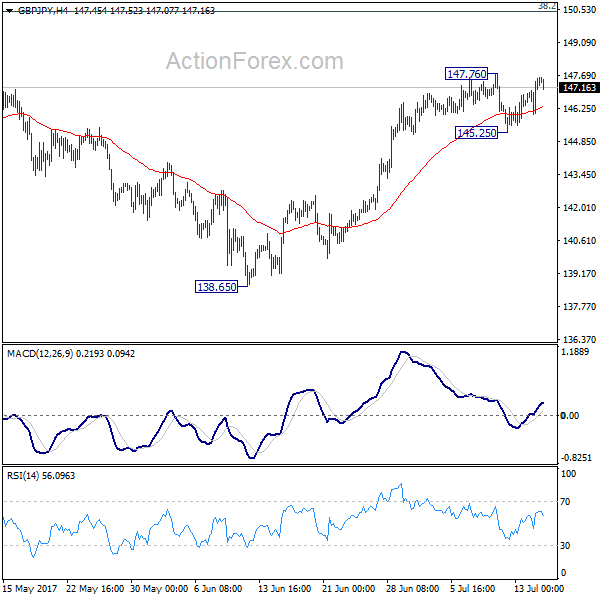
Daily Pivots: (S1) 146.43; (P) 147.00; (R1) 147.99; More
Intraday bias in GBP/JPY stays neutral with mixed near term outlook. On the upside break of 147.76 will resume rise from 138.65. And firm break of 148.42 key resistance will also resume the whole rally from 122.36 to long term fibonacci level at 150.43 and above. Meanwhile, on the downside, break of 145.25 will revive the case of rejection from 148.09/42 resistance zone. Intraday bias would then be turned back to the downside for 55 day EMA (now at 143.72) and below.
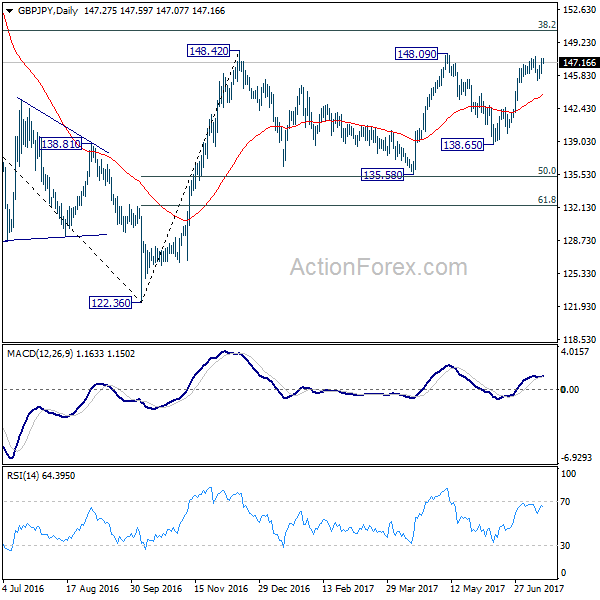
In the bigger picture, rise from medium term bottom at 122.36 is expected to continue to 38.2% retracement of 196.85 to 122.36 at 150.43. Decisive break there will carry long term bullish implications and pave the way to 61.8% retracement at 167.78. In case the sideway pattern from 148.42 extends, we'd be looking for strong support from 135.58 and 50% retracement of 122.36 to 148.42 at 135.39 to contain downside.
Foreign Exchange Market Commentary: EUR/USD, USD/JPY, GBP/USD, GOLD, WTI CRUDE, DJIA, FTSE100, DAX
EUR/USD
Weaker than expected US data released on Friday sent the greenback down across the board, with the EUR/USD pair ending Friday at 1.1469, not far from a fresh yearly high of 1.1489 set last week. US inflation for June came in flat, disappointing for a fourth consecutive month, up by 1.6% from a year earlier. Core CPI YoY resulted at 1.7% the lowest in over two years. Retail Sales also came below market's expectations, falling 0.2% in June, down for a second consecutive month, while consumer confidence, according to the Michigan index, fell down to 93.1 for July against previous 95.1.
The Fed is still in the path of rising rates for a third time this year and shrinking its balance sheet, according to Yellen's semi-annual testimony before the Congress, but she also said that not much more hikes are required to reach "normal." The figures released on Friday may it tougher for the central bank to continue with its tightening policy, while for the ECB, expectations built for QE tapering, with the market expecting some sort of announcement in the September meeting, not the one that will take place this upcoming week. Divergences on economic policies between the two institutions are beginning to dwindle, but still present, preventing the pair for breaking higher.
From a technical point of view the pair retains a bullish bias, albeit still unable to clearly surpass the current 1.1460 region, from where the pair retreated multiple times since January 2015. In the daily chart, technical indicators resumed their advances within positive territory after correcting overbought conditions, whilst the 20 DMA heads below the current level and around a daily ascendant trend line coming from June 28th, all of which favors additional advances. In the 4 hours chart, the price settled above its 20 SMA, whilst technical indicators advanced above their mid-lines, also supporting additional gains on a break above 1.1490, the yearly low and immediate resistance.
Support levels: 1.1420 1.1380 1.1340
Resistance levels: 1.1490 1.1525 1.1560
USD/JPY
The USD/JPY pair closed the week at 112.53, down on broad dollar's weakness, as the DXY sunk to fresh YTD lows on softer-than-expected US inflation figures. The pair traded as low as 112.26, bouncing modestly ahead of the close as US Treasury yields recovered some ground ahead of the closing bell. The 10-year note benchmark fell to 2.29% after settling at 2.32%, still down from previous 2.35%, while the 2-year note yields, the most sensitive to rate moves, fell to its lowest in three weeks. Japan will start the week with a bank holiday, which may result in limited action at the beginning of the week, whilst the BOJ will have its monetary policy meeting on Thursday. Governor Kuroda is not expected to surprise markets, reaffirming the need to maintain easing to achieve a sustainable 2% inflation. Anyway, the pair is a brick of breaking lower, as in the daily chart the price broke below its 200 DMA, while standing barely above the 38.2% retracement of its latest weekly advance, at 112.30. Technical indicators in the same chart have turned strongly lower and are about to cross their mid-lines into negative territory, suggesting that a downward move through the mentioned Fibonacci support should lead to additional losses. In the 4 hours chart, the price settled below the 100 SMA for the first time since mid June, while technical indicators have lost their bearish strength, but remain within negative territory, in line with the longer term perspective.
Support levels: 112.30 111.90 111.60
Resistance levels: 112.80 113.15 113.50
GBP/USD
The GBP/USD pair broke higher and settled around 1.3100, its highest since September last year, as hopes for a softer Brexit kept the Pound bid during the second half of the week, with the rally later fueled by USD weakness. PM Theresa May have asked opposition Labour for support with the Brexit, and news last week showed that she is considering setting up a cross-party Brexit commission, which somehow backed the case for a more EU friendly Brexit. The pair tripped stops above previous 2017 high on US weak data, topping on Friday at 1.3113. Next Tuesday, the UK will release its June employment figures, expected to remain close to 3%, but hopes of a rate hike cooled down on poor local data, putting the BOE on a tough position ahead of their next monetary policy meeting. In the meantime, the daily chart shows that the Momentum remains above its 100 level with limited upward strength, but also that the RSI indicator heads sharply higher at 67 as the 20 SMA advanced below the current level, in line with additional gains for this Monday. In the 4 hours chart, technical indicators have eased partially, but remain within extreme overbought levels, while the price stands far above its moving averages. 1.3047, the previous yearly high is the immediate support, and as long as it holds, the risk will remain towards the upside.
Support levels: 1.3050 1.3010 1.2965
Resistance levels: 1.3120 1.3160 1.3200
GOLD
Gold prices recovered strongly on Friday, ending the week up on poor US data that cooled down expectations of firm tightening in local monetary policy. Spot gold settled at $1,228.23 a troy ounce, recovering from a 4-month low of 1,204.75 set at the beginning of the past week. The recovery took off some of the downward pressure over the bright metal, but it´s still not enough to confirm an interim bottom ahead of further recoveries, as in the daily chart, selling interest rejected the advance around a bearish 20 DMA, at 1,232.80, while technical indicators barely managed to recover some ground, still well below their mid-lines. Shorter term, and according to the 4 hours chart, the upward potential also seems limited, as spot was unable to surpass a strongly bearish 100 SMA, whilst technical indicators turned lower within positive territory. In this last time frame, the 20 SMA provides a dynamic support at 1,220.70, with a break below it favoring a bearish extension for this Monday.
Support levels: 1,216.60 1,208.30 1,199.20
Resistance levels: 1,225.60 1,236.50 1,242.50
WTI CRUDE OIL
Crude oil prices recovered ground this past week, and West Texas Intermediate futures settled at $46.67 a barrel, up 5.2%. A broadly weaker dollar helped the commodity advance, as fears over an oversupply market persist, as the Baker Hughes report released on Friday showed that the number of active US rigs drilling for oil increased by 2 to 765. Backing the commodity were news indicating supply issues in Nigeria, with a pipeline shutdown. Daily basis, WTI presents a modest positive tone, with the price above its 20 SMA, the Momentum indicator lacking directional strength, but within positive territory, and the RSI indicator heading north around 57. In the same chart, however, the 100 DMA heads lower around the 61.8% retracement of the latest daily fall around 48.20, while the commodity topped around the 50% retracement of the same slide in the precious week around 47.20, prize zones where selling interest will likely appear. In the 4 hours chart, the upside is favored, with technical indicators heading higher within positive territory and the 20 SMA having surpassed its 100 and 200 SMAs below the current level.
Support levels: 45.90 45.20 44.60
Resistance levels: 47.20 47.70 48.20
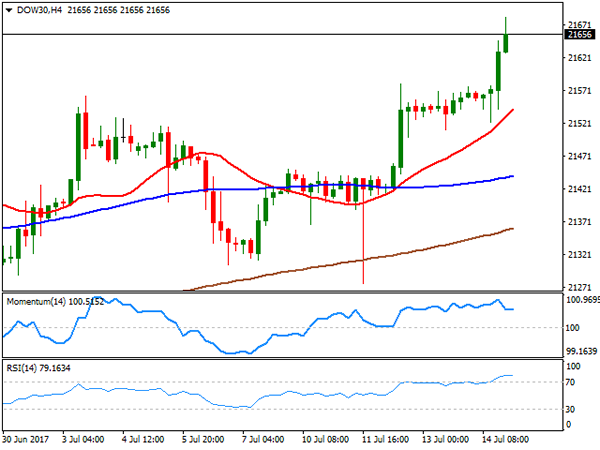
DJIA
Wall Street surged to record highs on Friday, boosted by poor US data on speculation that it will force the Fed to ease its tightening bias. The Dow Jones Industrial Average and the S&P settled at record highs, with the first up 84 points to 21,637.74 and the second adding 0.47% to 2,459.27. The Nasdaq Composite added 11 points, to close the day at 2,459.27. Financial equities were the worst performers in the country, on earning reports. JPMorgan reported much better-than-expected second quarter earnings, but the bank lowered its net interest income forecast for the year, while Wells Fargo also beat on earnings, but revenues were below expectations. Finally, Citigroup also reported good results for Q2, but the bank reported a slowdown in its trading results. Within the DJIA JP Morgan was the worst performer, down 0.91%, while Wal-Mart led advancers, up 1.72%. Technically, the Dow daily chart shows that the index settled far above all of its moving averages, with the RSI indicator heading north around 67, and the Momentum lacking directional strength within positive territory. In the 4 hours chart, technical indicators eased modestly within overbought territory, whilst the 20 SMA surged above the largest, acting as dynamic support some 100 points below the current level. The index traded as high as 21,682 intraday, the immediate resistance and the level to break to open doors for an extension towards 22,000 this upcoming week.
Support levels: 21,628 21,576 21,531
Resistance levels: 21,682 21,735 21,780
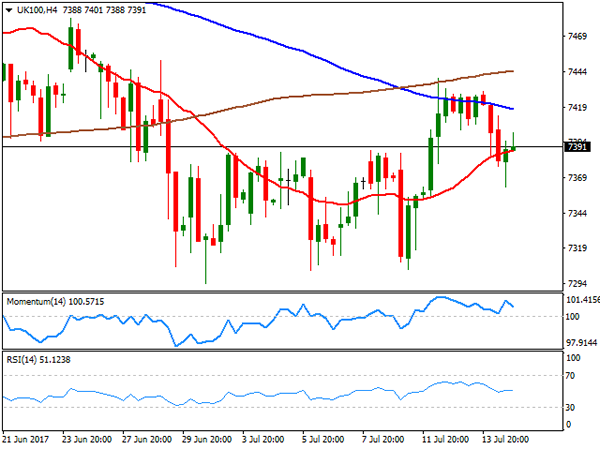
FTSE100
The FTSE 100 closed at 7,378.39, down 0.47% or 34 points last Friday, despite the strong performance of mining-related equities, as a resurgent Pound weighed on its export-oriented components. Anglo American was the best performer, adding 2.10%, while Fresnillo and Randgold Resources added over 1%each, also making it to the top ten list. Barratt Developments led decliners with a 2.50% loss, followed by Royal Mail that shed 2.43%, after presenting a new pension proposal, while the company with a "sell" rating. Technical readings in the daily chart favor the downside, as the index settled a few points below a bearish 20 DMA, whilst technical indicators resumed their declines after failing to surpass their mid-lines. In the 4 hours chart, the index is below its 100 and 200 SMAs and around a bullish 20 SMA, whilst technical indicators hover within positive territory, without clear directional strength, failing to provide directional clues.
Support levels: 7,362 7,333 7,304
Resistance levels: 7,413 7,439 7,482
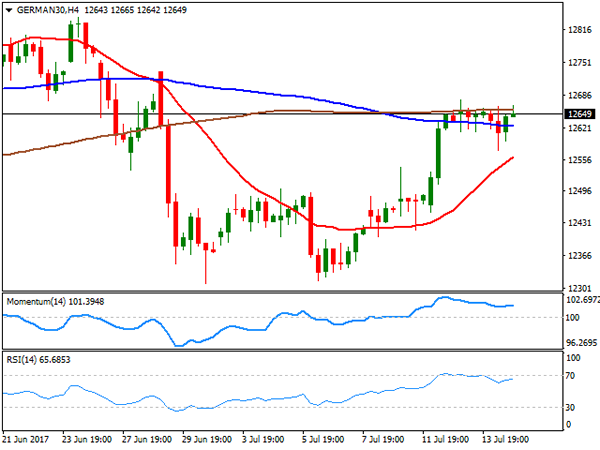
DAX
The German DAX closed 9 points or 0.08% lower on Friday at 12,631.72, as European equities were weighed down by the poor performance of the banking sector, hit my earning reports from their overseas counterparts. In Germany, Commerzbank led decliners with a 1.10% lost, followed by Bayerische Motoren that shed 1.06%. Volkswagen led advancers, up 1.08%, followed by BASF that added 0.92%. The pharmaceutical sector advanced, which helped limiting losses. Despite Friday's slide, the index closed sharply up for the week, but presents a neutral stance according to technical readings, given that in the daily chart, the index stands a few points above a modestly bearish 20 DMA, while technical indicators hold flat around their mid-lines. In the 4 hours chart, the 20 SMA heads sharply higher below the current level, but the index continues hovering around directionless 100 and 200 SMAs, whilst technical indicators lack directional strength, but hold well above their mid-lines. The index topped last week at 12,677, now the immediate resistance and the level to break to see further gains during the upcoming sessions.
Support levels: 12,617 12,565 12,521
Resistance levels: 12,689 12,732 12,774