Sample Category Title
Market Update – European Session: UK And EU Begin 1st Full Round Of Brexit Talks, Euro Zone Jun CPI...
Notes/Observations
UK and EU begin first full round of Brexit talks
Euro Zone Jun Final CPI unrevised and below the target for the 3rd straight month ahead of Thursday's ECB meeting
China Q2 GDP growth tops forecasts on strong investment, consumption
Overnight
Asia:
China Q2 GDP growth beats expectations (YoY: 6.9% v 6.8%e and compares to 6.5% 2017 target); Also Jun Industrial Production and Retail sales beat consensus
China President Xi: PBOC will play a stronger role in defending against risks. Prudent monetary policy should be firmly implemented and the PBOC should take a stronger macro-prudential policy role (prudent policy was tweaked back in Dec 2016 to be more neutral)
China Stats Bureau (NBS): Prudent and neutral monetary policy will provide necessary liquidity in the economy, but also prevent rise in debt levels. Saw no problem for 2017 CPI growth to be below 3%; expected China CPI to remain benign
Europe:
UK Chancellor of Exchequer Hammond (Fin Min): Brexit transition period likely to need a couple of years; crucial to get deal that protects jobs and prosperity
UK Trade Min Fox: Happy to have a time-limited transition period with EU as long as we leave the EU in March 2019
UK July Rightmove Housing Prices improve (M/M: +0.1% v -0.4% prior; Y/Y: 2.8% v 1.8% prior)
Germany Chancellor Merkel: intends to serve full 4-yearterm if re-elected. Germany has already increased investment and has put aside additional money for more investment on roads, digitization and education in med-term budget plans
Germany Social Democrats (SPD) leader Schultz 10-point plan for a modern Germany noted that the country must be prepared to do more in Europe, possibly contribute more money to EU budget
Italy Finance Ministry said to be planning to revise growth estimates higher in coming weeks
Canadian ratings agency DBRS affirmed Italy sovereign ratings at BBB (high), Stable trend
Greece Debt Agency (PDMA) could be ready to tap bond markets as early as this month (**Note: Poised to borrow money from investors for the first time since 2014)
Americas:
US Senate said to consider delay consideration of healthcare legislation by Senator McCain recovers from eye surgery
Energy:
(US) Weekly Baker Hughes US Rig Count: 952 v 952 w/w (unchanged w/w)
Economic Data
(EU) Euro Zone Jun CPI M/M: 0.0% v 0.0%e; Y/Y (Final): 1.3% v 1.3%e, Core CPI Y/Y (Final) 1.1% v 1.1%e
Fixed Income Issuance:
None seen
SPEAKERS/FIXED INCOME/FX/COMMODITIES/ERRATUM
Equities
Indices [Stoxx50 flat at 3,527, FTSE -0.3% at 7,388, DAX -0.1% at 12,637, CAC-40 -0.1% at 5,240, IBEX-35 +0.2% at 10,677, FTSE MIB flat at 21.531, SMI %+0.2 at 9.026, S&P futures -0.1%]
Market Focal Points/Key Themes: European Indices have reversed earlier gains trading largely lower across the board with the exception of the FTSE 100 which trades higher. Earnings were the dominant theme this morning with Scandinavian names Getinge, Atlas Copco and Telenor reported results, elsewhere ITV names former Easyjet CEO as its new Chief Exec. GEA Group trades sharply lower after its prelim numbers and lowering of guidance. Looking to the US morning, notable earners include Blackrock
Equities
Consumer discretionary [ ITV [ITV.UK] +3.3% (New CEO)]
Financials [LSL Property Services [LSL.UK] +11% (Trading update)]
Healthcare [Getinge [GETIB.SE] -7% (Earnings) ]
Industrials [Carillion [CLLN.UK] +20% (Contract), Balfour Beaty [BBY.UK] +2.7% (Contract win), SGS [SGS.UK] -3.0% (Earnings), GEA Group [G1A.DE] -6.6% (Earnings), Atlas Copco [ATCOA.SE] -3.5% (Earnings), Weir Grp [WEIR..UK] +8% (Raises outlook) ]
Telecom [Telenor [TEL.NO] +7% (Earnings, buyback)]
Speakers
UK's Davis: Had a good start in June with talks; now entering substance; important to make progress
EU's Barnier: Need to examine and compare positions to make progress
Poland Central Bank's Zubelewicz said to oppose waiting for rate hike until CPI hits 2.5%. Wanted a rate hike soon then keep policy steady until mid-201. Believed that 2.5% inflation target was too high and weakens the PLN currency (Zloty)
Currencies
USD consolidated its recent spat of softness against the major pairs as rate hike expectations have been pared after the recent US inflation data. The USD Index moved off 10-month lows in the session.
Brexit Min Davis met EU's Barnier in Brussels for first full round of Brexit talks. GBP/USD holding below the 1.31 level. GBP was firmer in recent sessions as UK govt was seen as more seen flexible on immigration aspects in talks
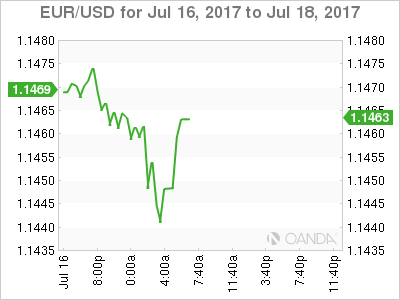
EUR/USD was fractionally lower at 1.1450 as Euro Zone data keeps argument for steady ECB policy this week.
Fixed Income
Bund futures trade at 161.33 up 26 ticks as European government bonds are supported with cash flows for the month remaining very supportive. The focus will be on ECB this week. Resistance lies near the 161.50 level followed by 162.10. A break of the 160.00 support level could see lows target 159.25 followed by 157.50.
Gilt futures trade at 125.27 higher by 16 ticks as economic pessimism in the UK grows in comparison to the euro area. Price finds key support at the 124.42 support level. An acceleration lower could test the 122.88 region. Resistance remains the noted 126.00 region, followed by 126.72.
Monday's liquidity report showed Friday's excess liquidity rose to €1.669T a gain of €32B from €1.637T prior. Use of the marginal lending facility fell to €230M from €192M prior.
Corporate issuance saw $26B issued last week. Next week's forecast is $30B
Looking Ahead
05:30 (NL) Netherlands Debt Agency (DSTA) to sell up to €2B in 3-month bills
06:00 (IE) Ireland May Trade Balance: No est v €3.4B prior
06:45 (US) Daily Libor Fixing
07:00 (BR) Brazil July FGV Inflation IGP-10 M/M: No est v -0.6% prior
07:00 (IN) India announces details of upcoming bond sale (held on Fridays)
07:25 (BR) Brazil Central Bank Weekly Economists Survey
07:30 (TR) Turkey TCMB Survey of Expectations
08:00 (ES) Spain Debt Agency (Tesoro) announces size of upcoming actions in week (if any)
08:15 (UK) Baltic Dry Bulk Index
08:30 (US) July Empire Manufacturing 15.0e v 19.8 prior
08:30 (CA) Canada May Int'l Securities Transactions: No est v C$10.6B prior
09:00 (CA) Canada Jun Existing Home Sales M/M: No est v -6.2% prior
09:00 (FR) France Debt Agency (AFT) to sell combined €4.8-6.0B in 3-month, 6-month and 12-month Bills
09:30 (EU) ECB announces Covered-Bond Purchases
09:35 (EU) ECB calls for bids in 7-Day Main Refinancing Tender
16:00 (US) Weekly Crop Progress Report
ECB To Turn On The Dollar
Monday July 17: Five things the markets are talking about
The markets focus this week shift away from Yellen's testimony and disappointing U.S data to the ECB meeting (Thursday, July 21), which is expected to result in a further modest adjustment in its risk assessment.
Last week, the Fed chief seemed to hint that she was starting to second-guess whether the recent softness in inflation was just due to 'transitory' factors.
Friday's disappointing U.S CPI and retail sales prints again provides the Fed a mixed picture that is likely to leave the Fed cautious, and it is little wonder markets have lowered the odds of further rate hikes this year (40% for a Dec. hike). Will it delay the start of the Fed's balance sheet normalization as well?
The market will be looking for signs that the ECB (July 20, 07:45 am EDT) will follow the Fed and begin to curtail its stimulus. No change is expected from the Bank of Japan either early Thursday (July 19).
Elsewhere this week, in Canada, traders will be looking for strength from the consumer in May retail sales data Friday. Australia's RBA on Tuesday will release minutes of its July 4 gathering and labor market data is due Thursday. In the U.K, round two of Brexit talks get underway in Brussels today.
1. Stocks mixed results
Fed Chair Yellen's remarks were interpreted as evidence of continued accommodative monetary policy, and from there, global stocks have record multi-month highs.
Note: Japan was closed for a National holiday.
In Hong Kong, stocks rallied for the sixth consecutive session, closing at fresh two-year highs, with sentiment aided by robust China economic growth data (see below) and signs Chinese money inflows are accelerating. The Hang Seng index rose +0.3%, while the China Enterprises Index gained +0.5%.
In China, the Shanghai Composite Index was down -1.4% amid concerns over the implications of a weekend meeting where President Xi Jinping indicated that the PBoC would play a greater role in defending against risks.
Note: At one point the intraday losses were greater than -5%, but he loses were later reversed when Q2 GDP, June industrial production and retail sales came in strong.
Elsewhere, South Korea's Kospi rallied +0.4%, while Australia's S&P/ASX was down -0.2%.
In Europe, most indices have reversed earlier gains trading largely lower across the board with the exception of the FTSE 100. Earnings have been the dominant theme this morning and will be in the U.S all week.
U.S stocks are set to open in the red (-0.1%).
Indices: Stoxx50 flat at 3,527, FTSE -0.3% at 7,388, DAX -0.1% at 12,637, CAC-40 -0.1% at 5,240, IBEX-35 +0.2% at 10,677, FTSE MIB flat at 21.531, SMI %+0.2 at 9.026, S&P futures -0.1%
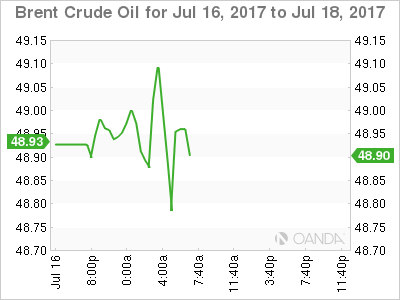
2. Oil higher on U.S drilling slowdown, gold little changed
Ahead of the U.S open, oil is better bid as a slowdown in the growth of U.S rigs drilling have eased concern that surging shale supplies will undermine OPEC-led cuts.
Note: Friday's Baker Hughes report showed that U.S drillers added two oilrigs in the week to July 14, bringing the total to 765 – rig additions over the past month averaged five, the lowest total in nine-months.
Brent crude is up +19c at +$49.10 a barrel, while U.S crude (WTI) is trading at +$46.71, up +17c.
Note: Oil prices continue to trade at half their mid-2014 level because of a persistent glut even after the OPEC, plus Russia started a supply-cutting pact seven months ago.
Also providing support is U.S crude oil inventories in the week to July 7 dropped the most in ten-months – is market rebalancing under way?
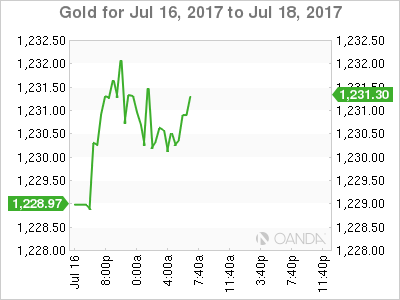
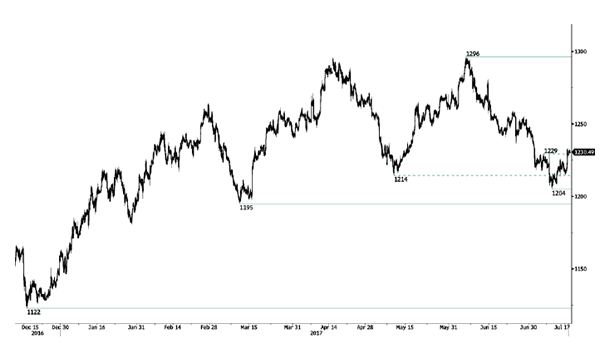
Gold prices (+0.2% to +$1,230.43 per ounce) inches up as prospects for slower U.S rate hikes weigh on the dollar.
3. Yields wait on Central Banks
What to expect from the European Central Bank (ECB) and Bank of Japan (BoJ)?
The market consensus does not believe that the ECB will provide any hints of policy tightening on Thursday.
Many believe that the ECB is still worried about the 'mini taper tantrum' following ECB President Draghi's speech in late June which resulted in a sharp move in yields (Bund 10-years went from -0.25% to +0.58%) and a rapid appreciation of the EUR (€1.1186-€1.1442).
Forward guidance of its exit strategy is expected at the September policy meeting.
The Bank of Japan (BoJ) is expected to stand pat, proceeding with yield control policy.
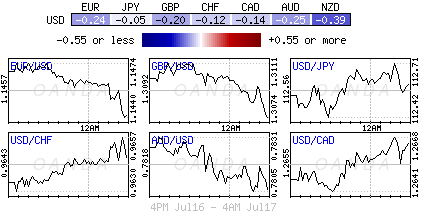
4. Dollar nurses losses
The 'mighty' dollar continues to flounder atop of its 10-month lows vs. G10 currency pairs as investors cheer upbeat Chinese data (see below) by piling into leveraged positions such as the AUD (A$0.7817), CAD (C$1.2662) and other high-yielding currencies.
U.K's Brexit Minister Davis is in Brussels for the first full round of Brexit talks. GBP/USD is holding below the psychological £1.31 level, down -0.3% at £1.3066. The pound had been firmer in recent sessions as U.K government was seen as being more seen flexible on immigration aspects in talks.
The EUR/USD is a tad lower ahead of the U.S open at €1.1450 as Euro Zone inflation data this morning (see below) keeps the argument for a steady ECB policy this week.
5. China data robust, Euro reports as expected
Data overnight saw China's Q2 GDP topping forecasts with a rise of +6.9% on the year (vs. +6.5% 2017 target), while retail sale (+11% vs. +10.6%) and industrial output (+7.6% vs. +6.5%) were both strong.
Also China's President Xi indicated that the PBoC would play a stronger role in defending against risks. Prudent monetary policy should be firmly implemented and the PBOC should take a stronger macro-prudential policy role.
In Europe, June's Final CPI (+1.3%, y/y) was unrevised and below the target for the third consecutive month ahead of Thursday's ECB meeting.
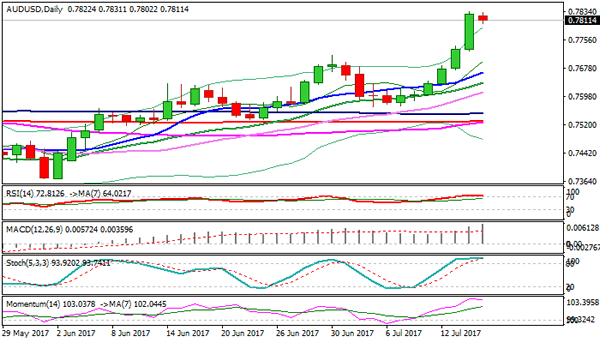
Technical Outlook: AUDUSD – Risk Of Deeper Pullback On Overbought Studies Remain In Play
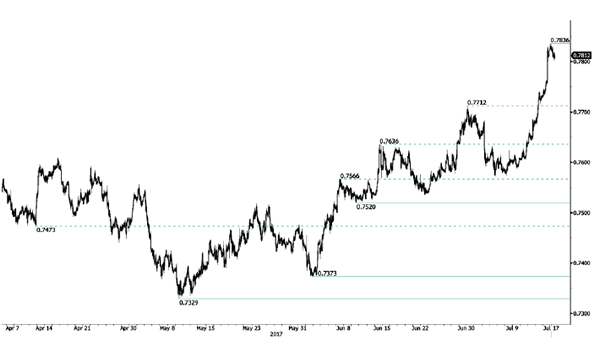
The Aussie is holding within the tight range after failing to benefit on upbeat Chinese data. The pair stays below Friday's high at 0.7833 (the highest since 21 Apr 2016), but psychological 0.7800 support limits the downside attempts on minor profit taking for now.
Overbought daily studies warn of deeper correction following last week's strong rally (the pair was up nearly 3% for the week), but so far lacking stronger signal. Firm break below 0.7800 handle is needed to trigger fresh bearish acceleration and expose supports at 0.7772/33 (Fibo 23.6% and 38.2% of 0.7572/0.7833 upleg) respectively.
Upper break points at 0.7833 (21 Apr 2016 high) and 0.7848 9Fibo 38.2% of 0.9503/0.6825 descend) remain in near-term focus.
Res: 0.7833, 0.7848, 0.7907, 0.7940
Sup: 0.7800, 0.7772, 0.7733, 0.7702
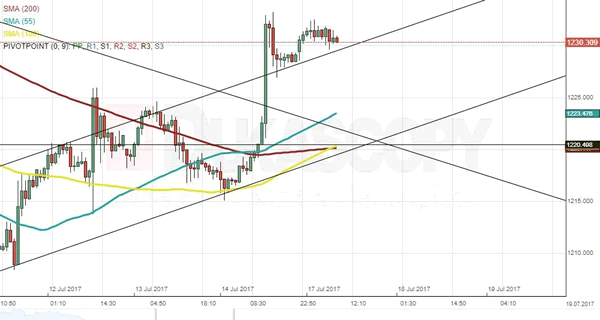
XAU/USD Analysis: Breaks Patterns
Fundamental data released and covered on Friday by the Dukascopy research team on the live webinar platform has forced the yellow metal’s price higher. The US Consumer Price Index data sets, which were released as much lower than expected, were the cause of the jump. As a result of the jump the junior and dominant channels were broken. However, it could be observed on Monday morning that the upper trend line of the ascending channel had begun to provide support to the commodity price. Due to these reasons combined it can be expected that the gold price will continue to surge. However, the situation all in all has to be reviewed fully, as the underlying strength of both financial instruments has changed.
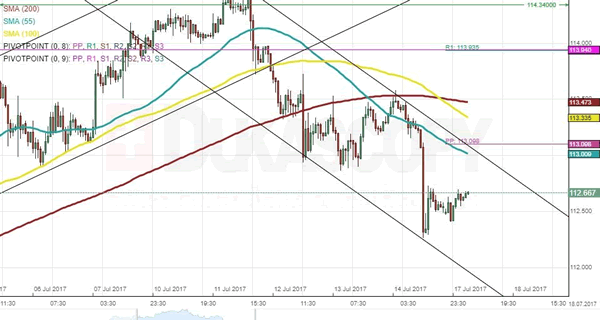
USD/JPY Analysis: Recovers Losses
The Friday's trading session for the USD/JPY currency pair started rather calmly, as it remained in the 113.50/20 range. However, bears started to pressure the pair even before US CPI and Retail Sales at 1230GMT in anticipation of weak data. These disappointing expectations realised, setting the US Dollar for a 55-pip fall in one minute. The American currency did manage to recover some losses; however, failed to overcome the 112.70 mark. It is expected that bulls may succeed at pushing the rate slightly higher in this session. Taking into account that it has formed a channel down, gains may be capped near the 112.70/80 mark or, if this level is surpassed, then at the 55-hour SMA circa 113.10. In general, the market is likely to be rather calm today, thus resulting in a lack of volatility for the pair.
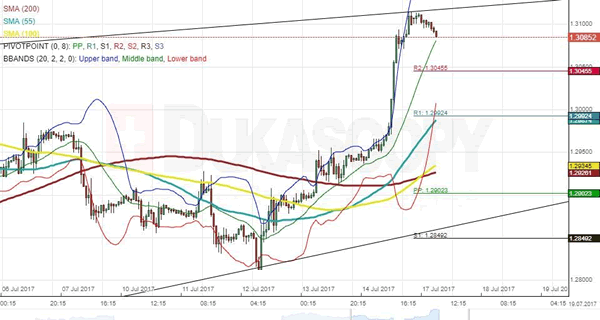
GBP/USD Analysis: Changes Direction
The slight appreciation that guided GBP/USD since last Wednesday changed tremendously mid-Friday when the Pound surged against the US Dollar for three consecutive hours, thus closing the session with a 158-pip gain. This appreciation, however, was not sustainable, as the power game between bears and bulls normalised. On Monday morning, the Sterling demonstrated increasing signs that the upward momentum was over, as technical indicators were starting to retrace from the strongly bullish area. Thus, a rising wedge patter was revealed. It is not yet said that the pair will depreciate with high velocity, as there are no significant data released today that could pressure it either direction. Thus, it is likely that the Sterling remains fluctuating around the 20-hour SMA in the 1.3100/10 area.
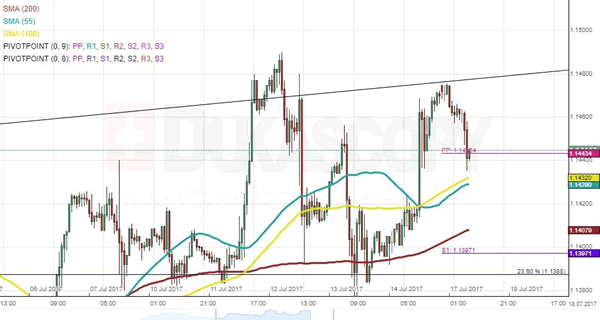
EUR/USD Analysis: Is About To Be Squeezed In
On Monday morning the common European currency had lost ground against the US Dollar. The pair had retreated below the freshly calculated weekly PP, which is located at the 1.1443 mark. Due to that reason the weekly PP could be considered as a resistance level. However, the currency exchange rate was about to be approached from the downside by the 55 and 100-hour SMAs, which both fluctuated at the 1.1430 mark. It is most likely that the pair will get squeezed in between the mentioned level of significance and pressure will begin to build up. Although, it can be clearly observed that the pressure could cause only a break out to the upside. Meanwhile, it is also possible that the rate does not get squeezed in at all, and a surge would begin as soon as the rate is approached by the SMAs.
GOLD Short-Term Bullish Momentum Arises, SILVER Back Within Former Downtrend Channel, CRUDE OIL Pushing Higher.
GOLD Short-term bullish momentum arises.
Gold's is trading mixed after the precious metal reached the $1200 level. Hourly support is now given at $1204 (10/07/2017 high). Hourly resistance at 1229 (06/07/2017 high) has been broken. Expected to show further strengthening.
In the long-term, the technical structure suggests that there is a growing upside momentum. A break of 1392 (17/03/2014) is necessary ton confirm it, A major support can be found at 1045 (05/02/2010 low)
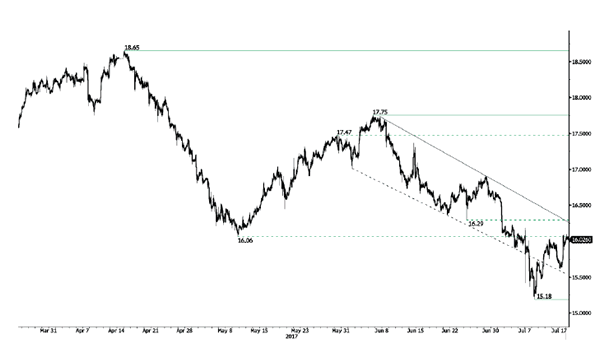
SILVER Back within former downtrend channel.
Silver is still bouncing from hourly support given at 15.18 (10/07/2017 low). Key resistance is given at a distance at 17.75 (06/06/2017 high). The road seems wide open for renewed weakness.
In the long-term, the death cross indicates that further downsides are very likely. Resistance is located at 25.11 (28/08/2013 high). Strong support can be found at 11.75 (20/04/2009).
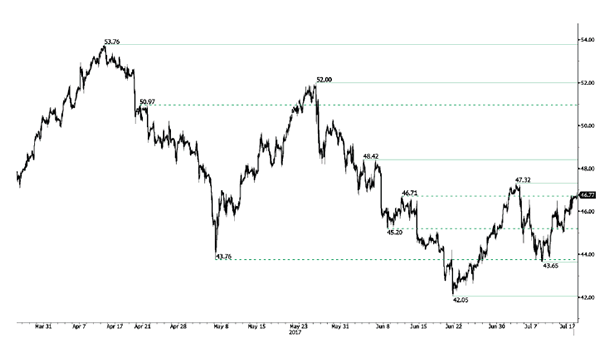
CRUDE OIL Pushing higher.
Crude oil is trading higher. Hourly support is given at 43.65 (10/07/2017 low). Expected to monitor resistance given at 47.32 (04/07/2017).
In the long-term, crude oil has recovered after its sharp decline last year. However, we consider that further weakness are very likely. Strong support lies at 35.24 (05/04/2016) while resistance can now be found at 55.24 (03/01/2017 high).
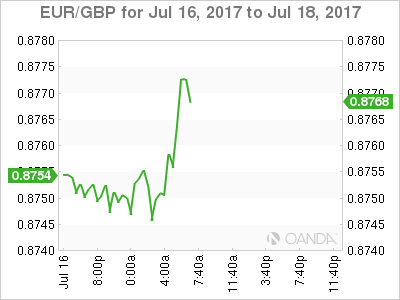
EUR/GBP Weakening, EUR/CHF Buying Pressures Continues, BITCOIN Ready For A Short-Term Bullish Consolidation.
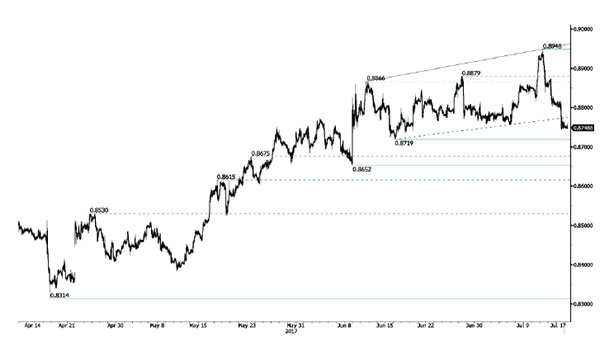
EUR/GBP Weakening.
EUR/GBP has broken uptrend channel. Hourly support is given at 0.8719 (16/06/2017 low). Expected to show further monitoring of support given at 0.8719.
In the long-term, the pair has largely recovered from recent lows in 2015. The technical structure suggests a growing upside momentum. The pair is trading above from its 200 DMA. Strong resistance can be found at 0.9500 psychological level.
EUR/CHF Buying pressures continues.
EUR/CHF is still trading above psychological level at 1.1000. Selling pressures are very weak at the moment. Hourly support is located at a distance at 1.0922 (30/06/2017 low). Expected to inch higher.
In the longer term, the technical structure is mixed. Resistance can be found at 1.1200 (04/02/2015 high). Yet,the ECB's QE programme is likely to cause persistent selling pressures on the euro, which should weigh on EUR/CHF. Supports can be found at 1.0184 (28/01/2015 low) and 1.0082 (27/01/2015 low).
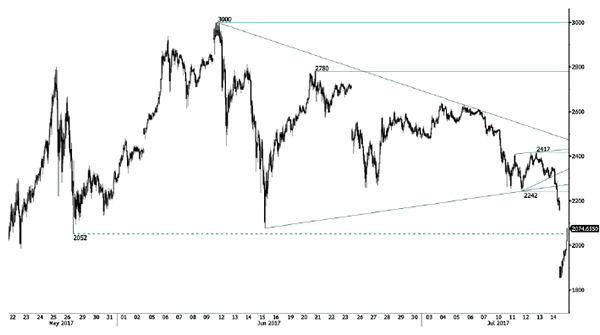
BITCOIN Ready for a short-term bullish consolidation.
Bitcoin has strongly declined over the weekend. Strong hourly resistance can be found at 2417 (13/07/2017 high) and hourly support is now given at 1852 (14/07/2017 low). Expected to show some sustained short-term bullish momentum.
In the long-term, the digital currency has had an exponential growth. There are decent likelihood that the asset will consolidate above $1500. Long-term support is given at $1464 (04/05/2017 low).
USD/CHF Short-Term Bullish, USD/CAD Important Selling Pressures, AUD/USD Buying Pressures Increase Again.
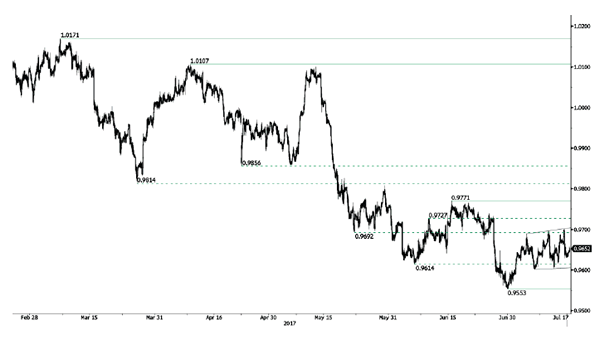
USD/CHF Short-term bullish.
USD/CHF is trading higher within a slight short-term bullish trend. Hourly resistance can be found at 0.9696 (09/06/2017 high). Strong resistance is given at 1.0107 (10/04/2017 high). Hourly support is given at 0.9553 (30/06/2017 low). Expected to inch higher.
In the long-term, the pair is still trading in range since 2011 despite some turmoil when the SNB unpegged the CHF. Key support can be found 0.8986 (30/01/2015 low). The technical structure favours nonetheless a long term bullish bias since the unpeg in January 2015.
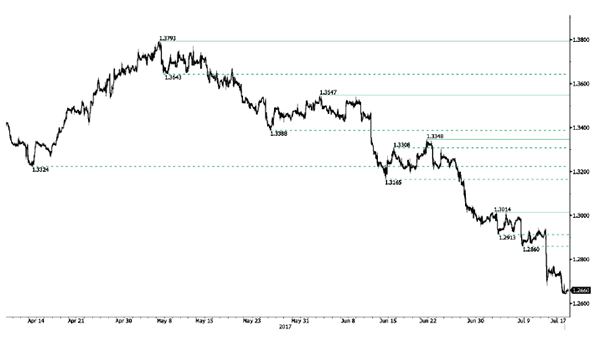
USD/CAD Important selling pressures.
USD/CAD is going lower but the pair remains in a strong bearish momentum. Hourly support is given at 1.2681 (12/07/2017 low). Resistance is located at 1.3014 (02/15/2017). Expected to show continued bearish pressures.
In the longer term, the pair lies in a bullish channel since a year. Strong resistance is given at 1.4690 (22/01/2016 high). Long-term support can be found at 1.2461 (16/03/2015 low).
AUD/USD Buying pressures increase again.
AUD/USD's technical structure is bullish since early May despite some consolidation move. An unlikely break of support at 0.7520 (09/06/2017 low) would nonetheless indicate a renewed bearish trend.
In the long-term, we are waiting for further signs that the current downtrend is ending. Key supports stand at 0.6009 (31/10/2008 low) . A break of the key resistance at 0.8295 (15/01/2015 high) is needed to invalidate our long-term bearish view.