Sample Category Title
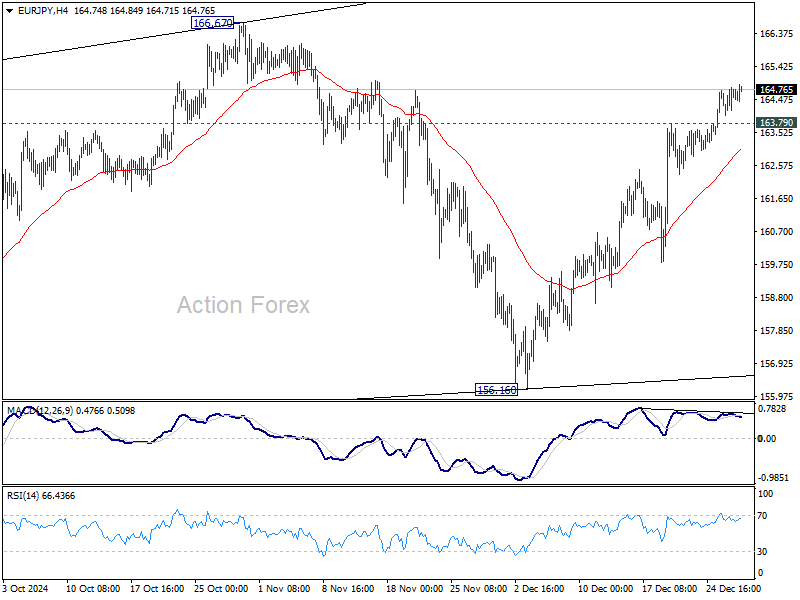
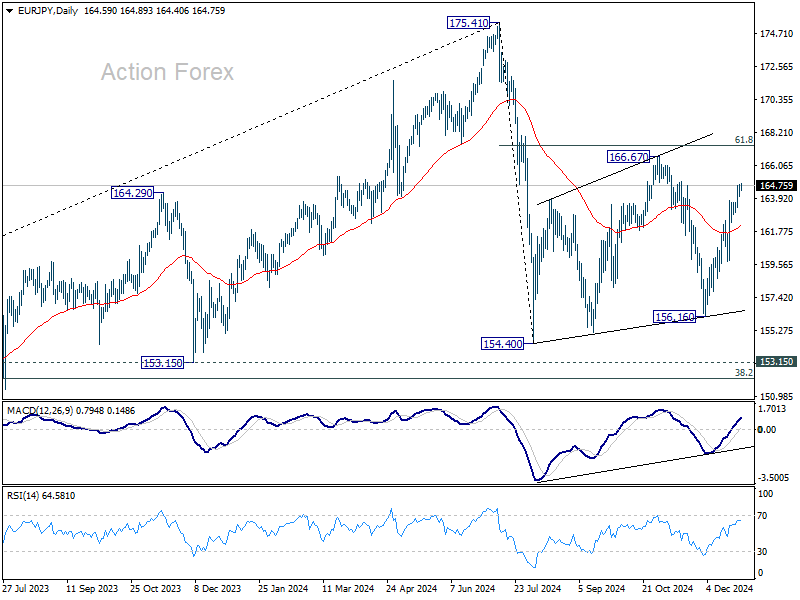
EUR/JPY Daily Outlook
Daily Pivots: (S1) 164.14; (P) 164.49; (R1) 164.94; More...
EUR/JPY's rally from 156.16 is still in progress and intraday bias stays on the upside. Corrective pattern from 154.04 is extending with another rising leg. Further rise should be seen to 166.67 resistance next. On the downside, below 163.79 minor support will turn intraday bias neutral first.
In the bigger picture, price actions from 175.41 are seen as correction to rally from 114.42 (2020 low). The range of consolidation should have been set between 38.2% retracement of 114.42 to 175.41 at 152.11 and 175.41 high. However, decisive break of 152.11 would argue that deeper correction is underway.
EUR/GBP Daily Outlook
Daily Pivots: (S1) 0.8271; (P) 0.8300; (R1) 0.8318; More...
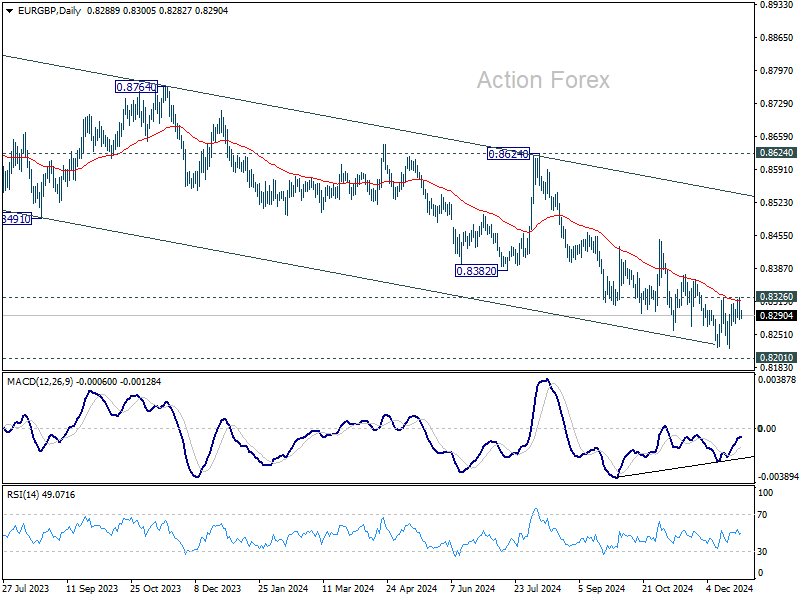
EUR/GBP failed to break through 0.8326 resistance and retreated, and intraday bias stays neutral On the upside, firm break of 0.8326 resistance will confirm short term bottoming at 0.8221, ahead of 0.8201 key support, on bullish convergence condition in 4H MACD. Intraday bias will be turned back to the upside for 0.8446 structural resistance next.
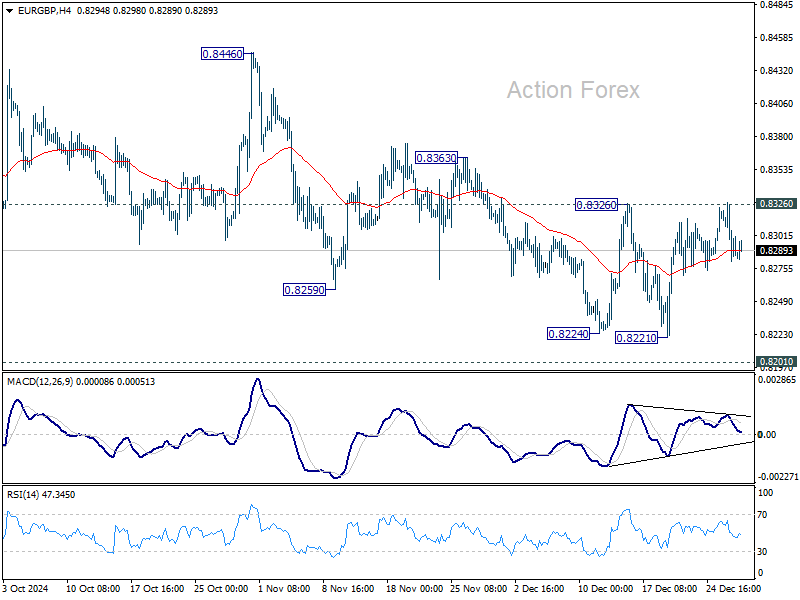
In the bigger picture, focus is now on whether 0.8201 key support (2022 low) is strong enough to complete the whole down trend from 0.9267 (2022 high). In any case, medium term outlook will be neutral at best until decisive break of 0.8624 key resistance. Otherwise, risk will stay on the downside even in case of strong rebound.
EUR/AUD Daily Outlook
Daily Pivots: (S1) 1.6730; (P) 1.6767; (R1) 1.6805; More...
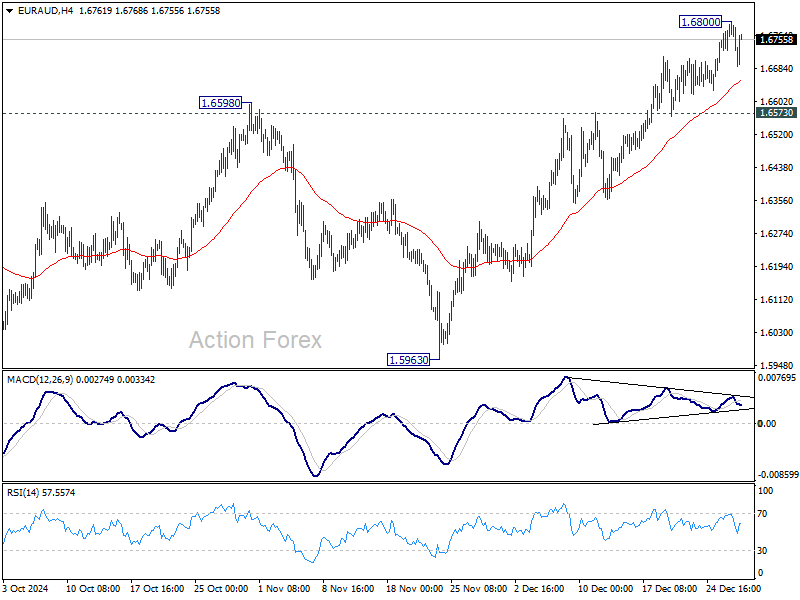
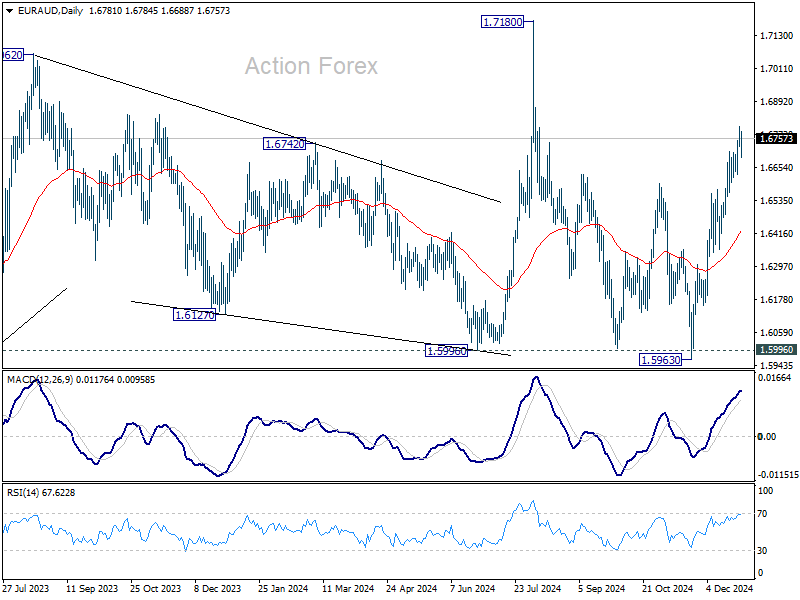
Intraday bias in EUR/AUD is turned neutral with current retreat and some more consolidations would be seen. But further rally is expected as long as 1.6573 resistance turned support holds. Above 1.6800 will resume the rally from 1.5963 to retest 1.7180 high next.
In the bigger picture, EUR/AUD is holding on to 1.5996 key support despite brief breach. Larger up trend from 1.4281 (2022 low) is still in favor to resume through 1.7180 at a later stage. Nevertheless, sustained break of 1.5995 will indicate that such up trend has completed and deeper decline would be seen.
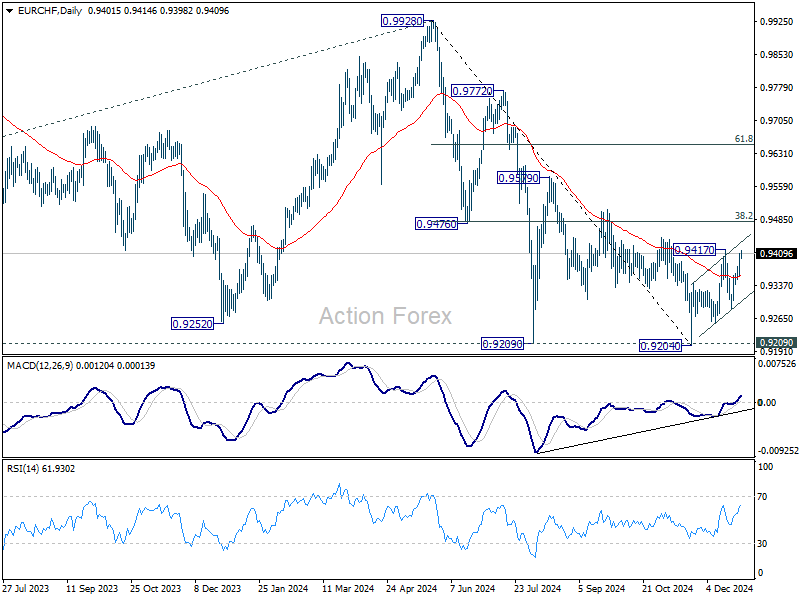
EUR/CHF Daily Outlook
Daily Pivots: (S1) 0.9374; (P) 0.9392; (R1) 0.9424; More....
EUR/CHF's rebound from 0.9284 extended higher and focus is no won 0.9417 resistance. Firm break there will resume the rally from 0.9204 to 0.9481 fibonacci resistance next. On the downside, below 0.9359 minor support will turn intraday bias back to the downside for 0.9284 support instead.
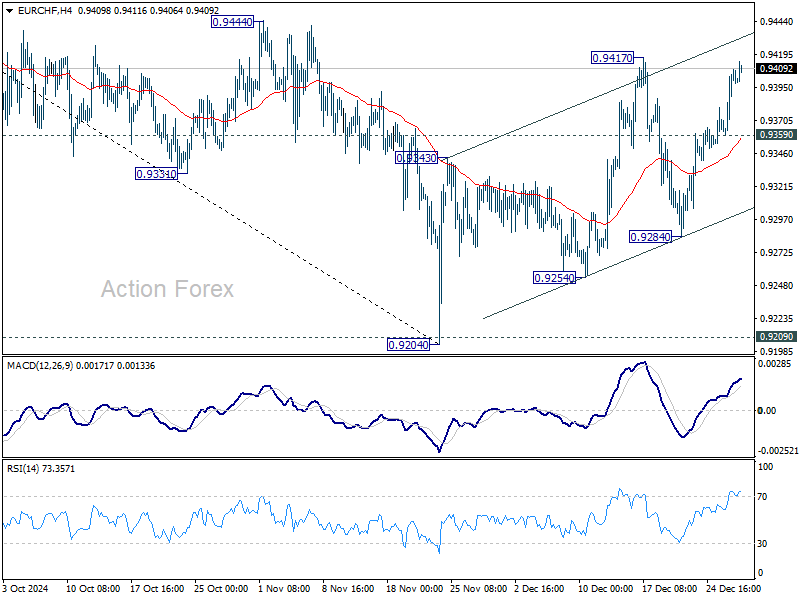
In the bigger picture, a medium term bottom is probably in place at 0.9204. More consolidations would be seen above there with risk of stronger rebound to 38.2% retracement of 0.9928 to 0.9204 at 0.9481. But outlook will remain bearish as long as 0.9481 holds and another fall through 0.9204 to resume larger down trend is in favor.
EUR/USD Tug-of-War Continues, US Dollar Index (DXY) Steady
- EUR/USD remains range bound as the year comes to a close, with the pair trading just above 1.0400.
- ECB policymakers are cautious about future rate cuts due to a sluggish Euro.
- The US Dollar Index (DXY) held its gains last week, supported by positive US data.
- The lack of liquidity may mean that upcoming US economic data (Pending Home Sales and Chicago Purchasing Managers Index) has little impact on the US Dollar.
EUR/USD finished last week on a positive note despite the rise in the US Dollar Index. EUR/USD traded within a 60-pip range last week as thin liquidity kept any significant moves at bay.
This morning EUR/USD has continued its grind, trading just above the 1.0400 handle. Trading conditions remain choppy with the New Year holiday approaching. For now the status quo remains unchanged, leaving EUR/USD confined to last week’s range.
Currency Strength Chart: Strongest – Weakest NZD, AUD, CAD, CHF, GBP, EUR, USD, JPY
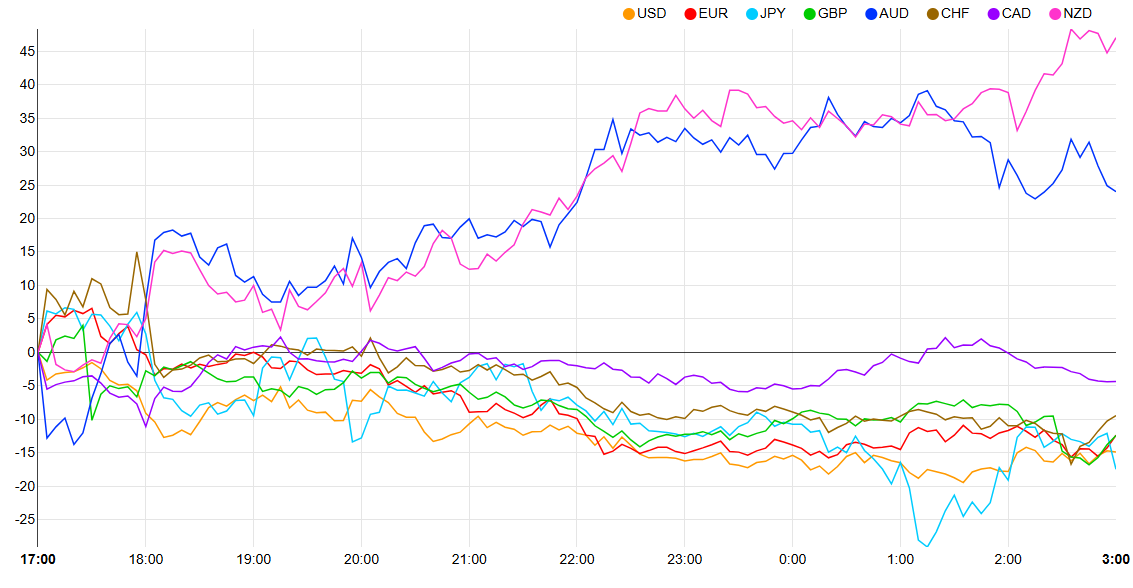
Source: FinancialJuice
ECB Policymakers Lead with Caution
ECB Policymakers of late have been cautious in their rhetoric given the developments heading into 2025. The sluggish Euro Area economy coupled with potential threat of tariffs have left policymakers with a lot to ponder.
The cautious approach by policymakers continued over the weekend. In an interview with the Austrian newspaper Kurier, Robert Holzmann, a member of the European Central Bank’s Governing Council, mentioned that it might be a while before the ECB lowers interest rates again. He noted that some energy prices seem to be rising, but there are other ways inflation could increase, such as if the euro loses more value.
The comments will no doubt add to the Euro’s resilience. This in turn could help cap any downside on EUR/USD and keep the pair rangebound.
US Dollar Index (DXY)
The US Dollar Index (DXY) held onto its gains last week as market liquidity thinned. A sprinkling of positive US Data kept the data supported while concerns over rising rates and Treasury Yields have kept the greenback on the front foot.
Later today, the US economic calendar will include the November Pending Home Sales and the December Chicago Purchasing Managers Index.
The lack of liquidity may mean that the data has very little impact on the US Dollar outlook moving forward.
US Dollar Index (DXY) Daily Chart, December 30, 2024
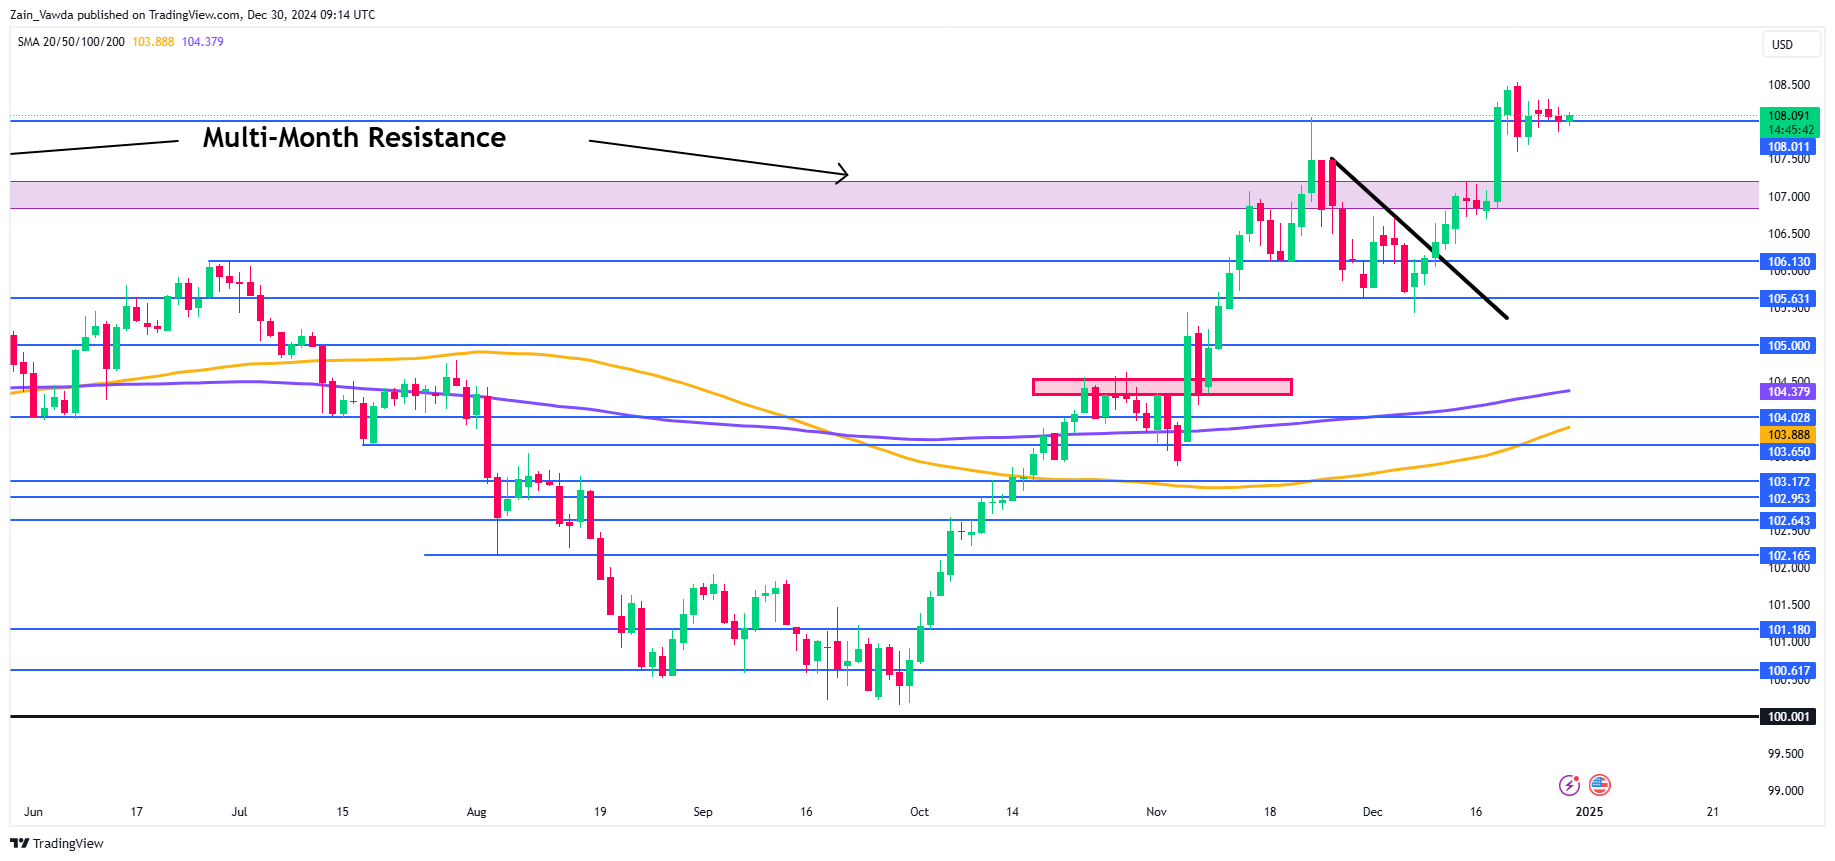
Source:TradingView.com
Technical Analysis on EUR/USD
EUR/USD has struggled for direction since the FOMC selloff on December 18. Since then, EUR/USD has attempted to recover toward the 1.0500 handle but selling pressure persists, capping further upside.
Price action last week saw EUR/USD confined to a range of around 60 pips between the 1.0440 and 1.0380. A break of this range is needed to provide some insights into where the pair may go next.
This week however, has echoes of last week with the New Year holiday and this liquidity. Thus the question is are we in for another week of rangebound price action or will a breakout materialize.
Immediate support rests at 1.0400 before last weeks lows around 1.0380 comes into focus.
Looking at the upside and immediate resistance rests at 1.0440 before the key 1.0500 handle becomes the main area of interest. A break above this 1.0500 handle may lead to further gains as it would indicate a change in structure, potentially putting bulls in control.
EUR/USD Daily Chart, December 30, 2024
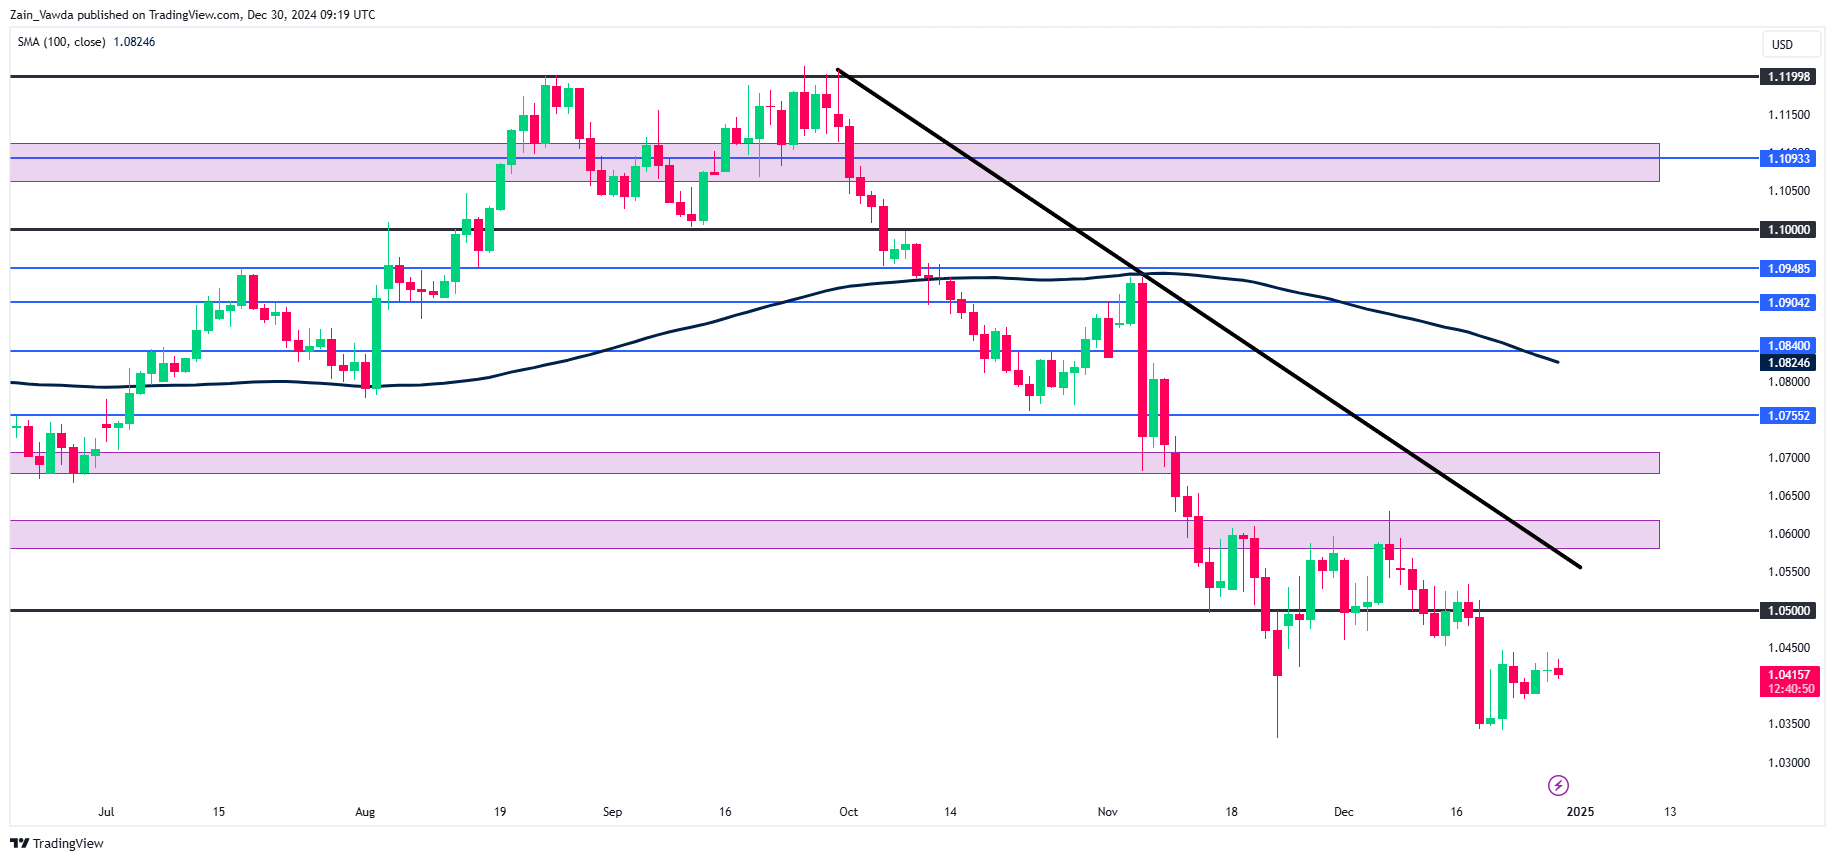
Source:TradingView.com
Support
- 1.0400
- 1.0380
- 1.0331
Resistance
- 1.0440
- 1.0500
- 1.0600
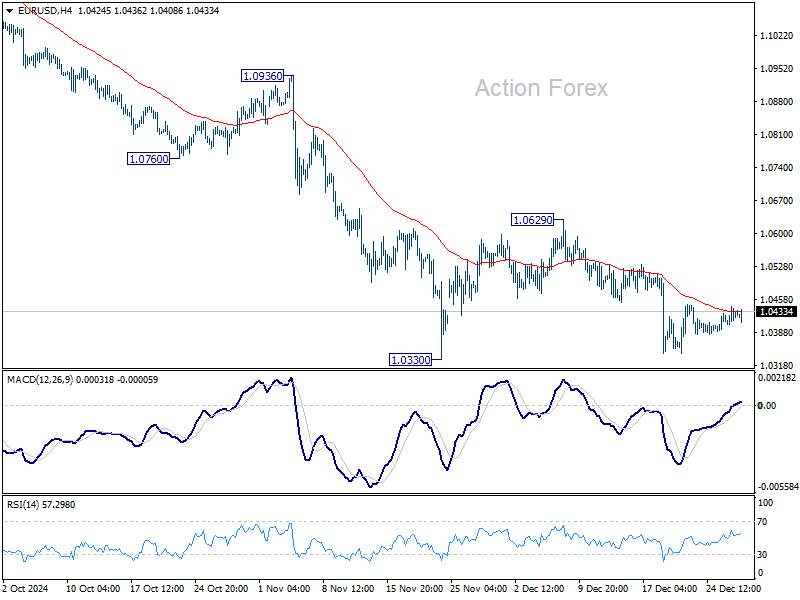
EUR/USD Daily Outlook
Daily Pivots: (S1) 1.0404; (P) 1.0424; (R1) 1.0443; More...
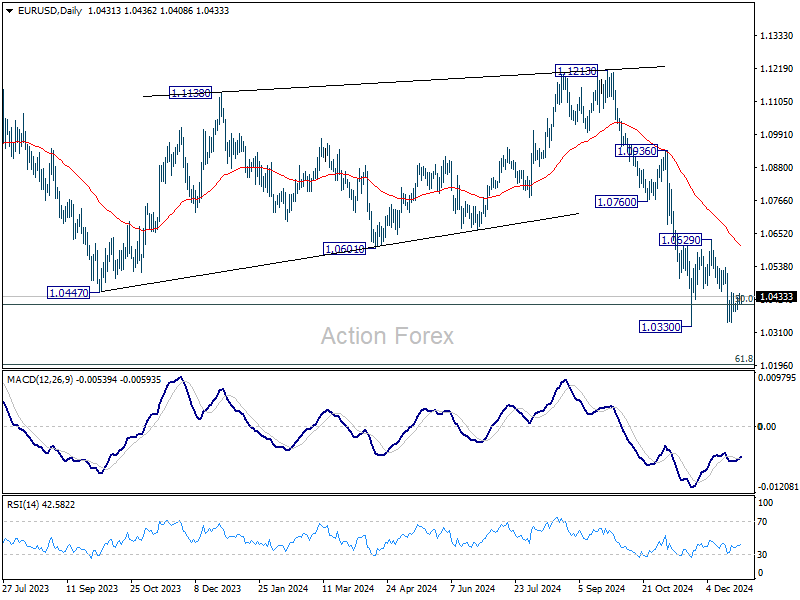
Sideway trading continues in EUR/USD and intraday bias remains neutral for the moment. Stronger recovery cannot be ruled out, but outlook will remain bearish as long as 1.0629 resistance holds. Firm break of 1.0330 will confirm resumption of whole decline from 1.1213. Sustained trading below 1.0404 fibonacci level will carry larger bearish implications.
In the bigger picture, focus stays on 50% retracement of 0.9534 (2022 low) to 1.1274 at 1.0404. Strong rebound from this level will keep price actions from 1.1273 (2023 high) as a medium term consolidation pattern only. However, sustained break of 1.0404 will raise the chance that whole up trend from 0.9534 has reversed. That would pave the way to 61.8% retracement at 1.0199 first. Firm break there will target 0.9534 low again.
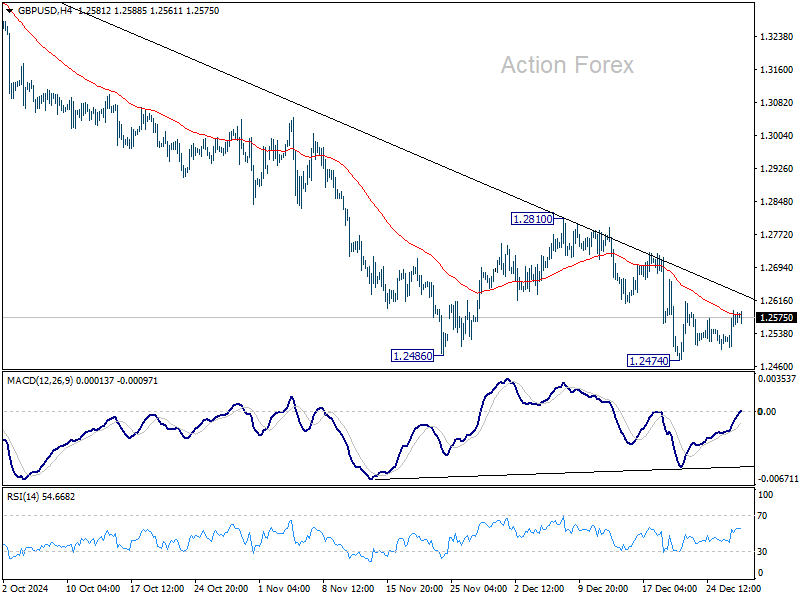
GBP/USD Daily Outlook
Daily Pivots: (S1) 1.2526; (P) 1.2559; (R1) 1.2614; More...
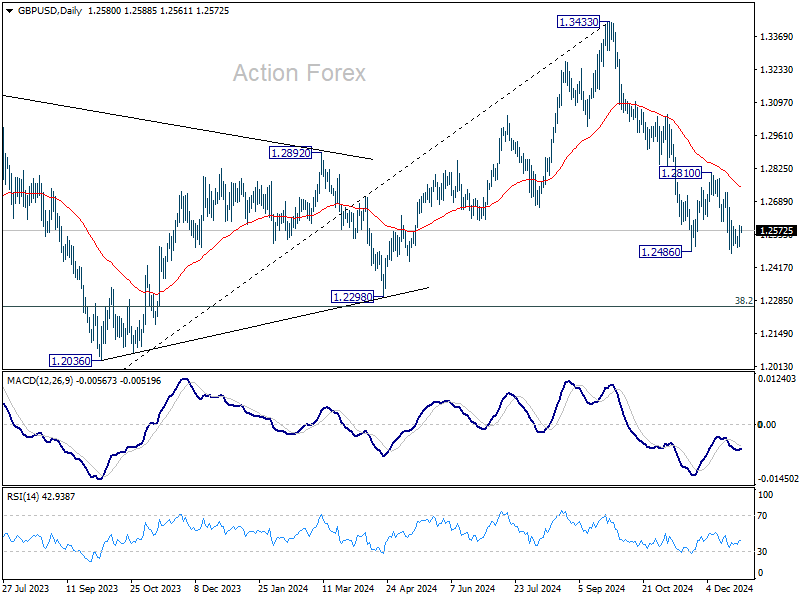
GBP/USD is staying in consolidations and intraday bias remains neutral at this point. While another recovery cannot be ruled out, outlook will stay bearish as long as 1.2810 resistance holds. On the downside, break of 1.2474 will resume the fall from 1.3433 to 1.2298 cluster support zone.
In the bigger picture, price actions from 1.3433 medium term are seen as correcting whole up trend from 1.0351 (2022 low). Deeper decline could be seen to 38.2% retracement of 1.0351 to 1.3433 at 1.2256, which is close to 1.2298 structural support. But strong support is expected there to bring rebound to extend the corrective pattern.
USD/CHF Daily Outlook
Daily Pivots: (S1) 0.8995; (P) 0.9011; (R1) 0.9038; More…
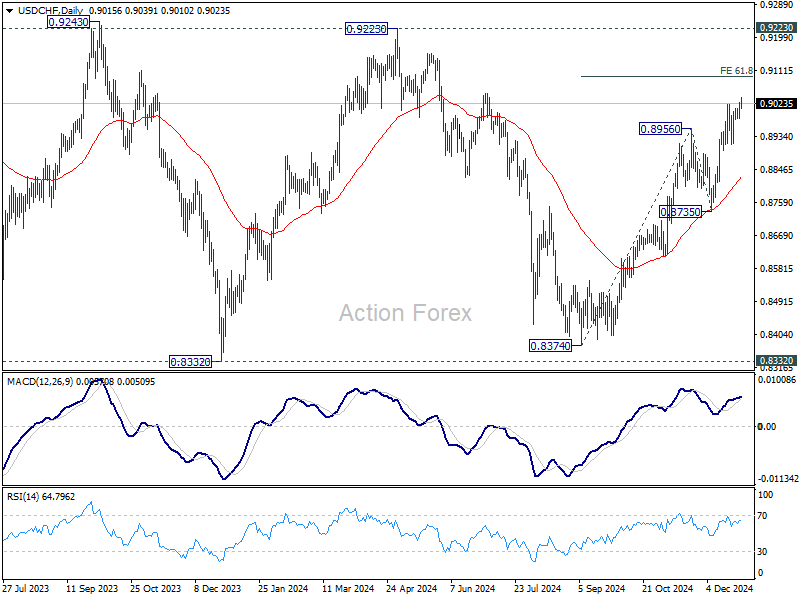
Intraday bias in USD/CHF is back on the upside with breach of 0.9020 temporary top. Rise from 0.8374 is resuming for 61.8% projection of 0.8374 to 0.8956 from 0.8735 at 0.9095. On the downside, below 0.8983 minor support will turn bias neutral and bring consolidations again first.
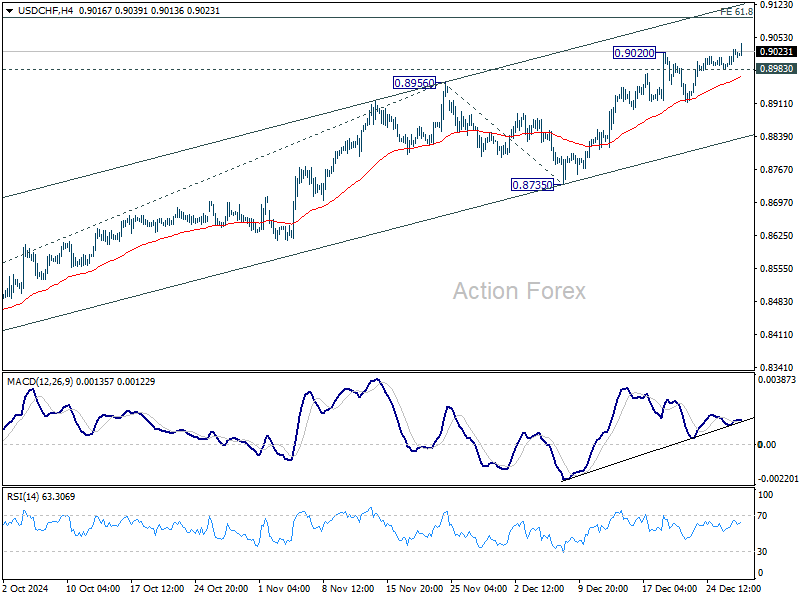
In the bigger picture, price actions from 0.8332 (2023 low) are currently seen as a medium term corrective pattern, with rise from 0.8374 as the third leg. Overall outlook will continue to stay bearish as long as 0.9223 resistance holds. Break of 0.8332 low is in favor at a later stage when the consolidation completes.
USD/JPY Daily Outlook
Daily Pivots: (S1) 157.49; (P) 157.74; (R1) 158.14; More...
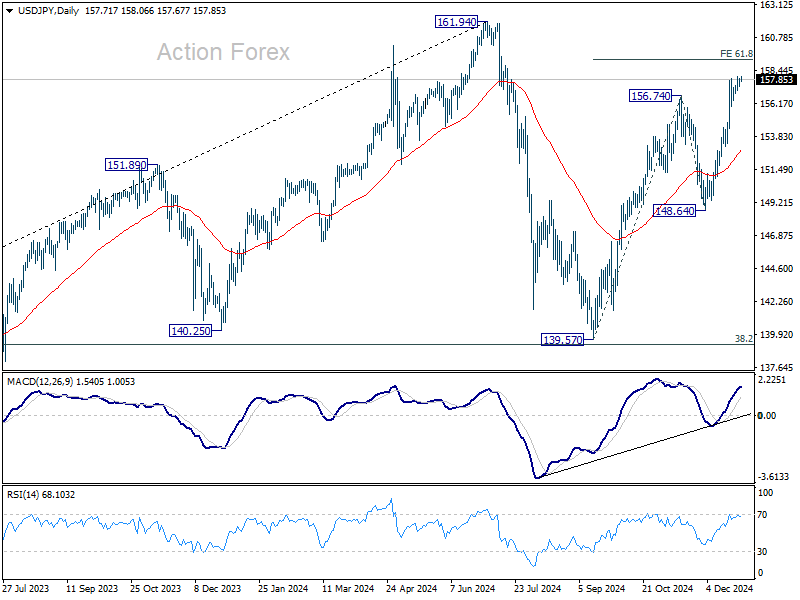
Intraday bias in USD/JPY stays mildly on the upside despite weak momentum as seen in 4H MACD. Current rise from 139.57 is still in progress for 61.8% projection of 139.57 to 156.74 from 148.64 at 159.25 next. Firm break there will pave the way back to 161.94 high. On the downside, though, below 156.88 minor support will turn intraday bias neutral again.
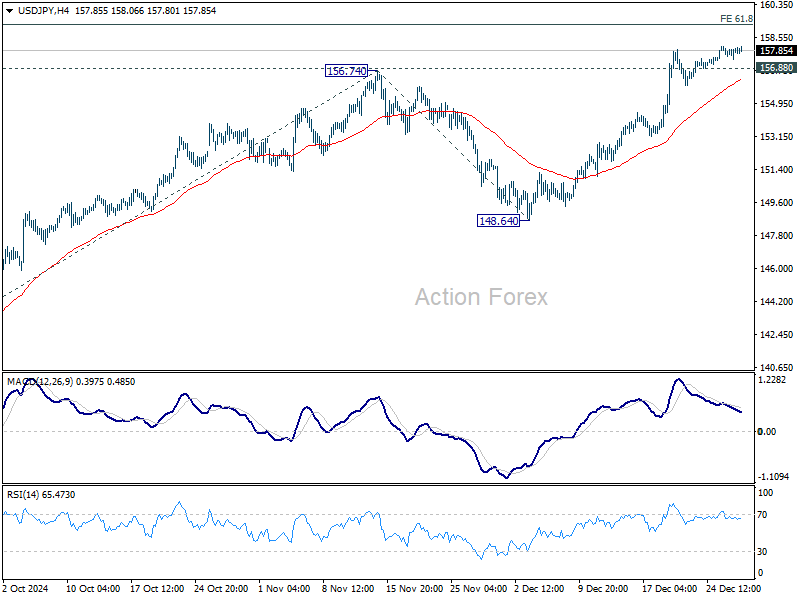
In the bigger picture, price actions from 161.94 are seen as a corrective pattern to rise from 102.58 (2021 low). The range of medium term consolidation should be set between 38.2% retracement of 102.58 to 161.94 at 139.26 and 161.94. Nevertheless, sustained break of 139.26 would open up deeper medium term decline to 61.8% retracement at 125.25.
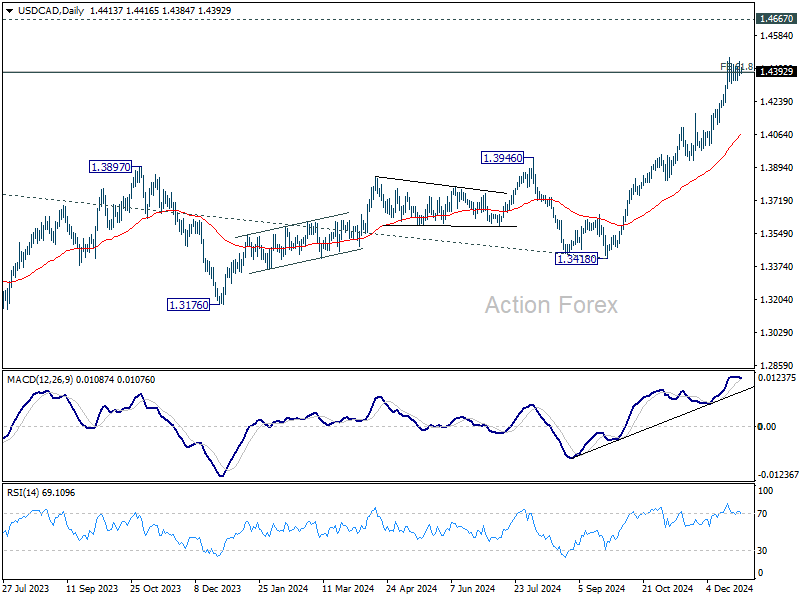
USD/CAD Daily Outlook
Daily Pivots: (S1) 1.4377; (P) 1.4413; (R1) 1.4452; More...
USD/CAD is still extending the consolidations from 1.4466 and intraday bias remains neutral. While deeper pull back cannot be ruled out, outlook will stay bullish as long as 1.4177 resistance turned support holds. On the upside, break of 1.4466 and sustained trading above 1.4391 will pave the way to retest 1.4667/89 long term resistance zone.
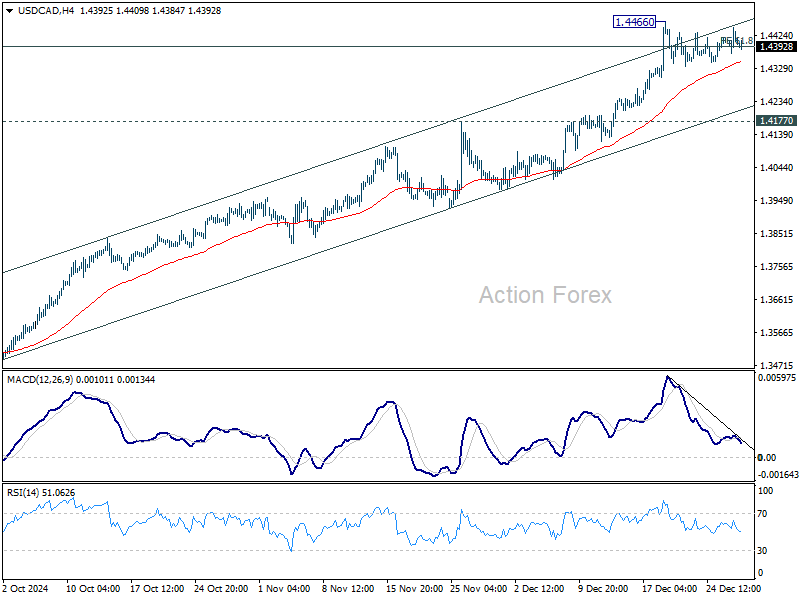
In the bigger picture, up trend from 1.2005 (2021) is in progress and met 61.8% projection of 1.2401 to 1.3976 from 1.3418 at 1.4391 already. Sustained trading above there will pave the way to 1.4667/89 key resistance zone (2020/2015 highs). Medium term outlook will remain bullish as long as 55 W EMA (now at 1.3729) holds, even in case of deep pullback.