Sample Category Title
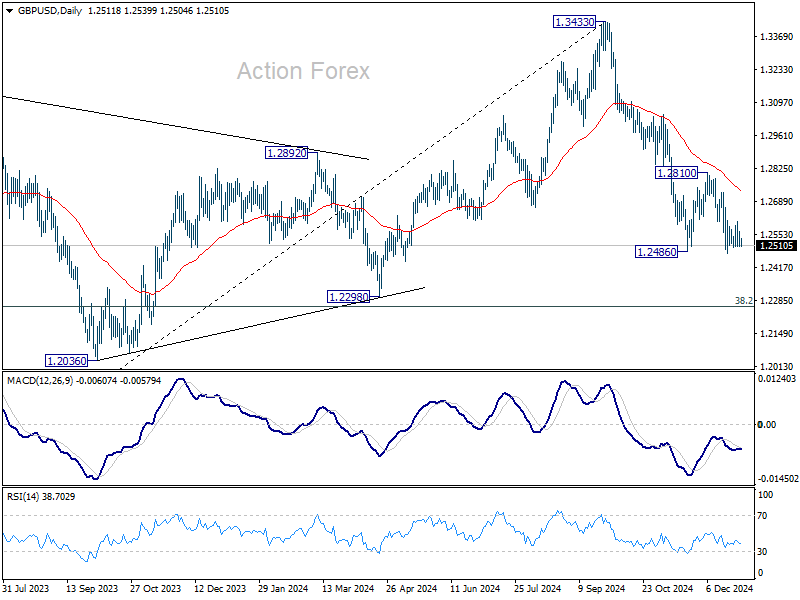
GBP/USD Daily Outlook
Daily Pivots: (S1) 1.2481; (P) 1.2545; (R1) 1.2582; More...
GBP/USD is staying in sideway trading and intraday bias remains neutral. While another recovery cannot be ruled out, outlook will stay bearish as long as 1.2810 resistance holds. On the downside, break of 1.2474 will resume the fall from 1.3433 to 1.2298 cluster support zone.
In the bigger picture, price actions from 1.3433 medium term are seen as correcting whole up trend from 1.0351 (2022 low). Deeper decline could be seen to 38.2% retracement of 1.0351 to 1.3433 at 1.2256, which is close to 1.2298 structural support. But strong support is expected there to bring rebound to extend the corrective pattern.
USD/CHF Daily Outlook
Daily Pivots: (S1) 0.9024; (P) 0.9052; (R1) 0.9095; More…
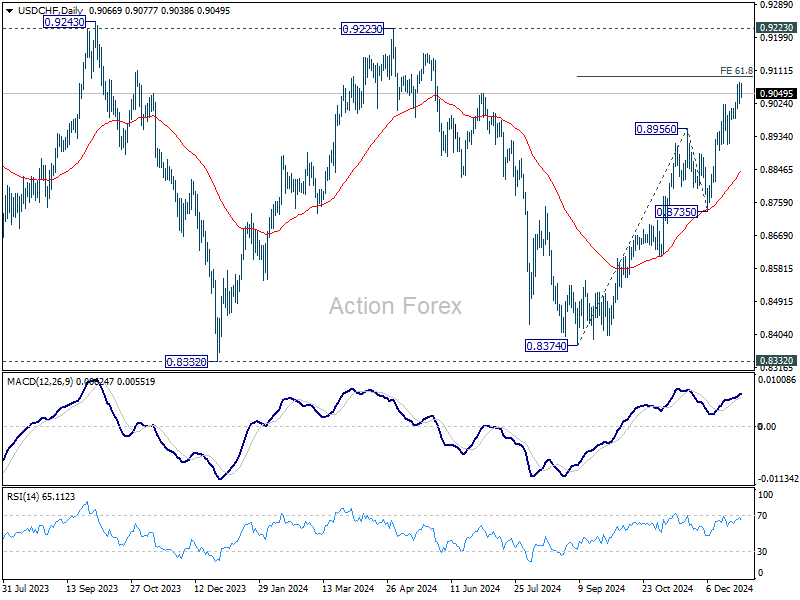
Intraday bias in USD/CHF stays mildly on the upside, as rise from 0.8374 is in progress for 61.8% projection of 0.8374 to 0.8956 from 0.8735 at 0.9095. Firm break there will pave the way to 0.9223 ley resistance next. Nevertheless, considering bearish divergence condition in 4H MACD, break of 0.8983 minor support will indicate short term topping, and turn bias back to the downside for deeper pull back.
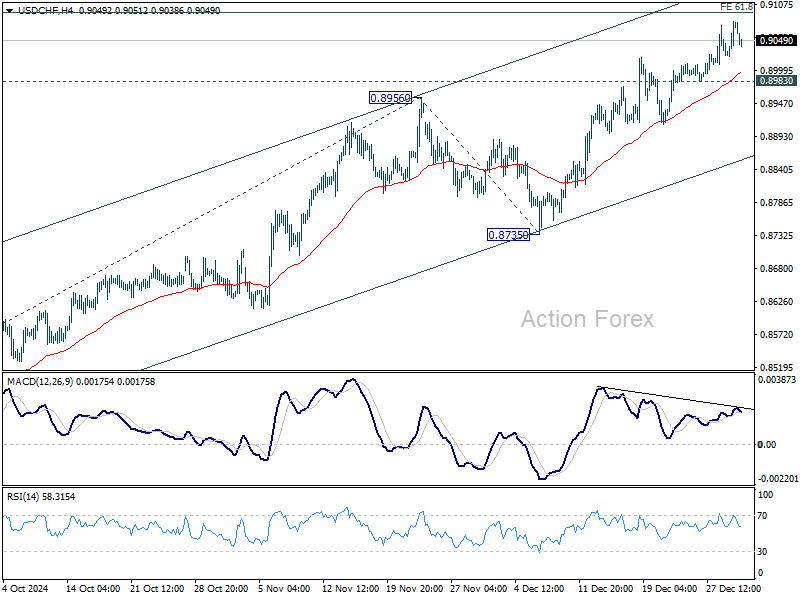
In the bigger picture, price actions from 0.8332 (2023 low) are currently seen as a medium term corrective pattern, with rise from 0.8374 as the third leg. Overall outlook will continue to stay bearish as long as 0.9223 resistance holds. Break of 0.8332 low is in favor at a later stage when the consolidation completes.
USD/JPY Daily Outlook
Daily Pivots: (S1) 156.70; (P) 157.38; (R1) 158.09; More...
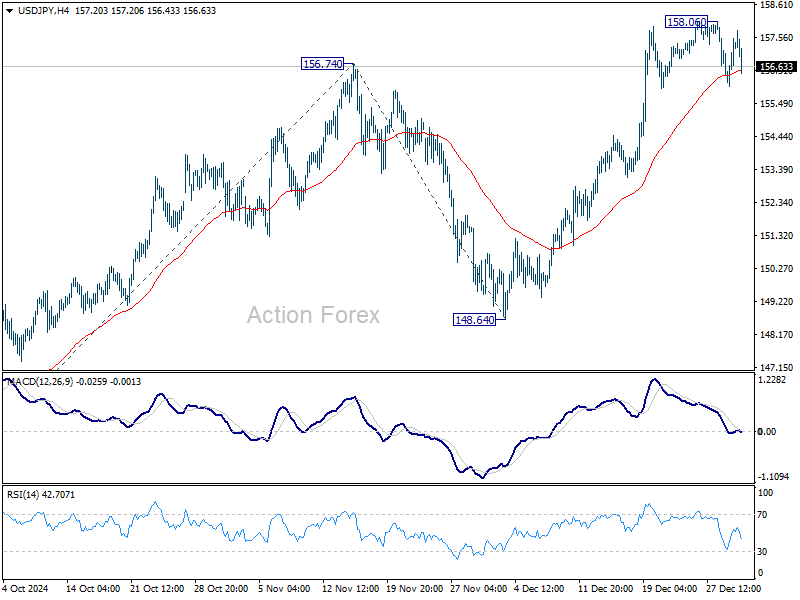
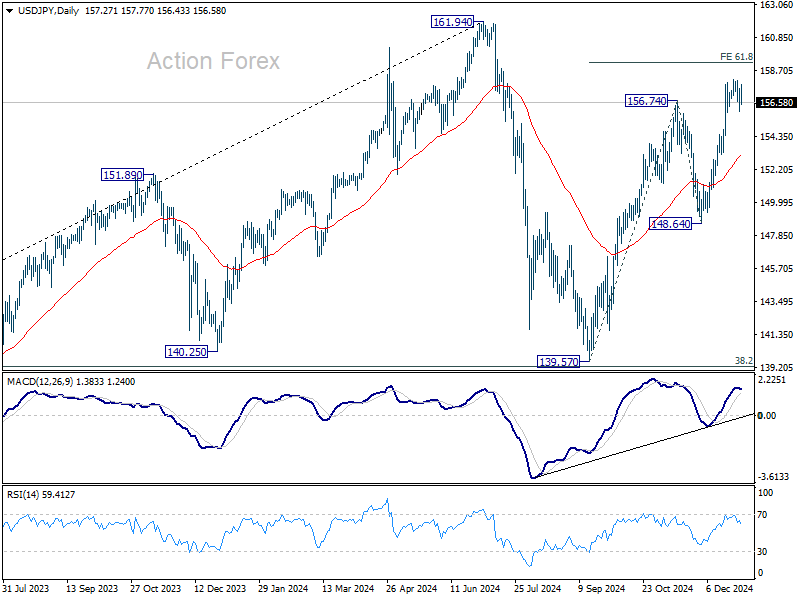
Intraday bias in USD/JPY is turned neutral with current retreat, and some consolidations would be seen below 158.06 temporary top first. But outlook will stay bullish as long as 55 D EMA (now at 153.16) holds. On the upside, above 158.06 will resume the rally from 139.57 to 61.8% projection of 139.57 to 156.74 from 148.64 at 159.25. Firm break there will pave the way back to 161.94 high.
In the bigger picture, price actions from 161.94 are seen as a corrective pattern to rise from 102.58 (2021 low). The range of medium term consolidation should be set between 38.2% retracement of 102.58 to 161.94 at 139.26 and 161.94. Nevertheless, sustained break of 139.26 would open up deeper medium term decline to 61.8% retracement at 125.25.
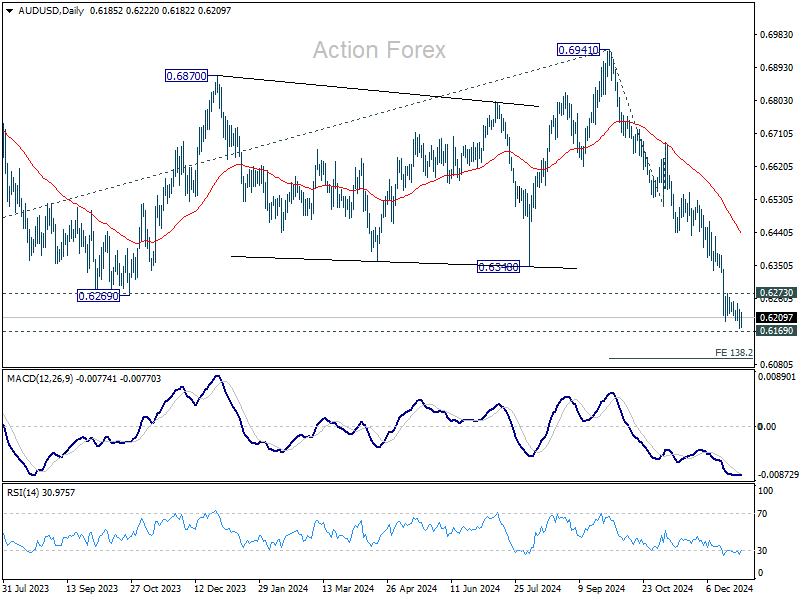
AUD/USD Daily Report
Daily Pivots: (S1) 0.6172; (P) 0.6209; (R1) 0.6229; More...
Intraday bias in AUD/USD is back on the downside with breach of 0.6198 support. Fall from 0.6941 is resuming for 0.6169 long term support, and then 138.2% projection of 0.6941 to 0.6511 from 0.6687 at 0.6074. However, considering bullish convergence condition in 4H MACD, break of 0.6273 resistance will indicate short term bottoming, and turn bias back to the upside for stronger rebound.
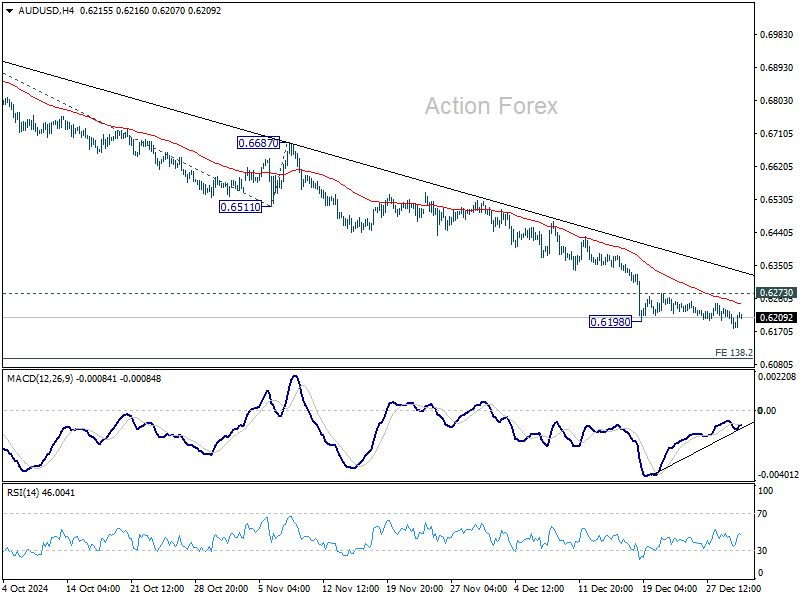
In the bigger picture, price actions from 0.6169 (2022 low) are seen as a medium term consolidation to the down trend from 0.8006. Firm break of 0.6169 support will confirm down trend resumption for 61.8% projection of 0.8006 to 0.6169 from 0.6941 at 0.5806 next. In any case, outlook will stay bearish as long as 55 W EMA (now at 0.6573) holds.
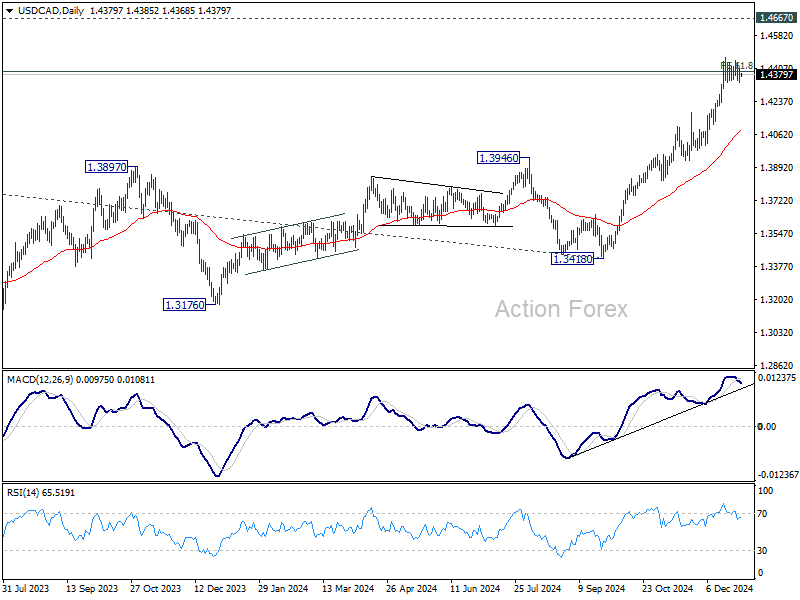
USD/CAD Daily Outlook
Daily Pivots: (S1) 1.4354; (P) 1.4394; (R1) 1.4442; More...+
Intraday bias in USD/CAD remains neutral as consolidations continue below 1.4466. Deeper pullback cannot be ruled out, but outlook will stay bullish as long as 1.4177 resistance turned support holds. On the upside, break of 1.4466 and sustained trading above 1.4391 will pave the way to retest 1.4667/89 long term resistance zone.
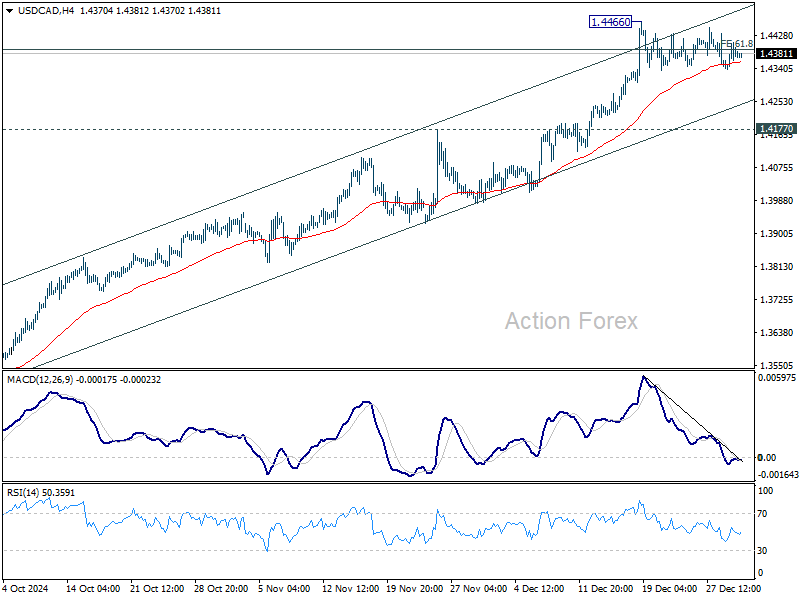
In the bigger picture, up trend from 1.2005 (2021) is in progress and met 61.8% projection of 1.2401 to 1.3976 from 1.3418 at 1.4391 already. Sustained trading above there will pave the way to 1.4667/89 key resistance zone (2020/2015 highs). Medium term outlook will remain bullish as long as 1.3976 resistance turned holds, even in case of deep pullback.
Markets Poised for High-Stakes January Amid Fed and Trump Policy Shifts
As global markets return from the New Year holiday, trading remains subdued with light activity expected until next week when full operations resume. Today’s focus will be on Eurozone and UK PMI manufacturing finals alongside US jobless claims, while tomorrow’s US ISM Manufacturing Index could provide an early glimpse of potential volatility ahead. However, the broader tone for January—and likely much of 2025—will be set by a series of pivotal events and data releases in the coming weeks.
The month’s significance stems from two major developments. First, key US non-farm payrolls and inflation data are on the radar, likely determining whether Fed will pause its policy easing cycle later this month. Following the Fed’s hawkish December rate cut, markets expect a significantly slower pace of reductions for 2025.
Adding to market uncertainties (or maybe clarities) is Donald Trump’s inauguration on January 20. The incoming administration is expected to issue at least 25 executive orders immediately, targeting areas such as immigration, energy policy, and cryptocurrency regulation. Trump’s previously stated plans to impose tariffs on imports from China, Mexico, and Canada could introduce inflationary pressures by raising costs for companies and consumers. Markets will be on high alert for details of the policies and their implications for global trade outlook.
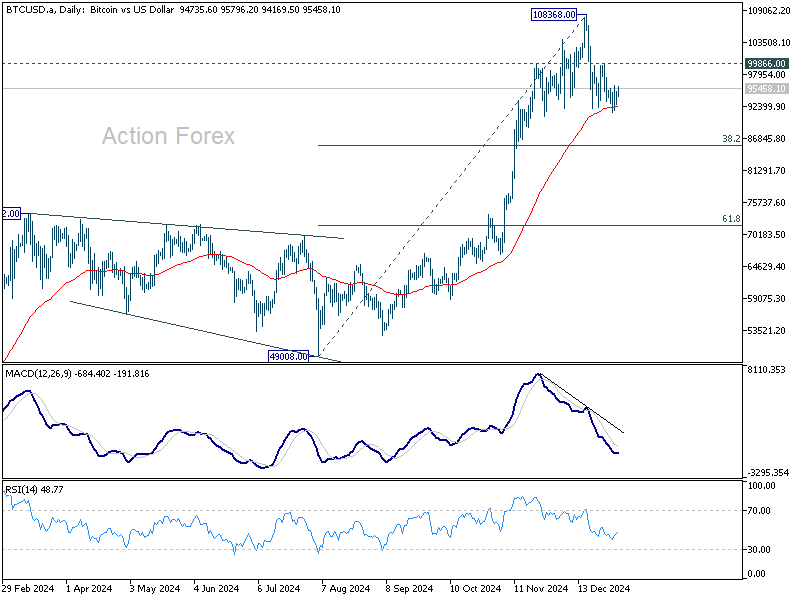
The crypto markets' reaction in the coming days could give a sneak peak on how underlying risk sentiment is flaring back from holiday. Bitcoin's pull back from 108368 has started to slow after hitting 55 D EMA (now at 92441). Strong bounce from current level, followed by break of 99866 resistance will argue that Bitcoin has completed the correction, and larger record run up trend is ready to resume. However, sustained trading below the EMA will likely pave the way back to 38.2% retracement of 49008 to 108368 at 85962, or even below, as correction deepens first.
In Asia, Japan was on holiday. Hong Kong HSI is down -2.40%. China Shanghai SSE is down -3.05%. Singapore Strait Times up 0.14%.
Happy new year, and wish you a prosperous and healthy 2025!
China’s Caixin PMI manufacturing falls back to 50.5 as downward pressures persist
China’s Caixin Manufacturing PMI dropped to 50.5 in December, down from 51.5 and below market expectations of 51.6, signaling a moderation in the sector's growth.
While supply and demand expanded modestly, external demand remained a significant drag, according to Wang Zhe, Senior Economist at Caixin Insight Group.
Zhe highlighted several challenges, noting that external demand was "sluggish", while job market suffered a "notable contraction." Additionally, sales prices were weak, and market optimism continued to decline.
The survey pointed to "prominent downward pressures", stemming from subdued domestic demand and challenging external conditions, which have squeezed profit margins and dented confidence.
The report also suggested that the impact of previous policy stimulus measures has yet to yield consistent results, with more time needed to gauge their effectiveness.
Looking ahead
Swiss PMI manufacturing, Eurozone PMI manufacturing final and M3 money supply, and UK PMI manufacturing final will be released in European session. Later in the day, US will release jobless claims, PMI manufacturing final, and construction spending.
USD/CAD Daily Outlook
Daily Pivots: (S1) 1.4354; (P) 1.4394; (R1) 1.4442; More...
Intraday bias in USD/CAD remains neutral as consolidations continue below 1.4466. Deeper pullback cannot be ruled out, but outlook will stay bullish as long as 1.4177 resistance turned support holds. On the upside, break of 1.4466 and sustained trading above 1.4391 will pave the way to retest 1.4667/89 long term resistance zone.
In the bigger picture, up trend from 1.2005 (2021) is in progress and met 61.8% projection of 1.2401 to 1.3976 from 1.3418 at 1.4391 already. Sustained trading above there will pave the way to 1.4667/89 key resistance zone (2020/2015 highs). Medium term outlook will remain bullish as long as 1.3976 resistance turned holds, even in case of deep pullback.
PMIs and Riksbank Minutes in Focus on the First Trading Day of 2025
In focus today
Happy New Year, everyone, and welcome back to work here in 2025! We are ready with the first Danske Morning Mail of the new year.
Today, we keep an eye on final PMI data for the euro area, the US, Norway, Sweden, and the UK. The flash release came very early in December, so the final release could deviate more than usual, which warrants close monitoring of the release today.
In Sweden, the Riksbank publishes minutes from the December monetary policy meeting.
Economic and market news
What happened overnight
In China, the Caixin manufacturing PMI fell to 50.5 in December, compared to 51.5 in November. The release was disappointing as the consensus expectation was a slight increase to 51.7. The release was in line with the results from the official NBS PMI survey, released earlier this week. New orders fell to a three-month low. Export orders fell to contractionary terrain after declining for the past five months. The release comes after China's President Xi said in his New Year's speech that China would implement more proactive policies to enhance growth in 2025.
What happened yesterday
In Russia, gas exports to Europe via Ukraine came to a halt after Ukraine refused to renew a transit agreement, according to the Russian-owned energy company Gazprom. As the last European countries that still bought Russian gas have arranged alternative supply or upheld buying via other pipelines, the halt will not affect energy prices in Europe.
What happened over Christmas and New Years
In Spain, HICP inflation rose to 2.8% year-on-year in December from 2.4% year-on-year in November, above expectations of a rise to 2.6% by consensus. Core inflation was also higher than expected, rising to 2.6% year-on-year (consensus: 2.4%) in December from 2.4% year-on-year in November. We expect euro area HICP inflation, which is released on 7 January, to show a rise to 2.4% year-on-year in December from 2.2% in November. The increase is mainly expected due to base effects on energy and food inflation, while we expect core inflation to decline from 2.7% year-on-year in November to 2.6% year-on-year.
In Japan, the Tokyo CPI showed that core inflation rose to 2.4% year-on-year in December compared to 2.2% in November. The release was important since it could give some indication of when the Bank of Japan will make its next rate change. At the moment, markets price in around a 40% probability of a rate hike at the January meeting and a 60% probability of the interest rate being left unchanged. We expect the Bank of Japan to leave interest rates unchanged at the January meeting as well.
In the Baltic Sea, NATO said it would increase its presence after a suspected Russian sabotage of an underwater power cable and several internet cables. The suspicion of Russia came after Finland seized a ship carrying Russian oil, which they suspected forced an outage of the Estlink 2 power cable linking Finland and Estonia.
In Denmark, the Novo Nordisk share dropped by nearly 21% on 20 December after their next-gen weight loss product, Cagrisema, failed to live up to the expected effect that Novo Nordisk had communicated to the market. A significant part of the earnings-per-share growth for Novo is linked to a significant market share in the weight loss market. With lower-than-expected weight loss from Novo's next-gen product, it seems to be less effective than their competitor Eli Lilly's weight loss product.
In Turkey, the central bank lowered its key interest rate by 250 basis points from 50.0% to 47.5%. The rate had been held at 50.0% since March and was last lowered at the beginning of 2023. Turkish inflation fell to 47%, still well above the 5% target. The central bank of Turkey expects inflation to come down to around 21% by the end of 2025.
FI: 2024 ended with higher yields and steeper curves driven by the long end as well as a tightening of the ASW-spreads in the US and Europe as the markets still are factoring in rate cuts from both the Federal Reserve and ECB , but investors are requiring a higher "term/risk" premium in the longer-dated bonds due to the significant supply expected in 2025, where we are looking forward to another year with a record high supply and a very busy primary market as described in our issuance outlook for Q1 and 2025, where we look at the potential new deals in January/February in the Euro area. Ireland and Portugal are usually some of the first sovereigns coming to the market and we expect that next week will be very busy.
FX: Since the December FOMC, the USD has remained bid, outperforming across G10 currencies and recording an impressive 8% YTD gain in 2024 - its strongest annual rally since 2015. EUR/USD has been rangebound within the 1.0350-1.0450 range but is currently trading heavy near the lower end of the range. USD/JPY appears to have stabilized below 158 as intervention risks remain elevated. The CHF, AUD, and NZD have underperformed the most against the USD since the holidays, while GBP, NOK, and SEK have seen more muted moves. EUR/NOK and EUR/SEK have trended lower over the past week, with EUR/NOK trading just below 11.80 and EUR/SEK hovering around 11.45.
China’s Caixin PMI manufacturing falls back to 50.5 as downward pressures persist
China’s Caixin Manufacturing PMI dropped to 50.5 in December, down from 51.5 and below market expectations of 51.6, signaling a moderation in the sector's growth.
While supply and demand expanded modestly, external demand remained a significant drag, according to Wang Zhe, Senior Economist at Caixin Insight Group.
Zhe highlighted several challenges, noting that external demand was "sluggish", while job market suffered a "notable contraction." Additionally, sales prices were weak, and market optimism continued to decline.
The survey pointed to "prominent downward pressures", stemming from subdued domestic demand and challenging external conditions, which have squeezed profit margins and dented confidence.
The report also suggested that the impact of previous policy stimulus measures has yet to yield consistent results, with more time needed to gauge their effectiveness.
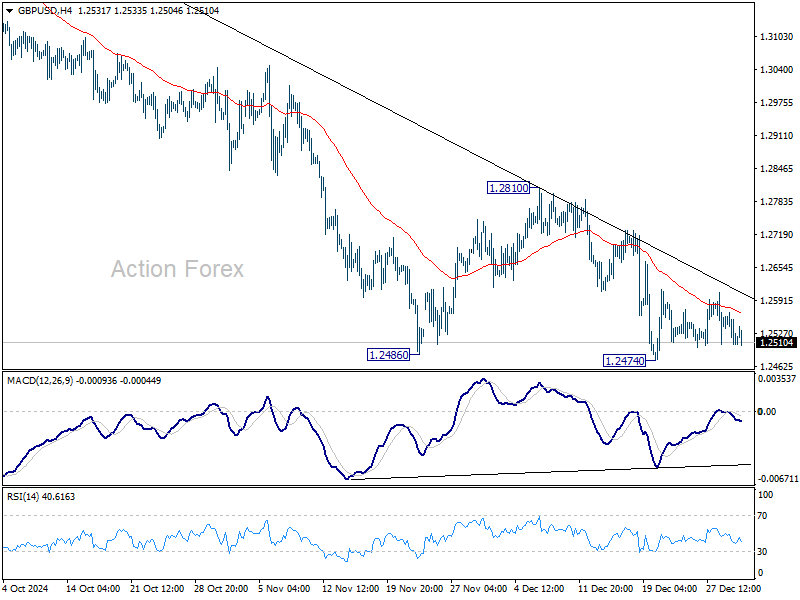
GBP/USD Struggles: Is a Deeper Drop on the Horizon?
Key Highlights
- GBP/USD failed to start another increase above the 1.2800 resistance zone.
- A major bearish trend line is forming with resistance at 1.2600 on the 4-hour chart.
- EUR/USD is at risk of more losses below the 1.0340 support.
- Crude Oil prices gained bullish momentum and climbed above $71.50.
GBP/USD Technical Analysis
The British Pound started another decline from the 1.2800 resistance zone against the US Dollar. GBP/USD declined below 1.2720 and 1.2650 to enter a bearish zone.
Looking at the 4-hour chart, the pair settled below the 1.2650 level, the 100 simple moving average (red, 4-hour), and the 200 simple moving average (green, 4-hour). The pair even retested the 1.2480 support zone before it started a consolidation phase.
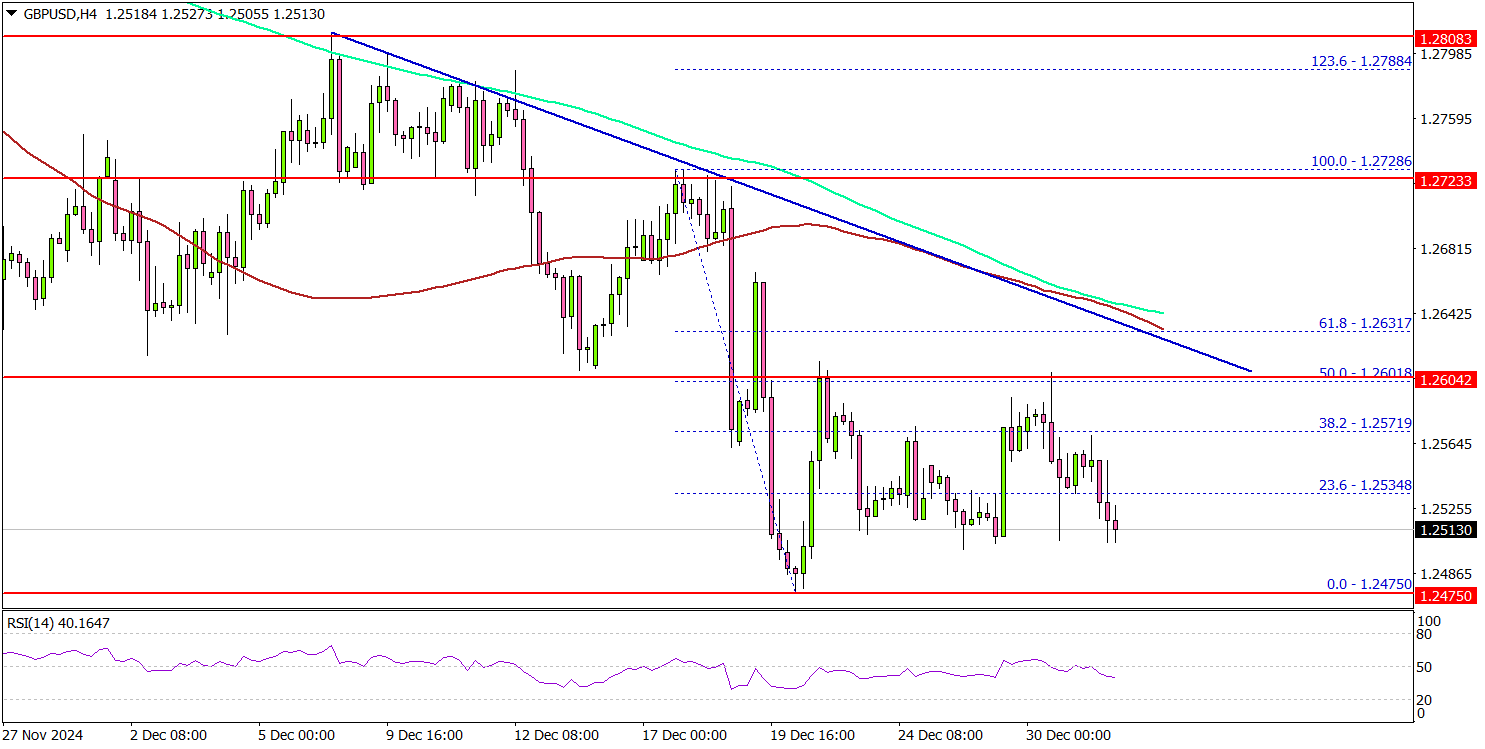
On the upside, the pair is facing hurdles near the 1.2570 level. The first major resistance is near the 1.2600 level. There is also a major bearish trend line forming with resistance at 1.2600 on the same chart.
The next major resistance is near the 1.2630 level and the 100 simple moving average (red, 4-hour). A close above the 1.2630 level could set the tone for another increase. In the stated case, the pair could rise toward the 1.2750 resistance.
On the downside, immediate support sits near the 1.2475 level. The next key support sits near the 1.2420 level. Any more losses could send the pair toward the 1.2350 level.
Looking at EUR/USD, the pair is consolidating losses below 1.0420 and might continue to move down in the near term.
Upcoming Economic Events:
- Euro Zone Manufacturing PMI for Dec 2024 – Forecast 45.2, versus 45.2 previous.
- UK Manufacturing PMI for Dec 2024 – Forecast 47.3, versus 47.3 previous.
- US Manufacturing PMI for Dec 2024 – Forecast 48.3, versus 48.3 previous.
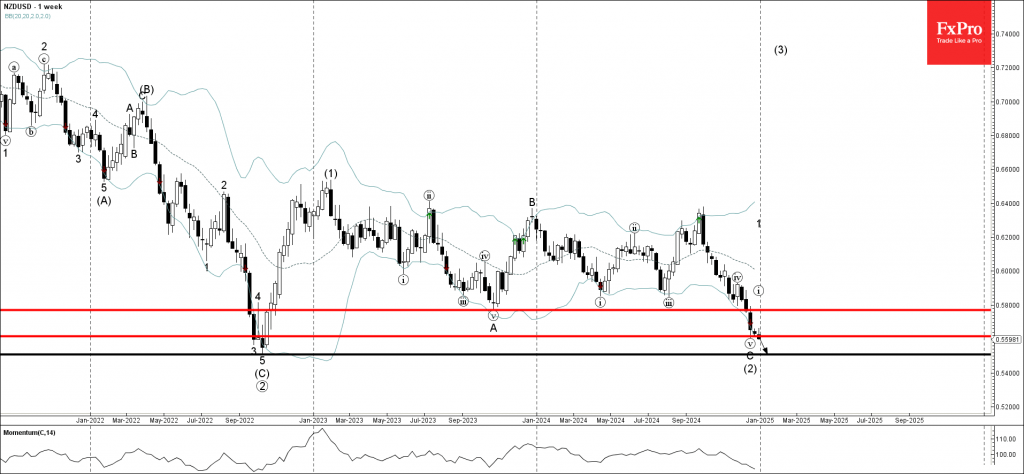
NZDUSD Wave Analysis
- NZDUSD broke key support 0.5600
- Likely to fall to support level 0.5500
NZDUSD currency pair under the bearish pressure after breaking the key support 0.5600, which stopped the previous long-term ABC correction (2) earlier this month.
The breakout of the support 0.5600 strengthened the bearish pressure on this currency pair.
Given the multi-month downtrend, NZDUSD currency pair can be expected to fall to the next major support level 0.5500 (which stopped multiyear downtrend in 2022) – from where the upward correction is likely.