Sample Category Title
Euro Slides to Lowest Level in Over Two Years
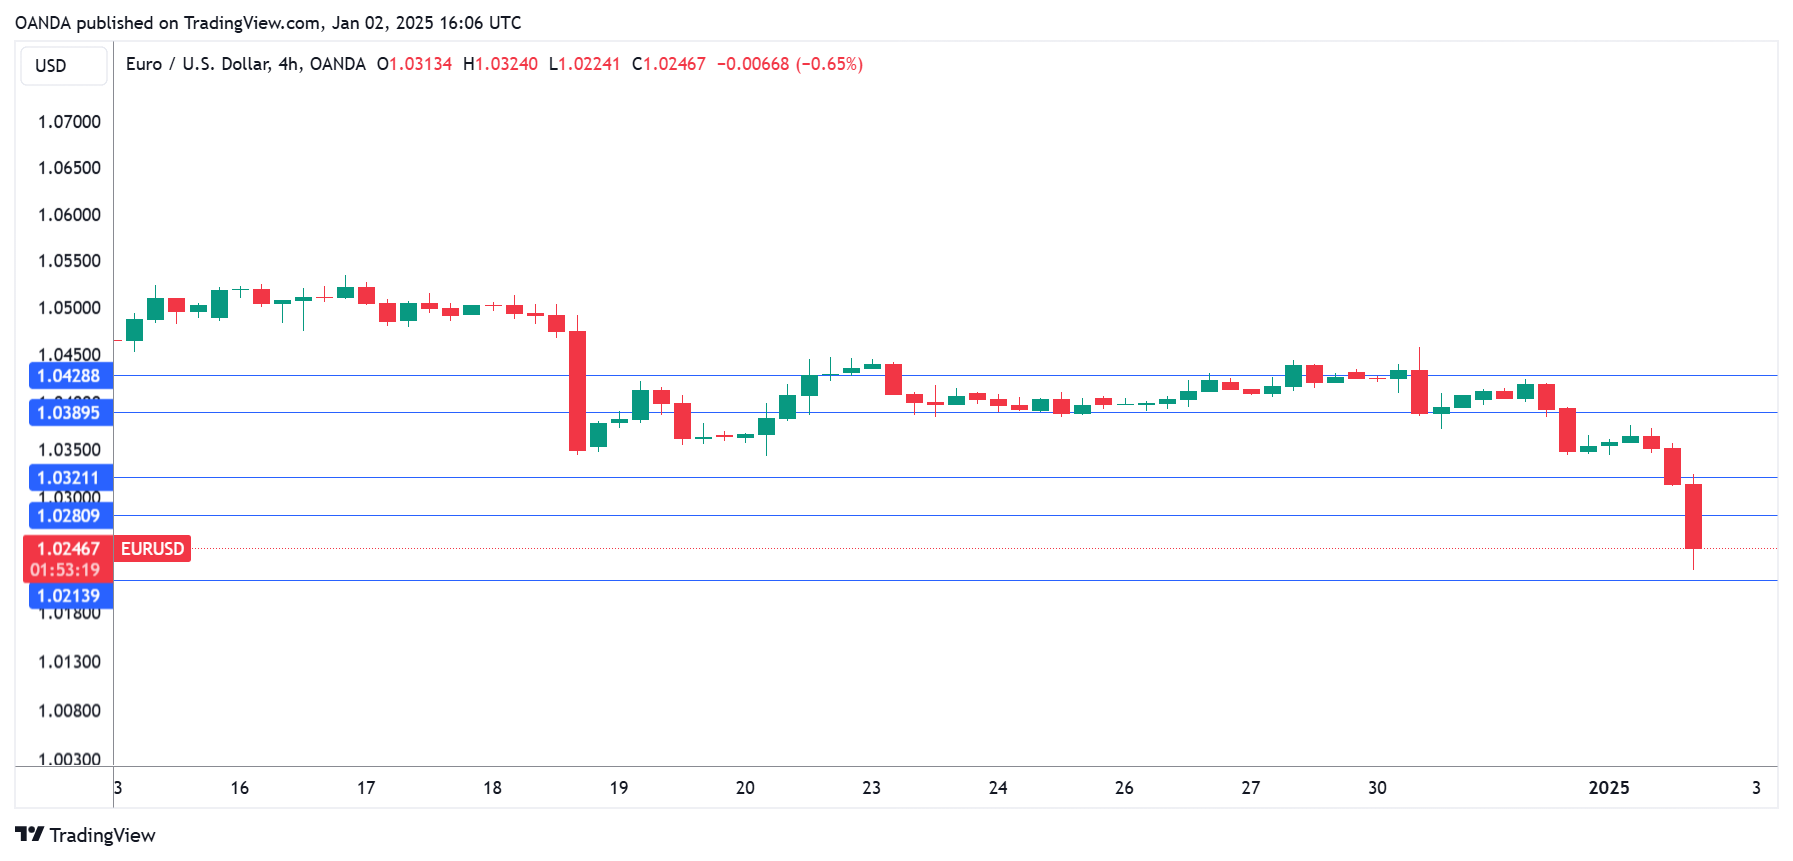
The euro has taken a tumble on Thursday. In the North American session, EUR/USD is currently trading at 1.0246, down 1.06% on the day. The euro has broken below the 1.03 line for the first time since Nov. 2022.
Is euro headed toward parity?
The euro fell more than 6% against the dollar in 2024 and could continue to lose ground in 2025. The Federal Reserve has said it will go slow on rate cuts, a reflection of the strong US economy and resilient labor market. The eurozone economy has been sputtering since late 2022, although the labor market has been overheating. The ECB has cut rates at three straight meetings and seems intent on continuing to lower rates in order to boost the weak economy.
The European Central Bank is expected to cut over 100 basis points this year, more than double the Federal Reserve. A wider US/Europe rate differential will make the dollar more attractive to investors. Could the euro be headed for parity in the near future?
The eurozone released manufacturing PMIs earlier today and the news remains bleak. Among the four largest economies in the eurozone, all are showing contraction in manufacturing activity except for Spain. Germany’s PMI dropped to 42.5 in December, down from 43.0 in October and November, while the eurozone PMI ticked lower to 45.1 in December from 45.2 in November. Manufacturing activity in Germany and the eurozone have been contracting for two years and there doesn’t seem to be much light at the end of tunnel for the struggling manufacturing sector.
We’ll get a look at the US ISM manufacturing PMI on Friday. Manufacturing activity has been contracting and is expected to tick lower to 48.3 in December from 48.4 in November.
EUR/USD Technical
- EUR/USD has pushed below support at 1.0321 and 1.0281. Below, there is support at 1.0231
- There is resistance at 1.0389 and 1.0429
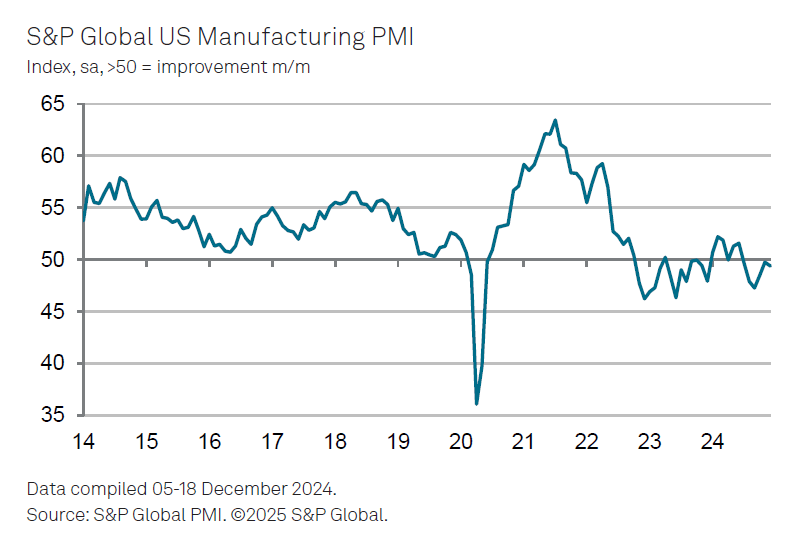
US PMI manufacturing finalized at 49.4, optimism wanes on inflation worries
US PMI Manufacturing Index was finalized at 49.4 in December, a slight dip from November’s 49.7, marking the sixth consecutive month of contraction in the sector. Although the decline in manufacturing health remains modest overall, the pace of deterioration has quickened slightly compared to the prior month.
Chris Williamson, Chief Business Economist at S&P Global Market Intelligence, highlighted the challenges: "US factories reported a tough end to 2024, and have scaled back their optimism for growth in the year ahead."
He pointed to rising production cuts in December as inflows of new orders disappointed. The fleeting boost in customer demand seen after the election in November has faded, leaving factories to contend with subdued sales, particularly in export markets.
Despite the downturn, many manufacturers are cautiously optimistic about the New Year, hoping that the incoming administration’s policies might spur growth. Expectations of reduced regulations, lower taxes, and increased demand for US goods via potential tariffs are contributing to this sentiment. Confidence, which hit a low in June, received a notable boost following the election result in November.
However, firms are increasingly wary of rising input costs and the resurgence of inflation, which could limit the scale of Fed rate cuts in the coming year.
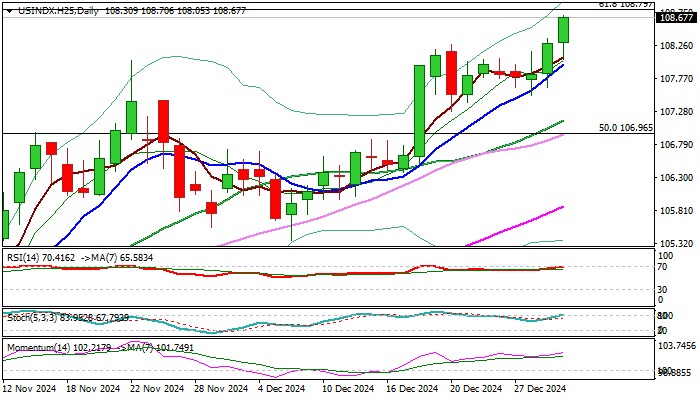
Dollar Index Keeps Firm Tone at the Start of the Year
The dollar index kept firm tone and hit new two year high on the first trading day of the new year, as markets started to gain pace after a quiet holiday mode.
The dollar gained over 7% vs the basket of major world currencies in 2024, following strong swings up and down during the first three quarters of the year and strong acceleration higher in the last three months.
US monetary policy and inflation were among key drivers of the dollar, with its safe-haven appeal during turbulent period of geopolitical and economic uncertainty, also contributing to dollar’s direction.
The latest shift in monetary policy view from Fed, due to new reality of still elevated inflation and promises from incoming administration of Donald Trump for strong boost of the US economy, sparked strong rally in the last quarter of 2024.
Also, a wide difference in monetary policies between the US and other major economies is expected to continue to underpin the dollar in coming months, along with expectations that economic growth acceleration will boost inflation and probably keep US interest rates unchanged, against Fed’s promises of stronger policy easing earlier this year.
Bullish technical studies on all larger timeframes (Day / Week / Month) contribute to positive short-term outlook (daily / weekly Tenkan-sen is in steep ascend and diverging from Kijun-sen and also creating a bull-cross on monthly chart, while positive momentum remains strong on all three timeframes).
Fresh bulls pressure significant technical resistance at 108.79 (Fibo 61.8% retracement of 114.725/99.20 bear-leg) and firm break here to contribute to strong signals that corrective phase from new multi-year peak (114.72, posted in Sep 2022) might be over that would open way for test of psychological 110 barrier and Fibo level at 111.06 (76.4% retracement).
Minor price adjustments on overbought studies should be anticipated, with 108 zone offering initial support (former top / daily Tenkan-sen) and extended dips to find solid ground at 106 zone (former lower platform of Oct/Nov 2023 / broken Fibo 50%) and keep larger bulls intact.
Res: 108.80; 109.70; 110.00; 111.06
Sup: 108.28; 108.00; 107.51; 107.00
EUR/USD Mid-Day Outlook
Daily Pivots: (S1) 1.0321; (P) 1.0389; (R1) 1.0429; More...
EUR/USD's decline from 11213 resumed by breaking through 1.0330 support and intraday bias is back on the downside. Next target is 1.0199 fibonacci level. On the upside, above 1.0457 minor resistance will turn intraday bias neutral again. But outlook will now stay bearish as long as 1.0629 resistance holds.

In the bigger picture, current development suggests that rebound from 0.9534 (2022 low) has already completed at 1.1274 after rejection by 55 M EMA. Deeper fall should be seen to 61.8 retracement of 0.9534 to 1.1274 at 1.0199. Sustained trading below there will pave way back to 0.9534 low. This will now remain the favored case as long as 1.0629 resistance holds.

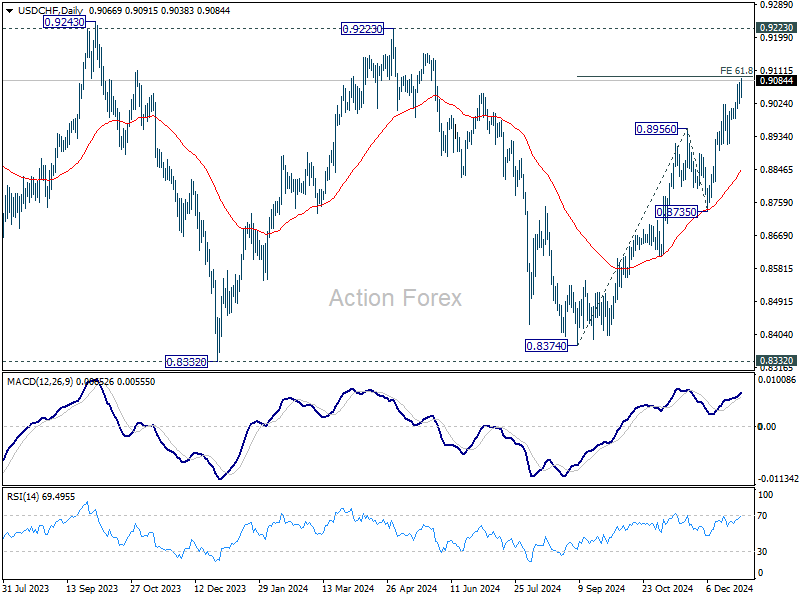
USD/CHF Mid-Day Outlook
Daily Pivots: (S1) 0.9024; (P) 0.9052; (R1) 0.9095; More…
USD/CHF's rally fro 0.8374 is still in progress and intraday bias stays on the upside. Firm break of 61.8% projection of 0.8374 to 0.8956 from 0.8735 at 0.9095 will pave the way to 0.9223 ley resistance next. On the downside, below 0.9022 minor support will turn intraday bias neutral first. But outlook will stay bullish as long as 0.8956 resistance turned support holds.
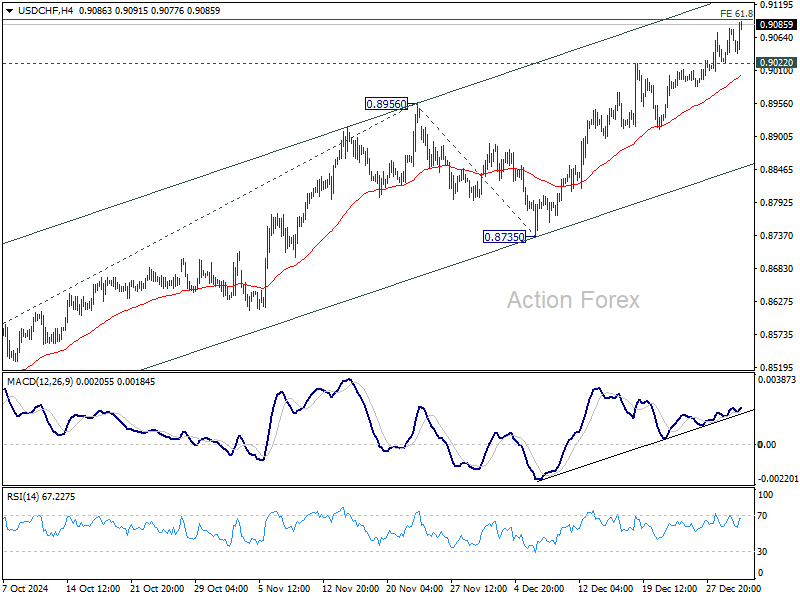
In the bigger picture, price actions from 0.8332 (2023 low) are currently seen as a medium term corrective pattern, with rise from 0.8374 as the third leg. Overall outlook will continue to stay bearish as long as 0.9223 resistance holds. Break of 0.8332 low is in favor at a later stage when the consolidation completes.
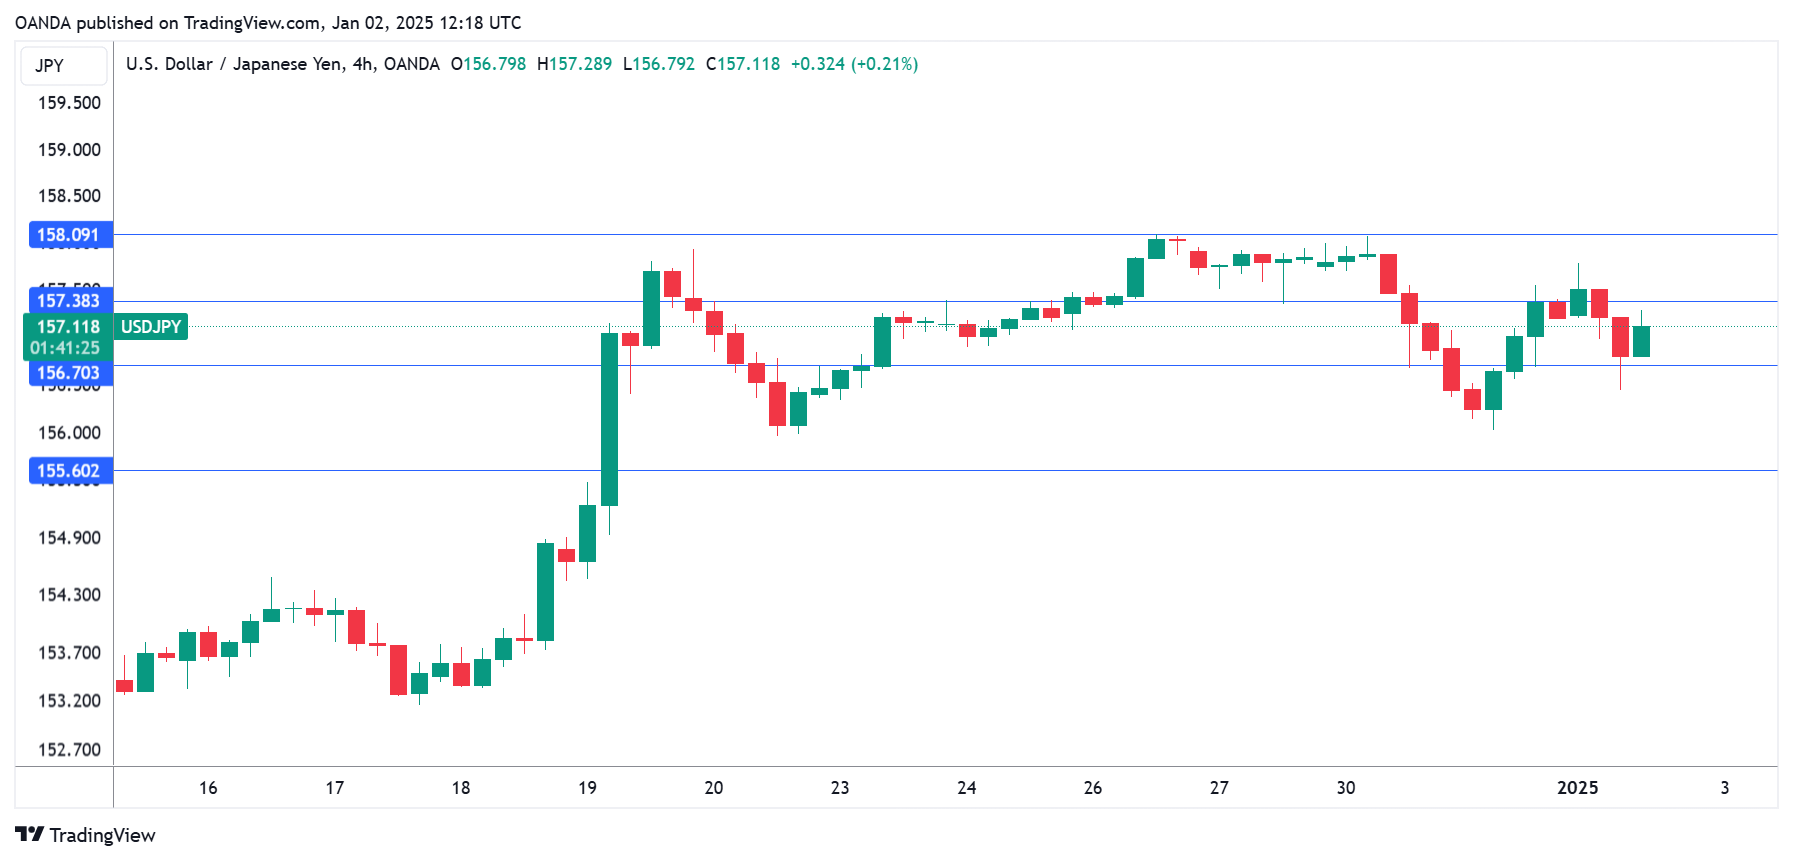
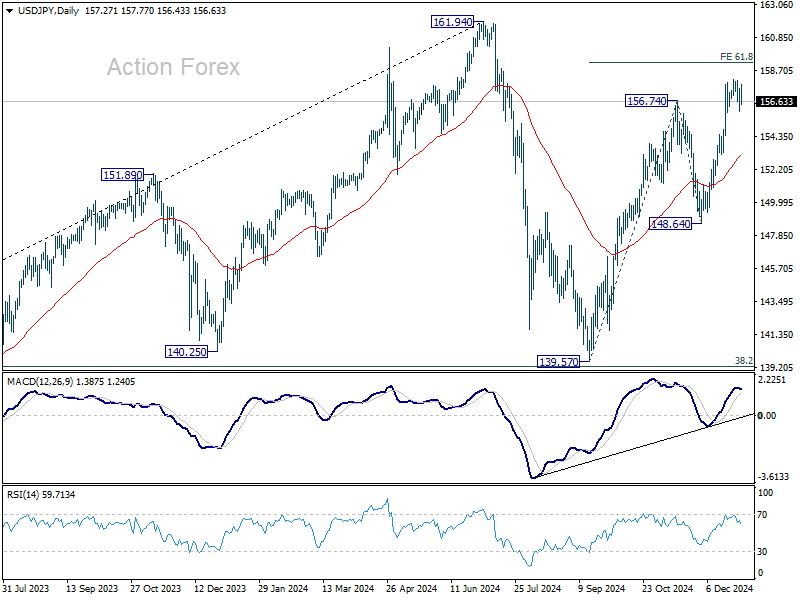
USD/JPY Mid-Day Outlook
Daily Pivots: (S1) 156.70; (P) 157.38; (R1) 158.09; More...
USD/JPY is staying in consolidation below 158.06 and intraday bias remains neutral. Outlook will stay bullish as long as 55 D EMA (now at 153.16) holds. On the upside, above 158.06 will resume the rally from 139.57 to 61.8% projection of 139.57 to 156.74 from 148.64 at 159.25. Firm break there will pave the way back to 161.94 high.
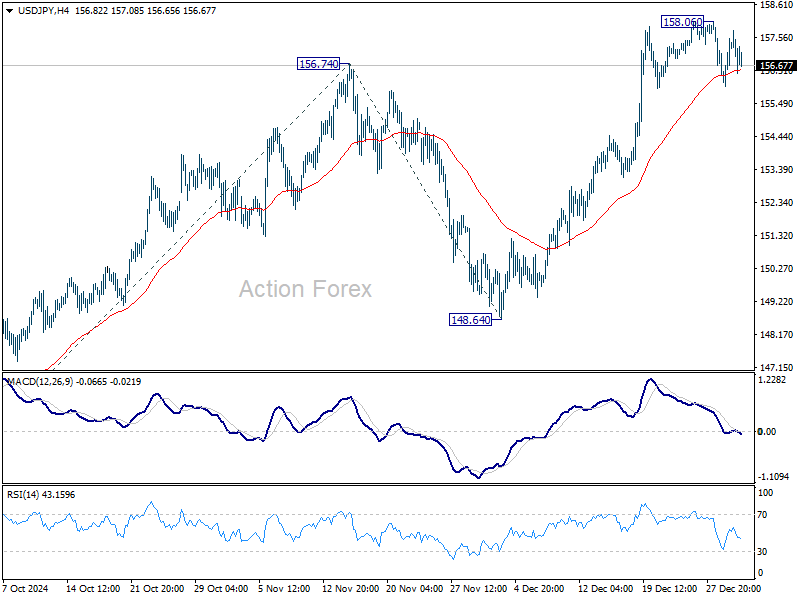
In the bigger picture, price actions from 161.94 are seen as a corrective pattern to rise from 102.58 (2021 low). The range of medium term consolidation should be set between 38.2% retracement of 102.58 to 161.94 at 139.26 and 161.94. Nevertheless, sustained break of 139.26 would open up deeper medium term decline to 61.8% retracement at 125.25.
GBP/USD Mid-Day Outlook
Daily Pivots: (S1) 1.2481; (P) 1.2545; (R1) 1.2582; More...
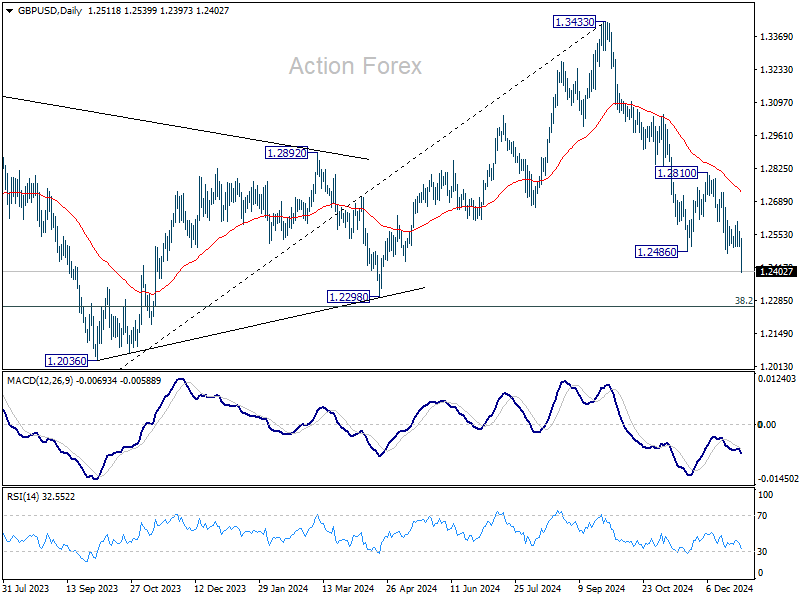
GBP/USD's decline from 1.3433 resumed by breaking through 1.2474 support today. Intraday bias is back on the downside for 1.2298 cluster support zone. Strong support is expected there to contain downside to bring rebound, at least on first attempt. On the upside, break of 1.2606 minor resistance will indicate short term bottoming, and turn bias back to the upside for 1.2810 resistance next.
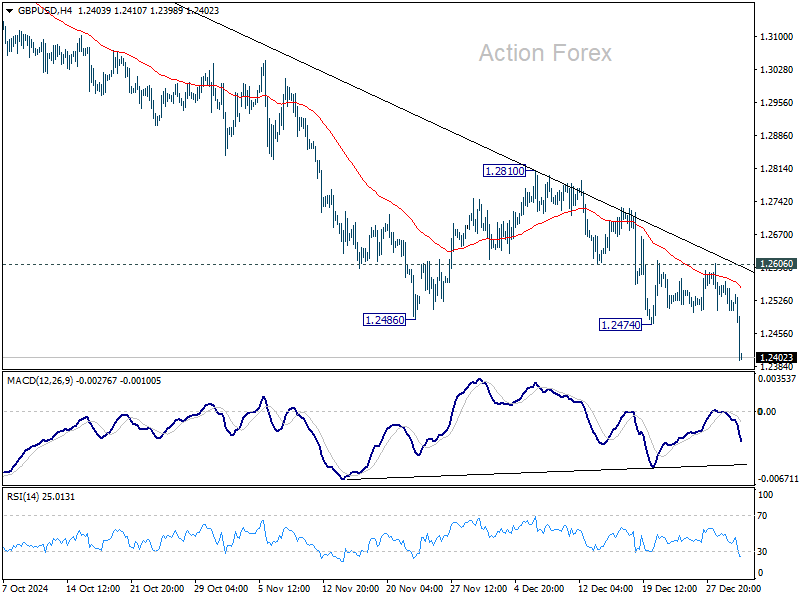
In the bigger picture, price actions from 1.3433 medium term are seen as correcting whole up trend from 1.0351 (2022 low). Deeper decline could be seen to 38.2% retracement of 1.0351 to 1.3433 at 1.2256, which is close to 1.2298 structural support. But strong support is expected there to bring rebound to extend the corrective pattern.
Sterling Leads European Losses as Economic Weakness and Trade Risks Mount
Sterling to leads declines among European currencies, with its selloff accelerating as US markets open. Downward revisions to December’s PMI manufacturing data reaffirm the grim economic outlook for both Eurozone and UK. While these revisions offered no new surprises, they underline the widespread challenges confronting major European economies. Weak growth remains a shared concern for Germany, France, and the UK, though additional political instability in Germany and France amplifies the uncertainty. The UK, meanwhile, is grappling with stagnation risks exacerbated by the impact of the latest budget measures.
Compounding the region’s troubles are looming threats of a trade war with the US, which could materialize as early as January 20 when Donald Trump officially assumes the presidency. Proposals to impose tariffs on European goods could significantly disrupt already fragile economies and further dent business sentiment in the region.
In currency markets, there is growing speculation about EUR/USD approaching parity as ECB continues its steady rate-cutting cycle of 25bps per meeting until reaching neutral range. However, the medium-term outlook for Euro is not entirely bleak. Political stabilization in Germany following upcoming elections could restore some investor confidence, offering a counterweight to bearish pressures.
The broader market picture today shows Yen as the strongest performer, followed by the Australian Dollar and New Zealand Dollar. At the other end of the spectrum, Sterling holds the title of the weakest currency, trailed by Euro and Canadian Dollar, while Dollar and Swiss Franc are mixed in the middle.
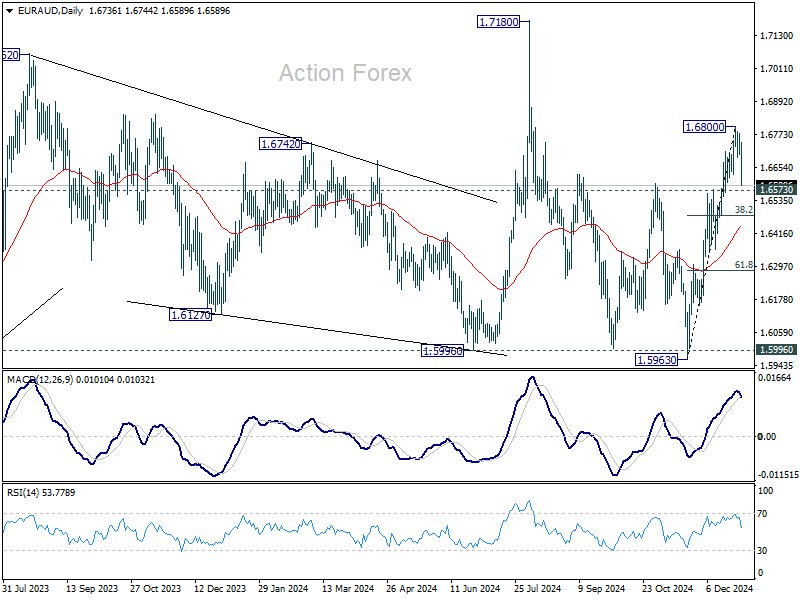
Technically, EUR/AUD's steep decline today suggests that a short term top is possible formed at 1.6800 already. Break of 1.6573 support would bring deeper pull back to 38.2% retracement of 1.5963 to 1.6800 at 1.6480. But downside should be contained by 55 D EMA (now at 1.6443) to bring rebound.
In Europe, at the time of writing, FTSE is up 0.72%. DAX is up 0.10%. CAC is down -0.56%. UK 10-year yield is down -0.001 at 4.567. Germany 10-year yield is down -0.025 at 2.344. Earlier in Asia, Japan was on holiday. Hong Kong HSI fell -2.18%. China Shanghai SSE fell -2.66%. Singapore Strait Times rose 0.35%.
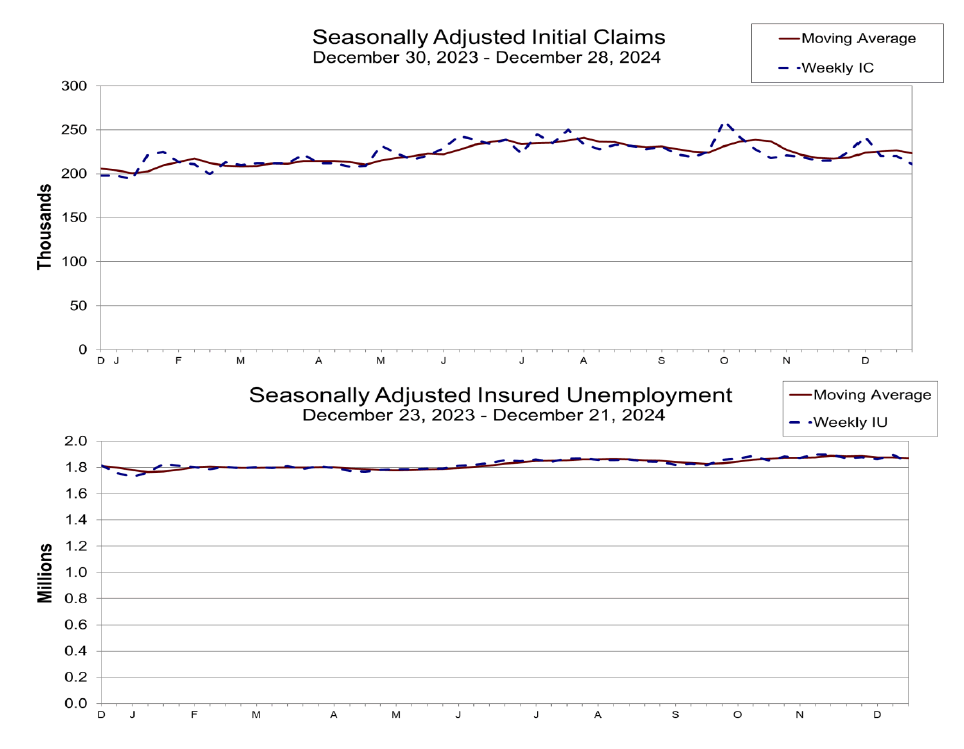
US initial jobless claims falls to 211k, vs exp 223k
US initial jobless claims fell -9k to 211k in the week ending December 28, below expectation of 223k. Four-week moving average of initial claims fell -3.5k to 223k.
Continuing claims fell -52k to 1844k in the week ending December 21. Four-week moving average of continuing claims fell -7k to 1871k.
UK PMI manufacturing finalized at 47, sentiment at two-year low
UK PMI Manufacturing was finalized at 47.0 in December, down from 48.0 in November, marking the third consecutive month of contraction. Persistent challenges, both domestic and international, weighed heavily on the sector, resulting in the sharpest production decline in nearly a year.
Rob Dobson, Director at S&P Global Market Intelligence, highlighted a “stalling domestic economy, weak export sales, and future cost concerns” as key drivers of the downturn. Business confidence fell to its lowest point in two years.
Small and medium-sized enterprises have been hit hardest during the downturn, while labor market pressures intensify. December saw the steepest job cuts since February, as firms moved to restructure in anticipation of 2025 National Insurance and minimum wage increases. Export sales also suffered due to weaker demand from Europe, Asia, and the US.
Input costs continued to rise, fueled by higher transportation, labor, and material expenses, with some increases linked to ongoing supply chain challenges. Looking ahead, the impact of Budget 2025 measures is expected to drive costs higher, potentially complicating BoE’s decision on further rate cuts despite mounting signs of economic stress.
Eurozone PMI manufacturing finalized at 45.1, Spain outshines peers with low China exposure
Eurozone PMI Manufacturing was finalized at 45.1 in December, down from November's 45.2, marking the sector’s 30th consecutive month of contraction. Key indicators, including new orders and inventory levels, signaled ongoing struggles across the bloc.
Cyrus de la Rubia, Chief Economist at Hamburg Commercial Bank, emphasized the continued downturn: “New orders have dropped even more than in the previous two months, crushing any hopes for a quick recovery.” Inventories of intermediate and finished goods declined sharply, reflecting weak demand expectations.
Job cuts persisted across Eurozone, with the pace of reductions remaining significant, despite a slight deceleration. This trend is expected to continue as companies restructure operations amid weak industrial activity.
Spain remained a bright spot, with its PMI rising to 53.3, indicating robust expansion. Greece also posted growth at 53.2, a five-month high. However, the largest economies continued to struggle: Germany (42.5) reached a three-month low, France (41.9) fell to a 55-month low, and Italy (46.2) managed only a slight improvement.
Spain’s relative resilience stems from its low export exposure to China (2%) and benefits from lower energy costs, which have helped it weather the industrial crisis better than its peers. However, with Spain accounting for only 12% of Eurozone GDP, its strength alone cannot offset the widespread industrial recession.
China’s Caixin PMI manufacturing falls back to 50.5 as downward pressures persist
China’s Caixin Manufacturing PMI dropped to 50.5 in December, down from 51.5 and below market expectations of 51.6, signaling a moderation in the sector's growth.
While supply and demand expanded modestly, external demand remained a significant drag, according to Wang Zhe, Senior Economist at Caixin Insight Group.
Zhe highlighted several challenges, noting that external demand was "sluggish", while job market suffered a "notable contraction." Additionally, sales prices were weak, and market optimism continued to decline.
The survey pointed to "prominent downward pressures", stemming from subdued domestic demand and challenging external conditions, which have squeezed profit margins and dented confidence.
The report also suggested that the impact of previous policy stimulus measures has yet to yield consistent results, with more time needed to gauge their effectiveness.
GBP/USD Mid-Day Outlook
Daily Pivots: (S1) 1.2481; (P) 1.2545; (R1) 1.2582; More...
GBP/USD's decline from 1.3433 resumed by breaking through 1.2474 support today. Intraday bias is back on the downside for 1.2298 cluster support zone. Strong support is expected there to contain downside to bring rebound, at least on first attempt. On the upside, break of 1.2606 minor resistance will indicate short term bottoming, and turn bias back to the upside for 1.2810 resistance next.
In the bigger picture, price actions from 1.3433 medium term are seen as correcting whole up trend from 1.0351 (2022 low). Deeper decline could be seen to 38.2% retracement of 1.0351 to 1.3433 at 1.2256, which is close to 1.2298 structural support. But strong support is expected there to bring rebound to extend the corrective pattern.
US initial jobless claims falls to 211k, vs exp 223k
US initial jobless claims fell -9k to 211k in the week ending December 28, below expectation of 223k. Four-week moving average of initial claims fell -3.5k to 223k.
Continuing claims fell -52k to 1844k in the week ending December 21. Four-week moving average of continuing claims fell -7k to 1871k.
A December to Forget for Yen
As the global markets reopen have the New Years’ Day, Japanese markets are closed for a holiday. It’s a very light economic calendar today, with no Japanese releases and only one US tier event – unemployment claims. In the European session, USD/JPY is currently trading at 157.12, down 0.12% on the day. We can expect a quiet day for the yen.
December was absolutely dismal for the yen, which lost which plunged 11% against the US dollar. On Tuesday, the yen dropped to 158.07 per dollar, its lowest level since early July. Investors are nervous that Tokyo could intervene in the currency markets in order to stem the yen’s sharp drop. Is the 160 level the red line in the sand for Japanese authorities?
Earlier in the week, Japan’s Manufacturing PMI was revised to 49.6, up from 49.5 in the initial estimate and above the November reading of 49.0. This marked the sixth straight deceleration in manufacturing activity but was the highest level since September. Manufacturers’ sentiment was relatively strong, with optimism for improvement in the semiconductor and auto markets, which have been hit hard over the past several months.
Is BoJ planning a January rate hike?
The Bank of Japan doesn’t typically telegraph its intentions to the market. One reason is the central bank doesn’t want to tip its hand to speculators, who are looking to cash in on the yen’s sharp swings. The BoJ summary of opinions from the December meeting provide some insights, as the summary indicated that some Bank policymakers are leaning toward a rate hike in the near future.
The summary showed that there is a split among the nine-member board over rate policy. The hawkish members argued that conditions are falling into place as inflation is steady and the yen is sliding lower. The doves countered that wage growth is lagging behind inflation. Governor Ueda could be the decisive vote and investors will be following his every word right up to the January 24 meeting.
USD/JPY Technical
- There is resistance at 157.38 and 158.09
- USD/JPY tested support at 156.70 earlier. Below, there is support at 155.59