
Sample Category Title
US ISM manufacturing improves to 49.3, but remains in contraction territory
US ISM Manufacturing PMI edged up from 48.4 to 49.3 in December, exceeding market expectations of 48.3. Despite the improvement, the index remained below the 50.0 threshold, signaling contraction for the ninth consecutive month and for the 25th time in the past 26 months.
The ISM highlighted that the December reading corresponds to an annualized 1.9% growth in real GDP, indicating a modest contribution to the broader economy.
Delving into the subcomponents, new orders climbed from 50.4 to 52.5, while production improved notably, rising from 46.8 to 50.3. However, employment fell sharply from 48.1 to 45.3. Additionally, prices accelerated, increasing from 50.3 to 52.5, pointing to renewed input cost pressures.
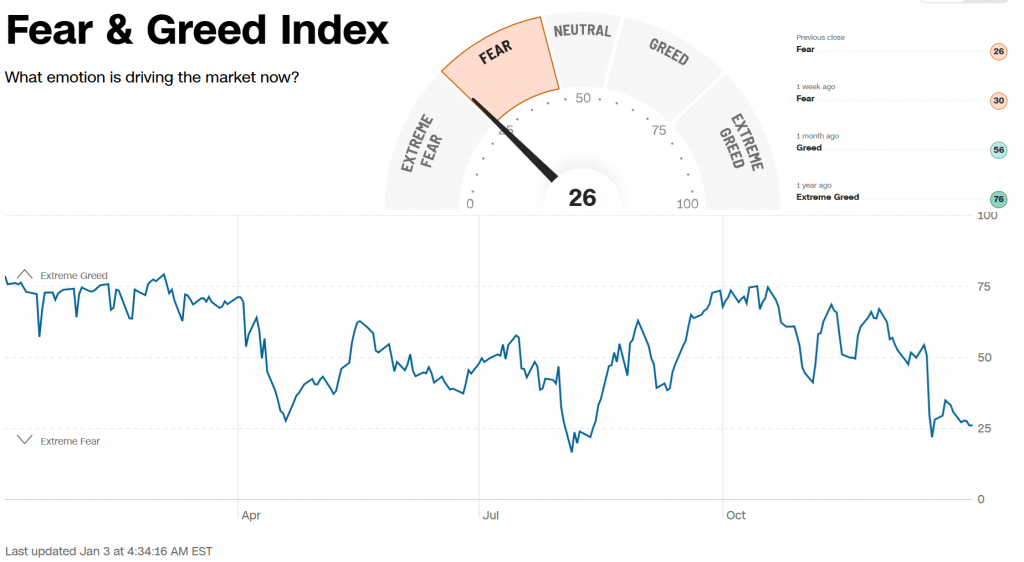
Stocks Start the Year in Fear
The US stock market is starting the year in a state of fear bordering on extreme fear – the opposite of a year ago when the market was balanced between ‘greed’ and ‘extreme greed’. That’s the conclusion we can draw from the CNN Business Sentiment Index.
A significant pressure on markets in December was the reversal in Fed rhetoric, with Powell’s speeches and official FOMC comments shifting towards fewer rate cuts. As a result, the probability of a rate cut at the end of January has fallen to around 10%. Markets are now pricing in a 50-point rate cut to the 3.75-4.00% range as the central scenario for year-end.
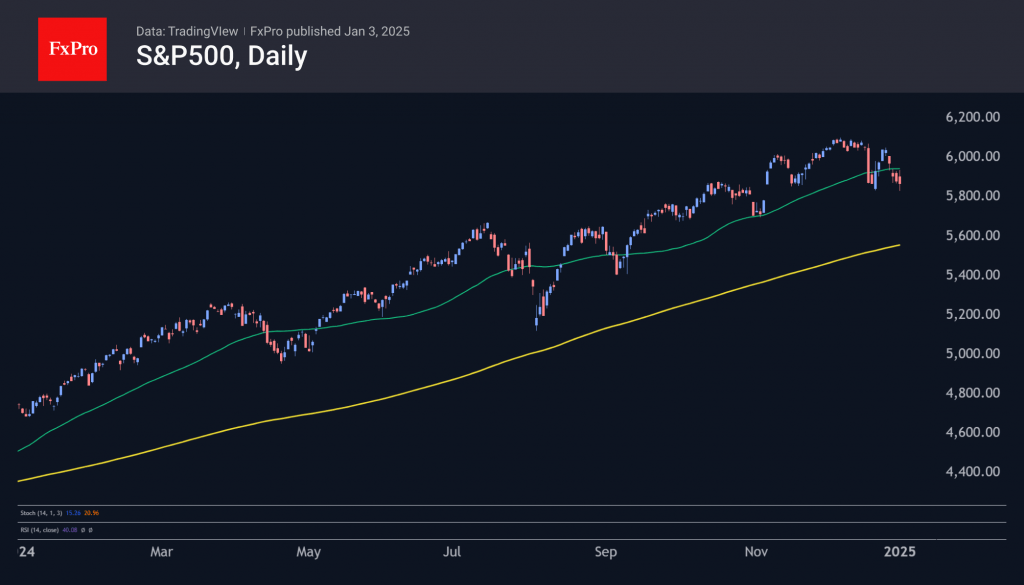
The Fed’s hawkish tone is the main reason the S&P500 is 3.5% below its December peak. While the low levels of the fear and greed index attracted buyers last year, we remain cautious about the markets.
Stock market dynamics in the first few days are often seen as spoilers for the whole year (the famous first five-day rule). As a result, the start of the year carries a high emotional charge that can highly influence traders’ behaviour.
The short-term technical picture is also worrying as the S&P500 failed in its attempt to break above its 50-day moving average in the first trading session on the 2nd. The Nasdaq100 failed to break above its own, and the Dow Jones fell back to its December lows, almost 6% off its historical highs.
With this start to the year, we are likely to see a test of the 200-day moving average soon, which defines the long-term trend. For the S&P500, it is now at 5575. In August, the market’s decline was halted as it approached it, and then it was helped by the Fed’s reversal of easing – the opposite of what we are seeing now.
However, the situation could be corrected this time around if we see an impressive growth reversal in the next few days. This would restore confidence in the bullish outlook for the new year despite a less dovish Fed and fading economic growth momentum.
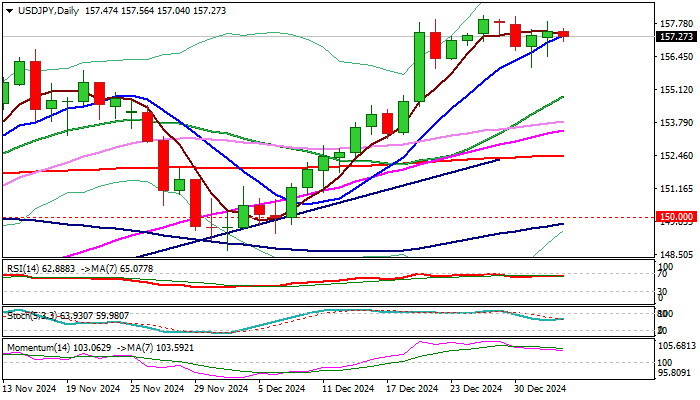
USD/JPY: Bulls Hold Grip for Further Gains, BoJ Intervention Looms
USDJPY – near term action remains in extended sideways mode under new multi-week high (158.07) and consolidating December’s 5% advance.
Limited dips (so far contained by rising 10DMA) suggest that larger bulls remain firmly in play and likely to resume after consolidation.
The dollar remains well supported by the latest hawkish shift in Fed’s interest rate view, gap between policies of Fed and other major central banks and expected strong demand for safe-haven assets on uncertain economic and political outlook
Bullish technical studies contribute to scenario of final acceleration towards psychological 160 barrier and possible retest of 2024 peak at 161.95 (multi-decade high), however, risk of BoJ intervention at this zone should be considered.
Res: 158.07; 158.86; 160.00; 161.00.
Sup: 157.01; 156.55; 156.00; 154.85.
British Pound Eyes US Manufacturing Data
The British pound has stabilized on Friday, after declining more than 1% a day earlier. In the European session, GBP/USD is currently trading at 1.2406, up 0.16% on the day.
The US economy is in solid shape, so much so that the Federal Reserve has lowered its rate cut projection for 2025 to just two rate cuts, compared to four rate cuts in the September forecast. The drver of the economy has been services activity, as the manufacturing sector remains in contraction.
US ISM Manufacturing PMI expected to contract
The week wraps up with US ISM Manufacturing PMI for December. The market estimate stands at 48.4, unchanged from the November reading. This follows the S&P Manufacturing PMI on Thursday, which eased to 49.4, down slightly from 49.7 in November. This was higher than the market estimate of 48.3 but still pointed to contraction.
In the UK, manufacturing is also struggling. The market estimate for December stands at 47.3, following a reading of 47.0 in November, which missed expectations and was the lowest level in 11 months. Manufacturers’ sentiment dropped to a two-year low and the outlook for manufacturing in 2025 is gloomy.
Inflation dropped to the Bank of England’s target of 2% in September, with a reading of 1.7%. Since then, however, inflation has rebounded and hit 2.6% in November, the highest level in eight months. BoE policy makers want to see inflation move back towards the 2% target before cutting rates. The BoE holds its next meeting on Feb. 6 and the December CPI report, which will be released on Jan. 15, will be a critical factor in the BoE rate decision. The BoE has joined the rate-cutting parade but has been cautious, delivering two quarter-point cuts in 2024.
GBP/USD Technical
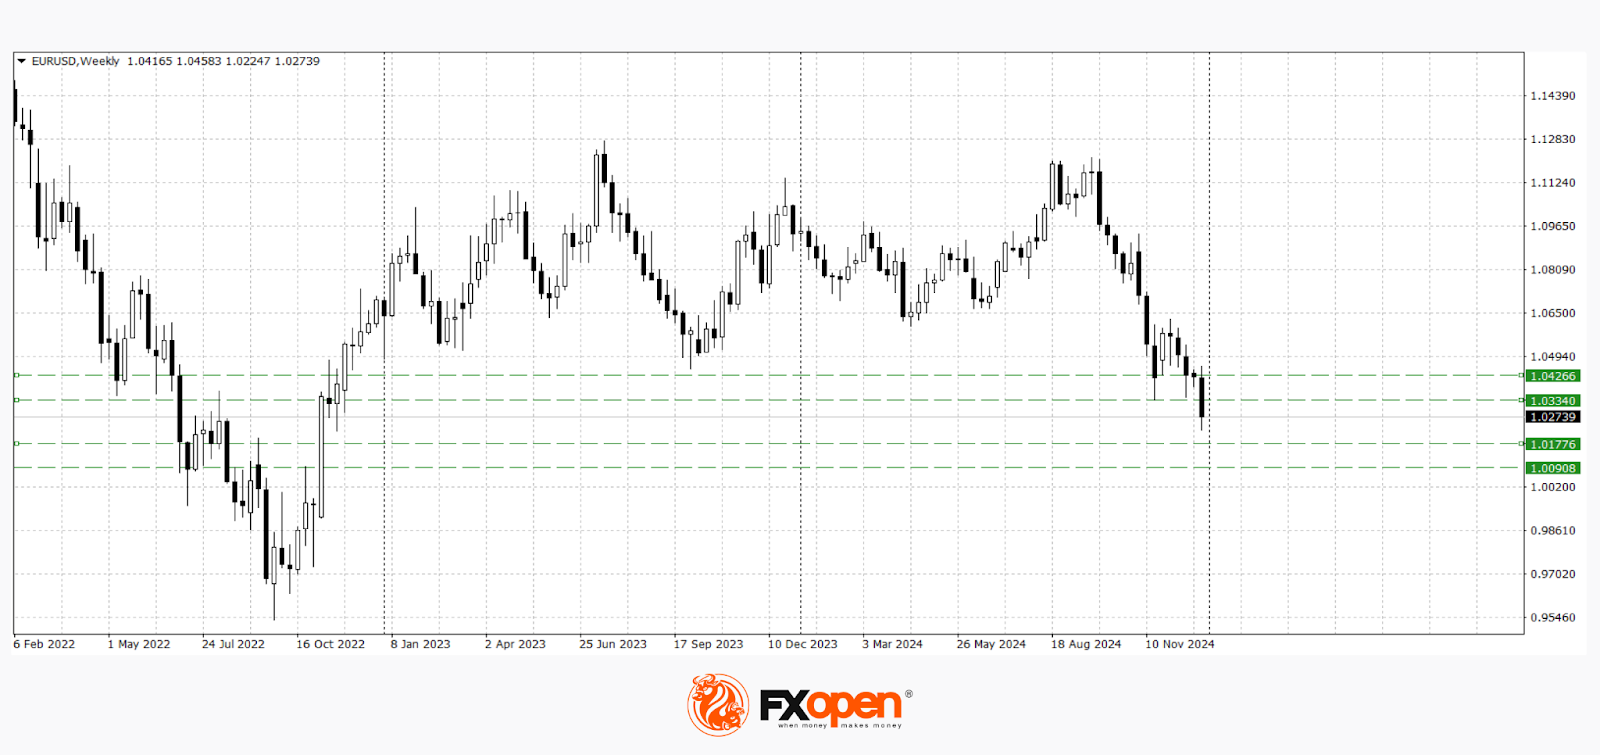
- GBP/USD is putting pressure on resistance at 1.2425. Above, there is resistance at 1.2497
- 1.2309 and 1.2237 are the next support levels
Yuan Pressure Against Dollar, But Rises Against CFETS Basket
The Chinese Yuan presented an interesting paradox in today’s market action. Onshore Yuan sank below 7.3 mark against US Dollar, registering a 14-month low. This decline has intensified speculation that the People's Bank of China might be adopting a more lenient stance toward currency depreciation. Such a move could be part of broader efforts to bolster economic growth amid mounting headwinds. The downward bias has been further fueled by the possibility of a renewed “Trade War 2.0” under the incoming US administration.
Conversely, the CFETS RMB Index—a measure of the Yuan’s trade-weighted performance against a basket of currencies—surged to its highest level since October 2022. Although primarily driven by the relative weakness of major currencies versus the Dollar, this uptick hints at potential challenges for China’s export competitiveness to other key markets.
These moves also coincide with CFETS basket weighting adjustments for 2025, including reductions in the weightings of Dollar (from 19.46% to 18.903%), Euro (from 18.08% to 17.902%), and Yen (from 8.963% to 8.584%).
The larger question remains: How far is China willing to let Yuan depreciate? This is a mounting question given the uncertainty surrounding any trade measures the US might impose after Donald Trump’s January 20 inauguration. Beijing’s true intentions would become clearer after that.
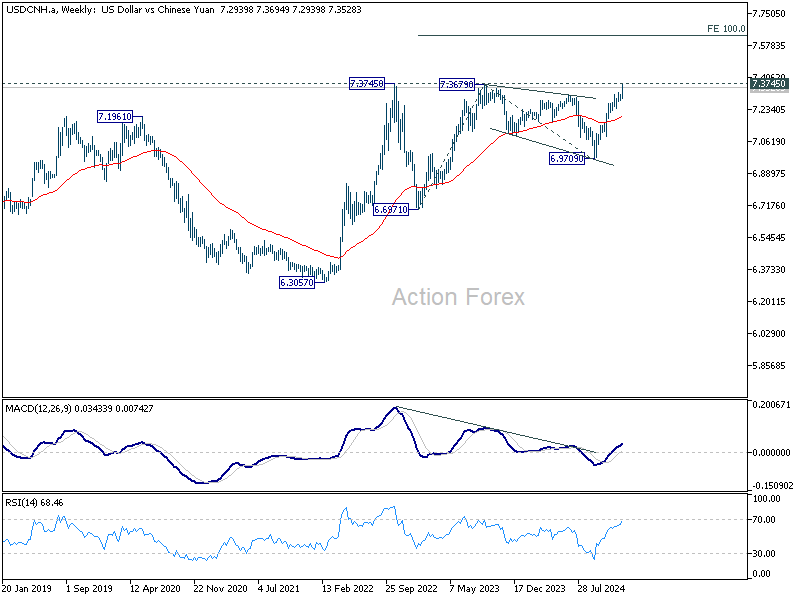
Technically, it does look like that USD/CNH (Dollar vs offshore Yuan) is ready to resume it's long term up trend from 6.3057 (2022 low). Decisive break of 7.3745 (2022 high) will pave the way to 100% projection of 6.6971 to 7.3673 from 6.9709 at 7.6411.
Euro Stabilizes as Spain Posts Strong Job Data
The euro has stabilized on Friday. In the European session, EUR/USD is currently trading at 1.0296, up 0.3% on the day. The euro fell as much as 1.2% a day earlier and fell below the 1.03 line for the first time since Nov. 2022.
The new euro locomotive is …. Spain?
The eurozone economy wasn’t exactly on fire in 2024. The Ukraine-Russia war led to increases in gas and oil prices, millions of war refugees have strained the economy and many eurozone countries have boosted their defense budget as relations with Moscow have chilled. In addition, global demand has been weak and the incoming Trump administration could spell tariffs and even a trade war.
Germany, which for decades was the locomotive of Europe, hasn’t recovered since the corona pandemic. Competition from China has hurt the key automotive industry and the government coalition has collapsed, resulting in political instability. France and Italy, the second and third largest economies in the eurozone, are also struggling.
The bright light is this gloomy picture has been Spain, the fourth-largest economy in the eurozone. “Sunny Spain” isn’t just a catchy phrase for winter-weary tourists, but also reflects a resilient economy. According to the European Commission, Spain’s economy is expected to have expanded by an impressive 3% in 2024. In contrast, Germany’s GDP is projected to have contrasted by -0.1%.
Spain’s manufacturing and services sectors are expanding, in contrast to the eurozone’s three largest economies which are showing contraction. The labor market remains solid and the number of unemployed fell by 25.3 thousand in December, the lowest figure since December 2007.
The European Central Bank entered an easing phase in June and has lowered rates at the past three straight meetings. The central bank is keeping an eye on inflation but is expected to continue lowering rates in order to boost the weak economy. The ECB meets next on January 30.
EUR/USD Technical
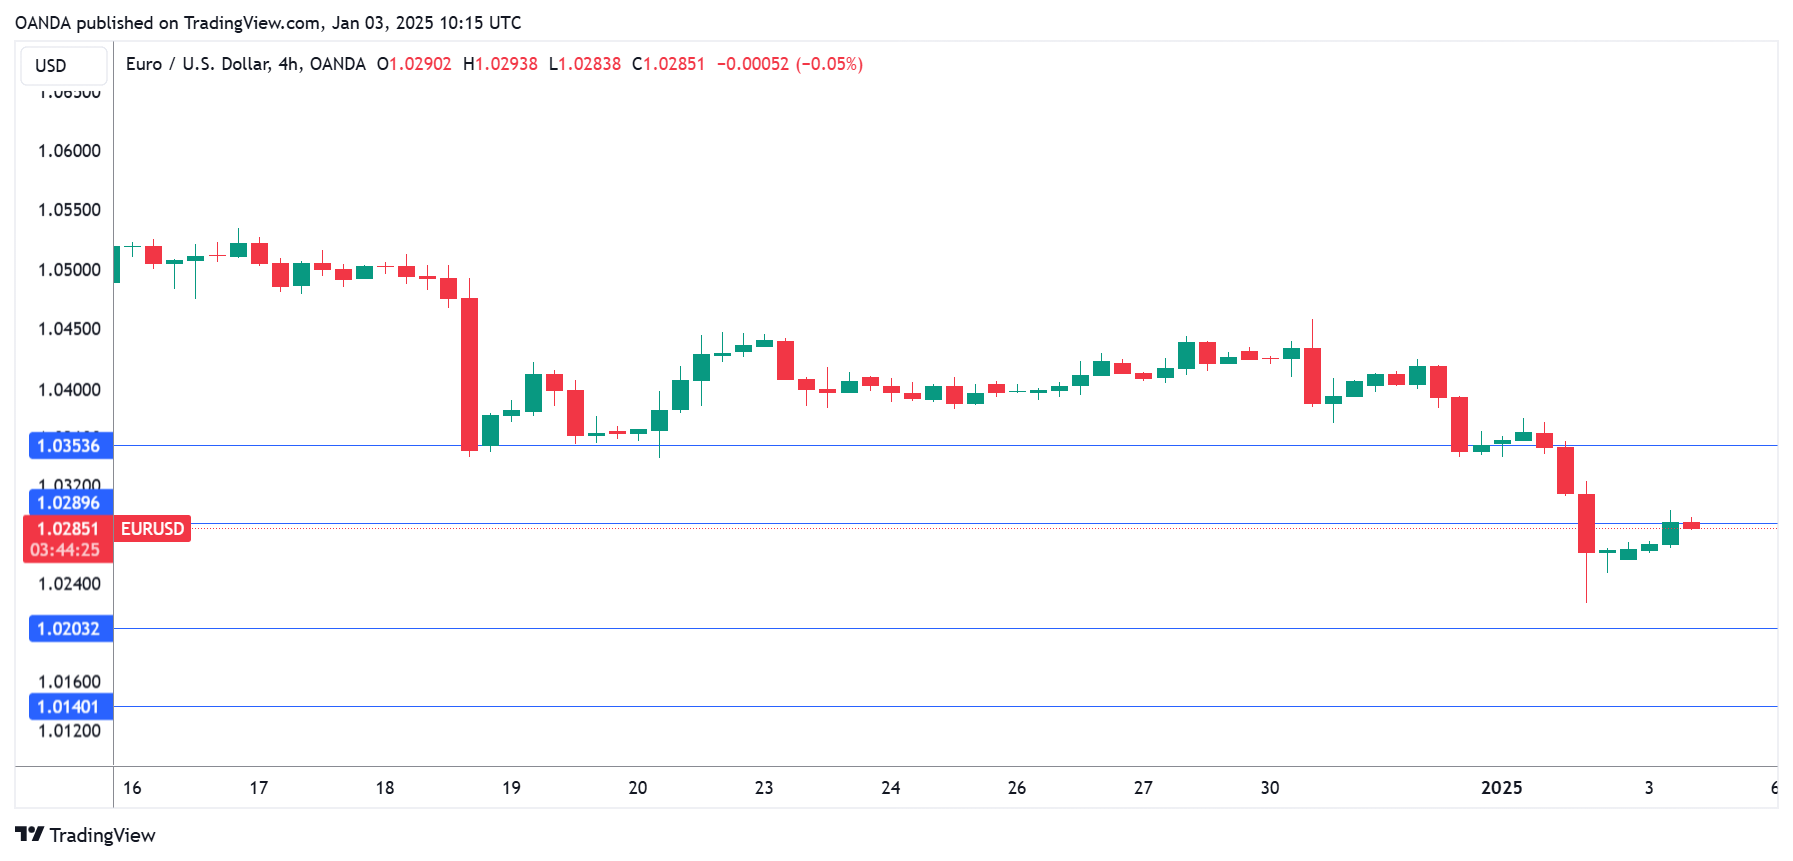
- EUR/USD is testing resistance at 1.0289. Above, there is resistance at 1.0353
- There is support at 1.0203 and 1.0139
EUR/USD Hits Last Year’s Lows, GBP/USD Drops Below 1.2400
This week, European and commodity currencies suffer. Euro sellers broke last year’s low of 1.0330 and stayed below 1.0300, the GBP/USD pair dropped below 1.2400, and USD/CAD buyers tested the 1.4400 level.
EUR/USD
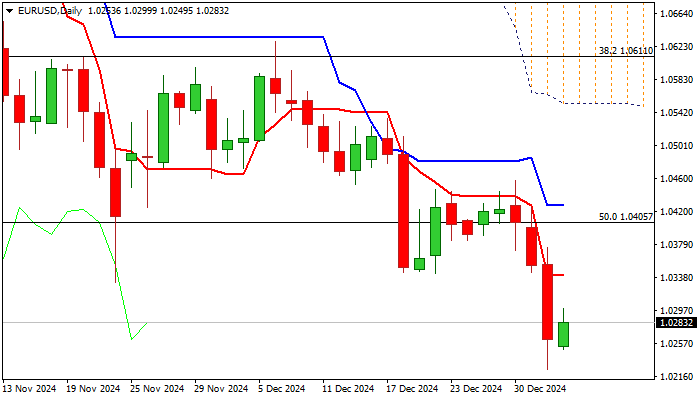
EUR/USD buyers failed to capitalise on the potential bullish correction signalled by the "Inverted Hammer" pattern. After a false breakout above 1.0450, the price sharply declined below the 2024 low at 1.0330. Yesterday, EUR/USD nearly reached the critical support level at 1.0220 but rebounded by the evening to 1.0270.
In the upcoming trading sessions, the pair might continue its correction toward recent highs at 1.0300–1.0330. If yesterday’s low at 1.0225 is breached, further downward movement to the 1.0100–1.0170 range might happen.
Key Events to Impact EUR/USD Today:
- 11:55 (GMT+2): German Unemployment Change
- 18:00 (GMT+2): US ISM Manufacturing PMI
- 19:00 (GMT+2): Speech by ECB Representative Philip Lane
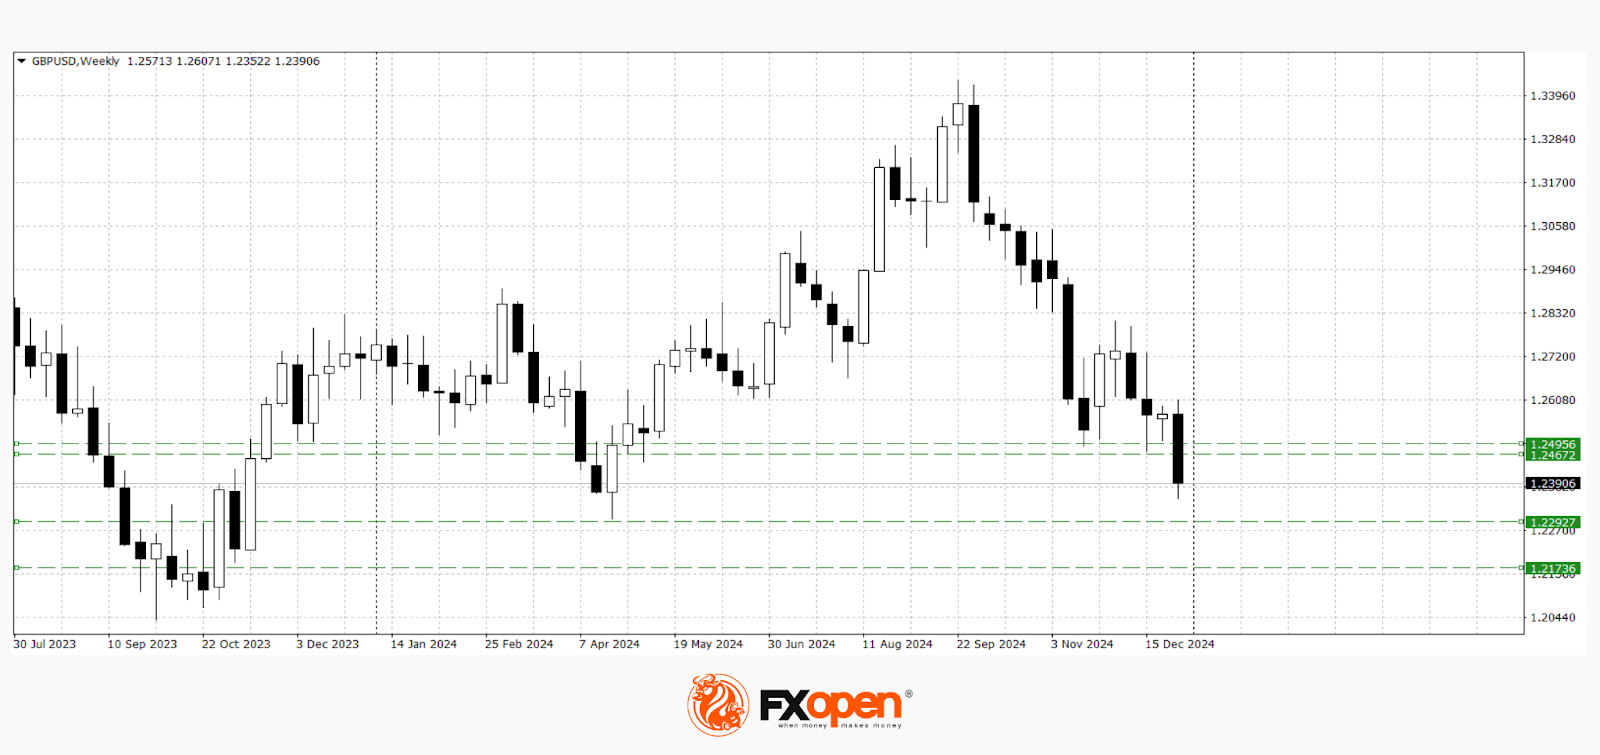
GBP/USD
Last week, GBP/USD buyers failed to sustain a move above 1.2600. Yesterday, the price not only broke the recent low at 1.2480 but also fell below 1.2400.
The next target for the downward movement could be the 2024 low at 1.2300. A corrective upward retracement might be to the 1.2460–1.2490 range. These levels previously acted as strong support and might now be tested as resistance before the start of a new bearish impulse.
Key Events to Impact GBP/USD Today:
- 12:30 (GMT+2): Bank of England Consumer Credit
- 12:30 (GMT+2): UK Mortgage Approvals
- 21:00 (GMT+2): Atlanta Fed GDPNow Index
Trade over 50 forex markets 24 hours a day with FXOpen. Take advantage of low commissions, deep liquidity, and spreads from 0.0 pips. Open your FXOpen account now or learn more about trading forex with FXOpen.
This article represents the opinion of the Companies operating under the FXOpen brand only. It is not to be construed as an offer, solicitation, or recommendation with respect to products and services provided by the Companies operating under the FXOpen brand, nor is it to be considered financial advice.
EURUSD: Larger Bears to Consolidate Before Resuming Lower, Parity Level Coming in Focus
EURUSD edges higher early Friday on a partial profit-taking at the end of the week, after the latest three-day acceleration pushed the price to the lowest levels in over two years.
Larger bears are likely to take a breather above important support at 1.0200 (Fibo 61.8% retracement of 0.9535/1.1275, Sep 2022 – July 2023 rally) and position for fresh push lower as 1.0200 marks the last significant obstacle on the way towards parity level, which came in focus as next target.
Daily Tenkan-sen / former low at 1.0350 zone offer solid resistance which should ideally cap and keep near term bears intact.
Technical picture remains firmly bearish on daily chart (strong negative momentum / MA’s in full bearish setup and price action weighed by thick falling daily Ichimoku cloud) and support scenario.
Only sustained break above 1.0430 (daily Kijun-sen) would sideline bears for stronger correction.
Res: 1.0345; 1.0405; 1.0430; 1.0460.
Sup: 1.0224; 1.0200; 1.0150; 1.0100.
Has USD/CAD Reached a Peak Point?
- USDCAD holds short-term range ahead of ISM manufacturing PMI.
- Bulls lose power but not the battle, uptrend intact above 1.4260.
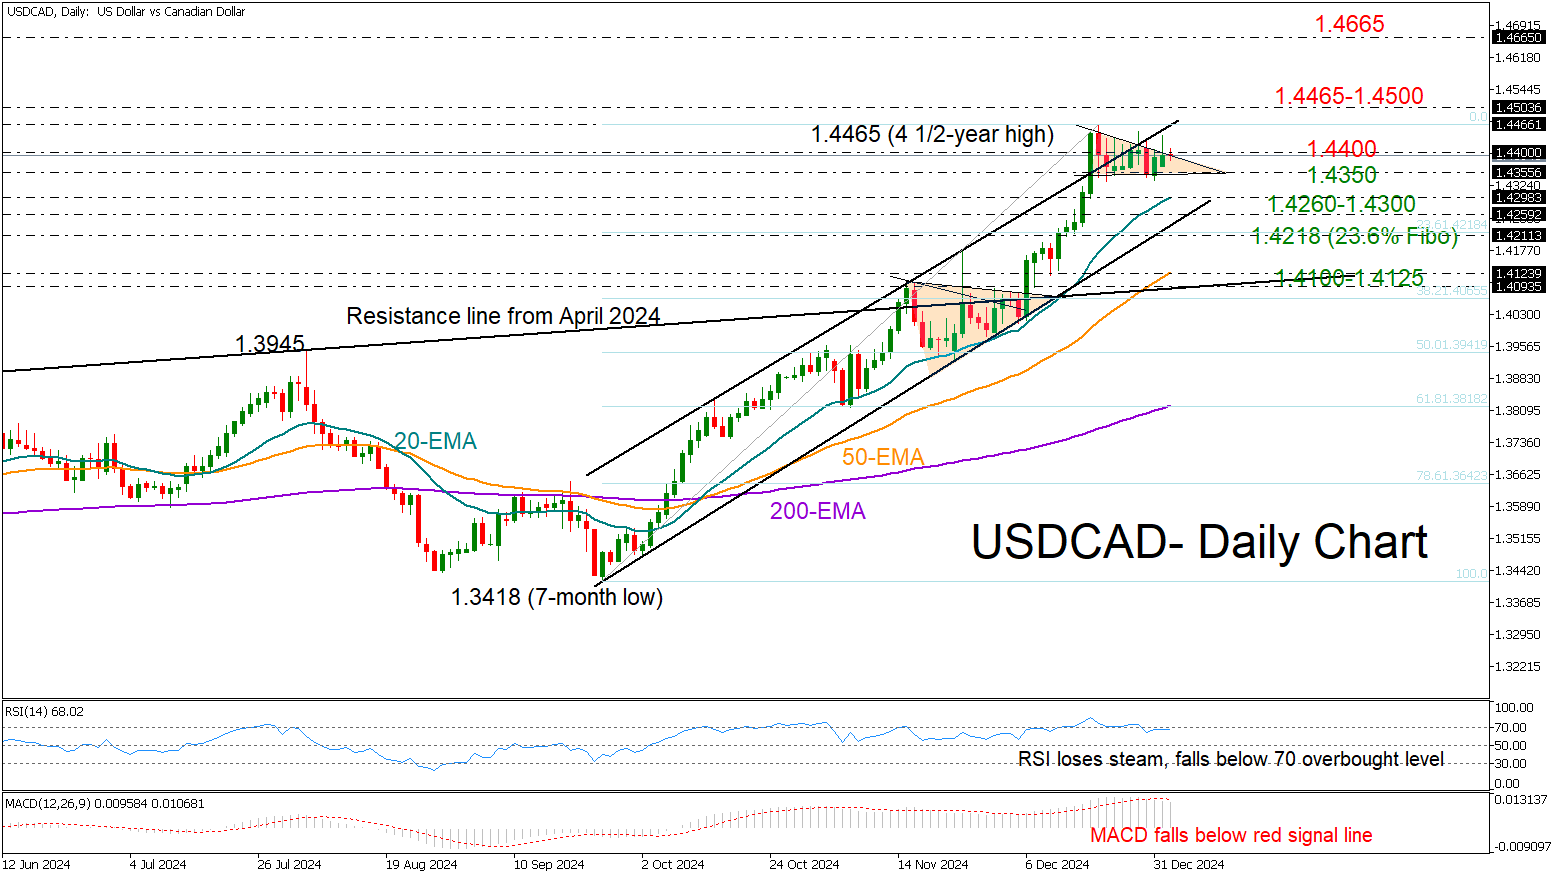
USDCAD is holding steady within the tight three-week-old range of 1.4350-1.4400 despite a brief rise to 1.4465 in the first trading day of 2025.
Technical indicators point to weakening buying sentiment, with the MACD decelerating below its red signal line and the RSI retreating from overbought territory. Despite this, the price seems to be forming a descending triangle at the top of its three-month-old uptrend, a pattern typically signaling continued bullish movement. Supporting this view, the exponential moving averages (EMAs) show a positive slope.
For a clearer bullish signal, the pair needs a close above 1.4400 and perhaps a sustainable move above the critical resistance zone of 1.4465-1.4500 before reaching the 2020 high of 1.4667. This is near the 2016 top of 1.4689, a break of which could open the door for the 1.4800 barrier last seen in 2003.
Alternatively, a slide below the 1.4350 floor could instantly pause near the 20-day EMA at 1.4300 or around the support trendline at 1.4260. If the 23.6% Fibonacci retracement of the September-December uptrend at 1.4218 fails too, the price could slide toward the 50-day EMA at 1.4125.
All in all, USDCAD is in a wait and see mode. A clear move above 1.4400 could trigger the next bull run, whilst a drop below 1.4350 may activate selling orders.
Crypto Hesitates to Grow Without Stocks
Market picture
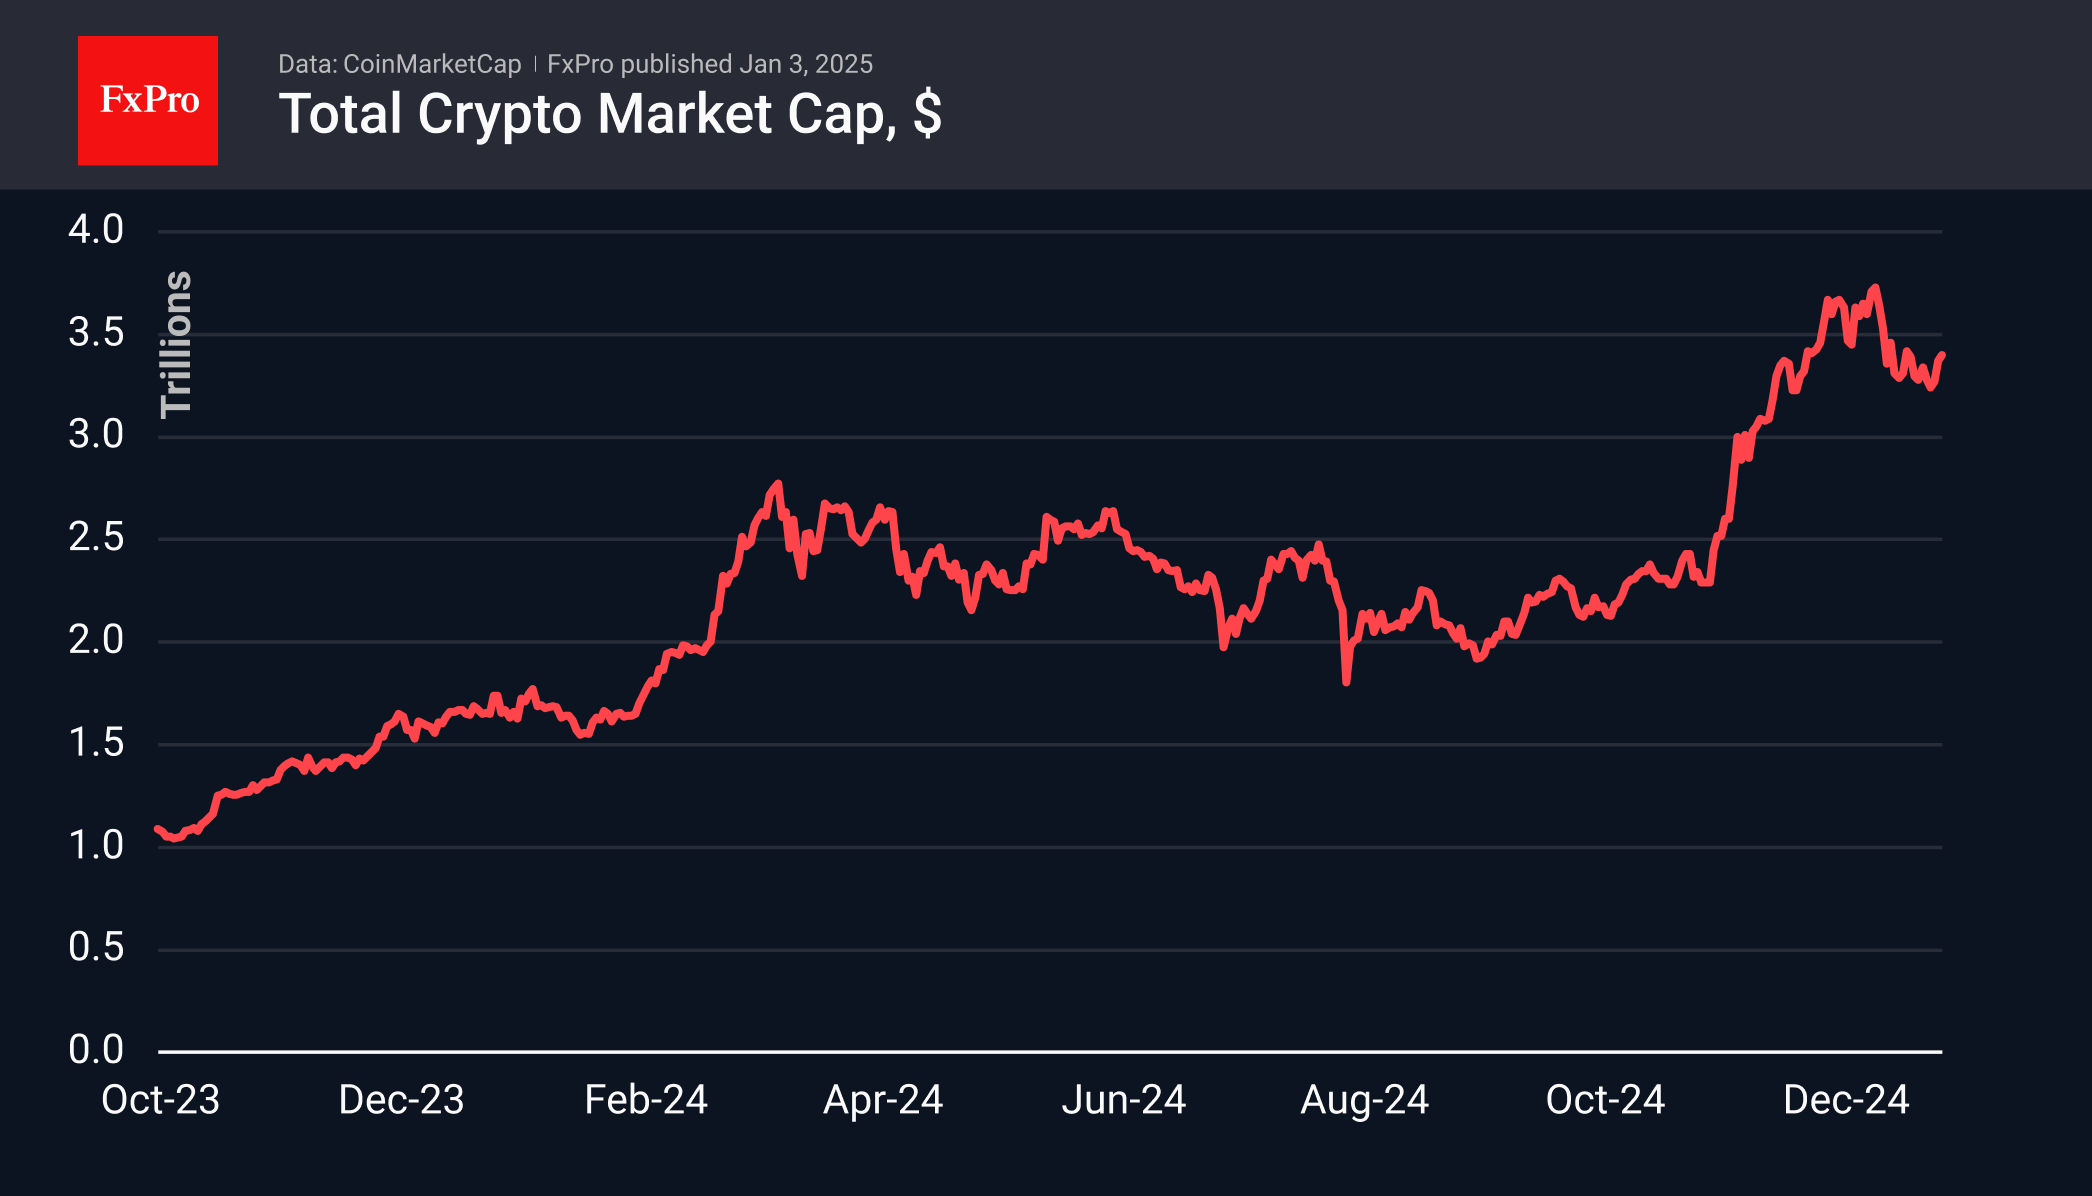
The crypto market is trying to start 2025 with growth, adding 4% since the beginning of the year. Like in late December, the market is stalling on reaching a capitalisation of $3.41 trillion. This time, the positive mood of cryptocurrency enthusiasts was undermined by a sharp downward reversal in the US and Chinese stock markets.
We pay attention to the reduced trading volumes, which indicate a wait-and-see attitude among market participants and a search for new ideas. At the same time, the support of around $3.20 trillion makes the latest pullback a correction, not a reversal.
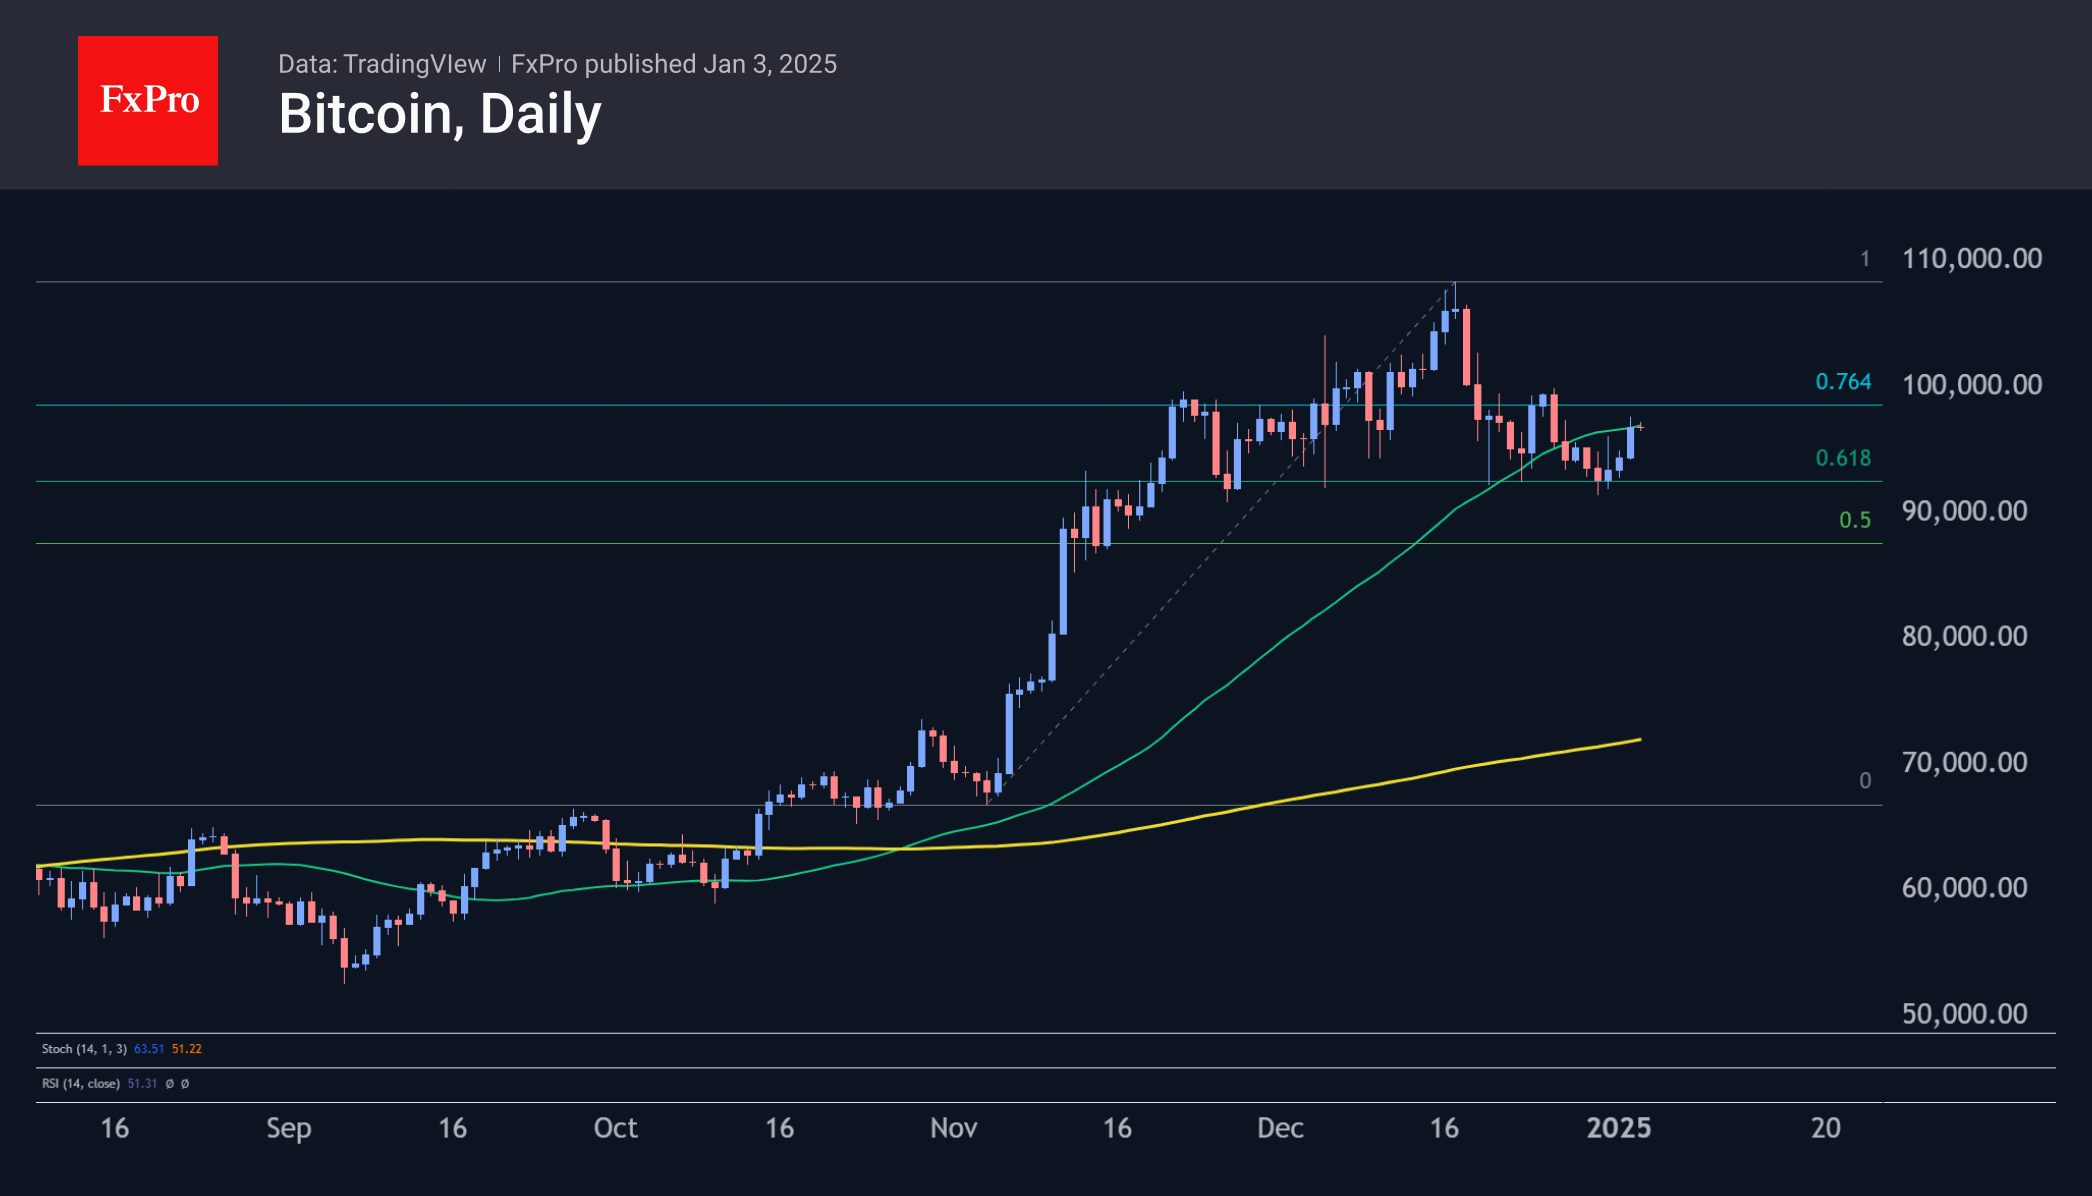
Bitcoin fell 3.5% to $93,600 in December. Growth for the full year of 2024 was 120% after 158% a year earlier. The first cryptocurrency has strengthened for seven months in the past year, becoming one of the year’s best-performing assets.
In terms of seasonality, January is considered a relatively successful month for BTC. Over the past 14 years, bitcoin has ended the month with growth on seven occasions. The average rise was 22.5%, while the average decline was 14.6%.
Technically, bitcoin has bounced off the 61.8% level from the November rally and is attempting to return above the 50-day moving average. A solid break above $97,000 will allow us to expect new highs above $110,000 soon. However, we should be prepared for a strengthening of selling, as we are currently seeing in equities.
News Background
IntoTheBlock notes that through 2024, the number of long-term Ethereum holders has been rising, while Bitcoin’s metric has been steadily declining. The percentage holding ETH for more than a year increased from 59% in January to 75% in December. For BTC, the metric dropped from around 70% to 62%.
Another recalculation increased the first cryptocurrency’s mining difficulty by 1.08%, reaching a record of 109.78 T. The average hash rate for the period since the previous change was 777 EH/s.
MicroStrategy purchased an additional 2,138 BTC for ~$209 million over the past week at an average price of around $97.837 per coin. The company holds 446,400 BTC purchased for a combined $27.9bn at an average price of $62,428 per coin.
CoinGecko calculated the profitability of crypto market sectors in 2024. The most profitable narrative of the crypto industry was AI. Second and third place went to meme coins and RWAs.
CryptoQuant notes that Coinbase’s premium has reached a 12-month low. This signals insufficient institutional demand and caution among US investors.