Sample Category Title
USD/JPY Weekly Outlook
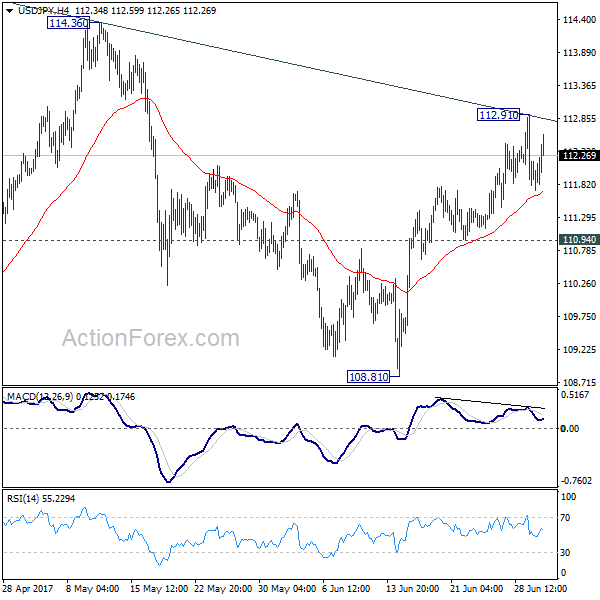
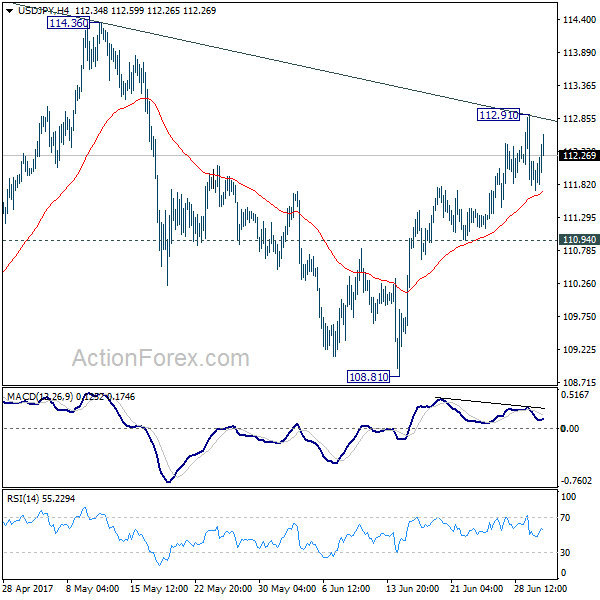
USD/JPY rose further to as high as 112.91 last week but failed to break through medium term channel resistance and retreated. With a temporary top formed, initial bias is neutral this week first. Near term outlook stays cautiously bullish as long as 110.94 support holds. Sustained break of the medium term channel resistance will argue that whole pull back from 118.65 has completed at 108.12 already. In such case, further rise should be seen to 114.36 resistance for confirmation. However, break of 110.94 will argue that rebound from 108.81 has completed and will turn bias back to the downside for this support instead.
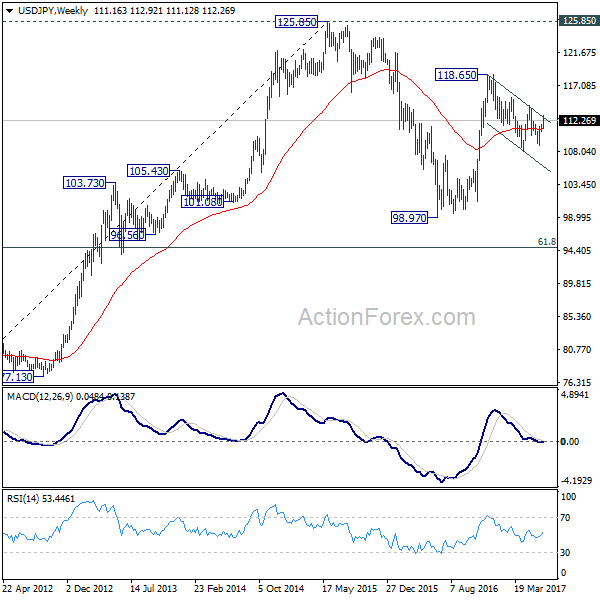
In the bigger picture, the corrective structure of the fall from 118.65 suggests that rise from 98.97 is not completed yet. Break of 118.65 will target a test on 125.85 high. At this point, it's uncertain whether rise from 98.97 is resuming the long term up trend from 75.56, or it's a leg in the consolidation from 125.85. Hence, we'll be cautious on topping as it approaches 125.85. Meanwhile,
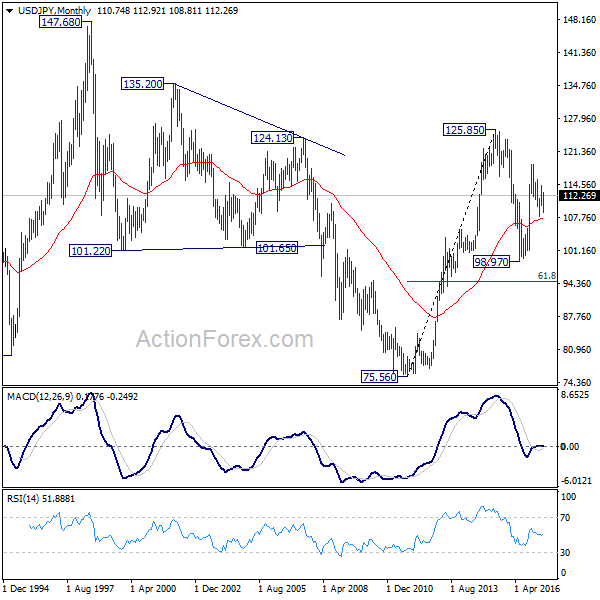
In the long term picture, the rise from 75.56 long term bottom to 125.85 top is viewed as an impulsive move. Price actions from 125.85 are seen as a corrective move which could still extend. But, up trend from 75.56 is expected to resume at a later stage for above 135.20/147.68 resistance zone.
GBP/USD Weekly Outlook
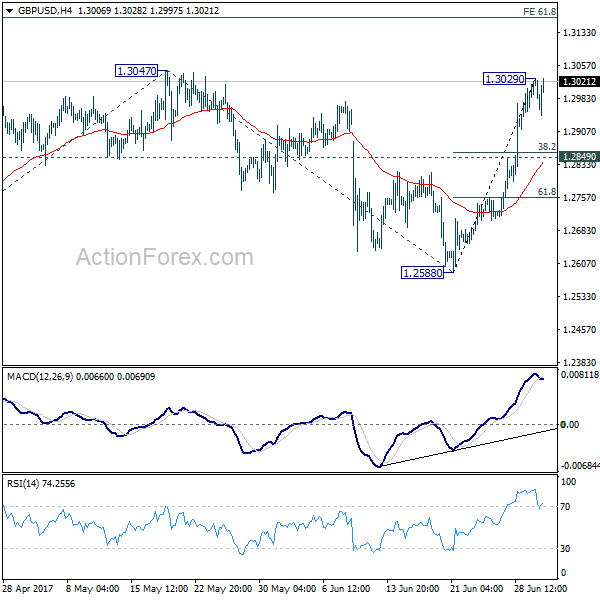
GBP/USD's strong rally last week indicates that pull back from 1.3047 has completed at 1.2588 already. And the larger correction from 1.1946 is still in progress. With a temporary top formed at 1.3029, initial bias is neutral this week first. In case of another fall, downside should be contained by 1.2849 support to bring rise resumption. Break of 1.3029 will send GBP/USD through 1.3047 to 61.8% projection of 1.2108 to 1.3047 from 1.2588 at 1.3168 next.
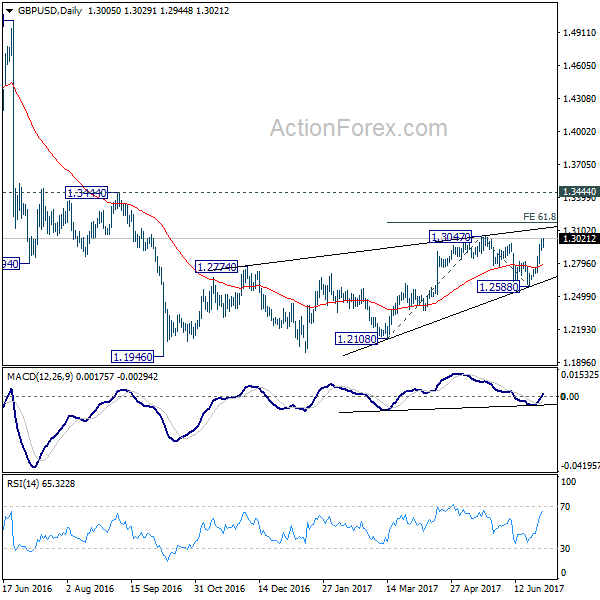
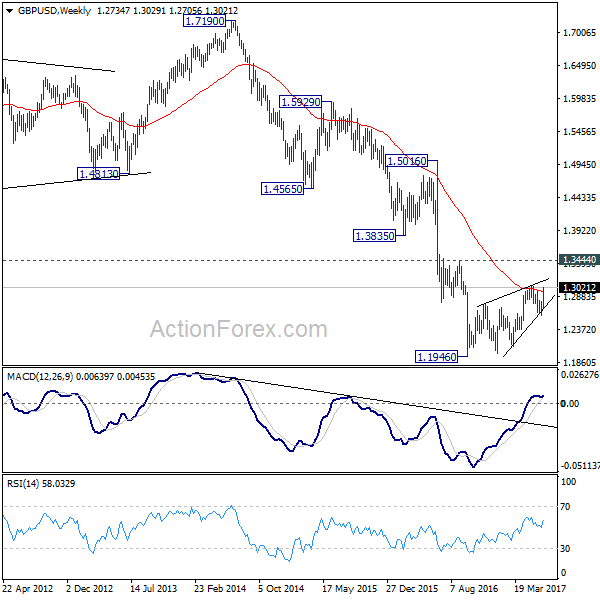
In the bigger picture, overall, price actions from 1.1946 medium term low are seen as a corrective pattern that is still in progress. While further upside is now in favor, overall outlook remains bearish as long as 1.3444 key resistance holds. Larger down trend from 1.7190 is expected to resume later after the correction completes. And break of 1.2588 will indicate that such down trend is resuming.
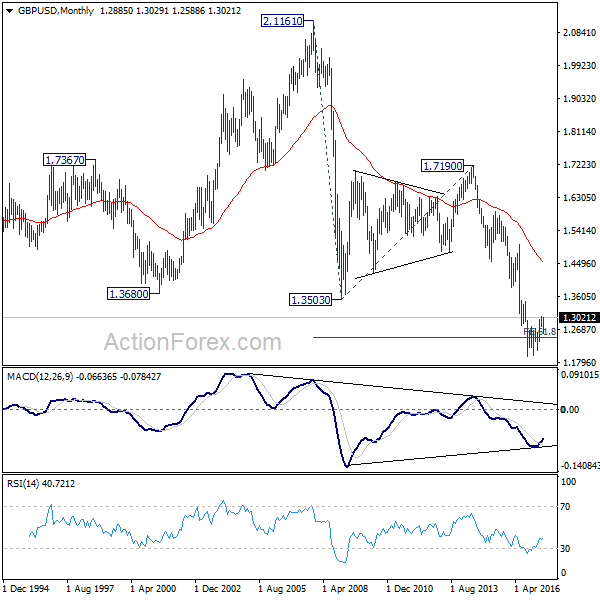
In the longer term picture, no change in the view that down trend from 2.1161 is still in progress. On resumption, such decline would extend deeper to 100% projection of 2.1161 to 1.3503 from 1.7190 at 0.9532. However, firm break of 1.3444 should confirm reversal and turn outlook bullish.
USD/CHF Weekly Outlook
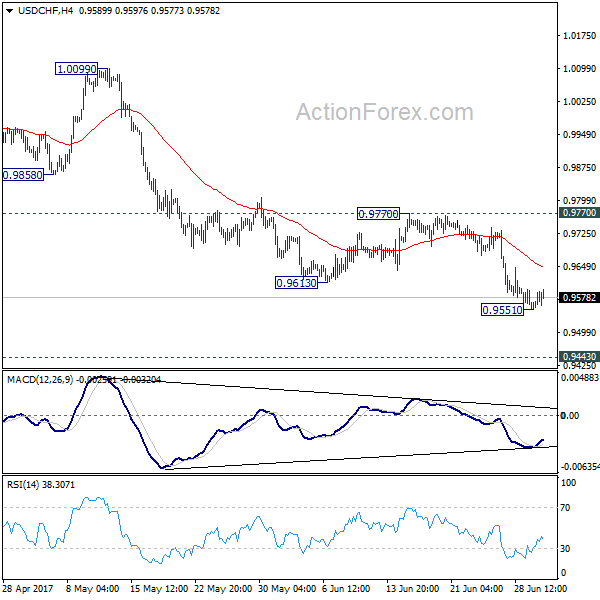
USD/CHF's down trend from 1.0342 resumed last week and reached as low as 0.9552. A temporary low is in place and initial bias is neutral this week for some consolidation first. Upside of recovery should be limited below 0.9770 resistance and bring another decline. Below 0.9551 will target 0.9443 key support level. At this point, we'd expect strong support from there to bring rebound.
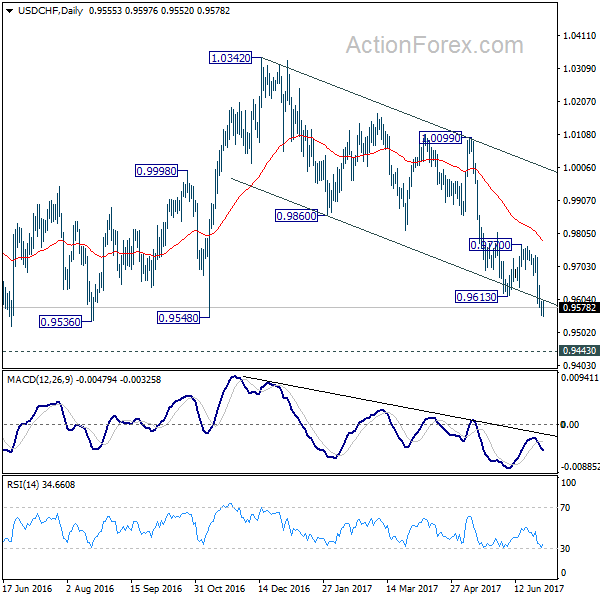
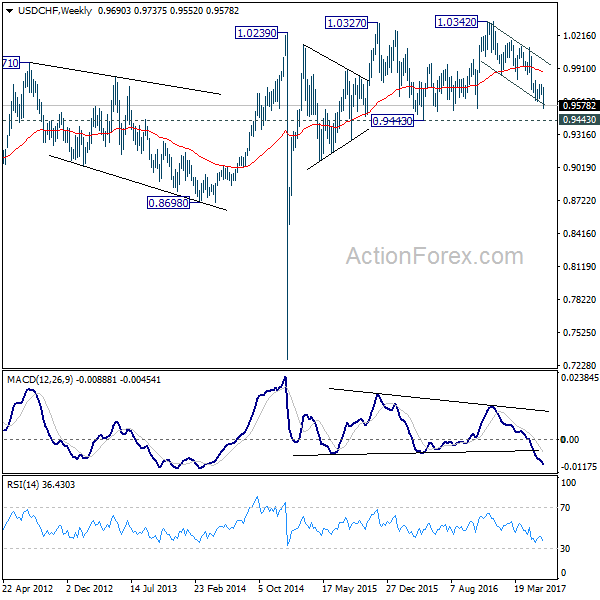
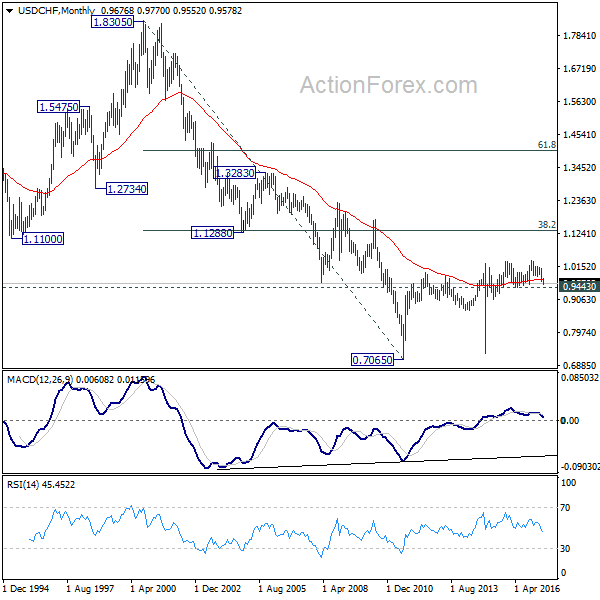
In the bigger picture, USD/CHF is still bounded in medium term range of 0.9443/1.0342 for the moment. Consolidative trading would likely continue and medium term outlook remains neutral. Break of 1.0342 key resistance is needed to confirm underlying bullish momentum in the pair. Meanwhile, downside attempts should be contained by 0.9443 key support level. However, sustained break of 0.9443 will carry larger bearish implication and target 0.9 handle.
AUD/USD Weekly Outlook
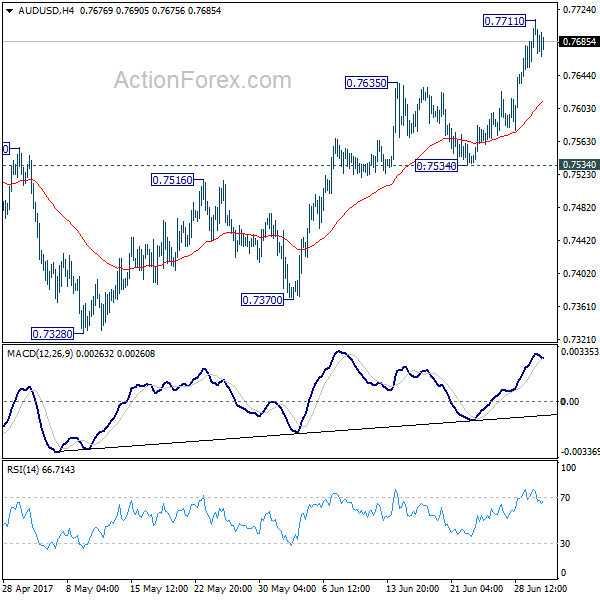
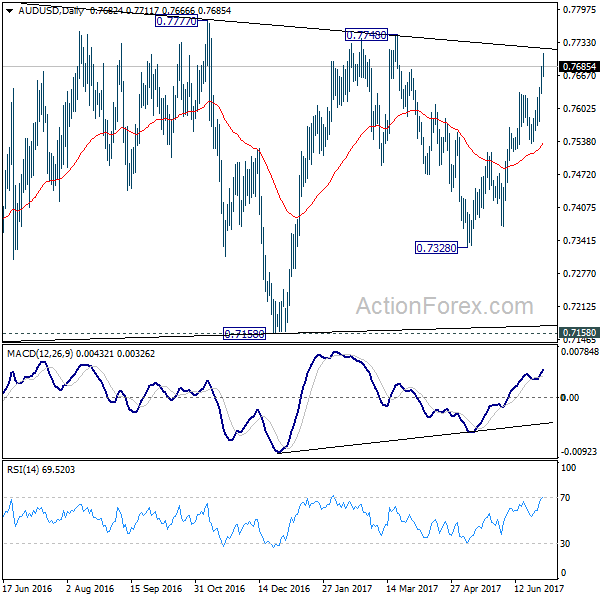
AUD/USD's rally from 0.7328 resumed last week and reached as high as 0.7711. A temporary top is formed and initial bias is neutral this week for consolidation first. Another rise is expected as long as 0.7534 support holds. Above 0.7711 will target 0.7748 resistance and above. At this point, there is no clear sign of range breakout yet. Hence, we'd be cautious on topping again as it approaches medium term fibonacci level at 0.7849. On the downside, break of 0.7534 will indicate near term reversal and turn bias back to the downside for 0.7370 support.
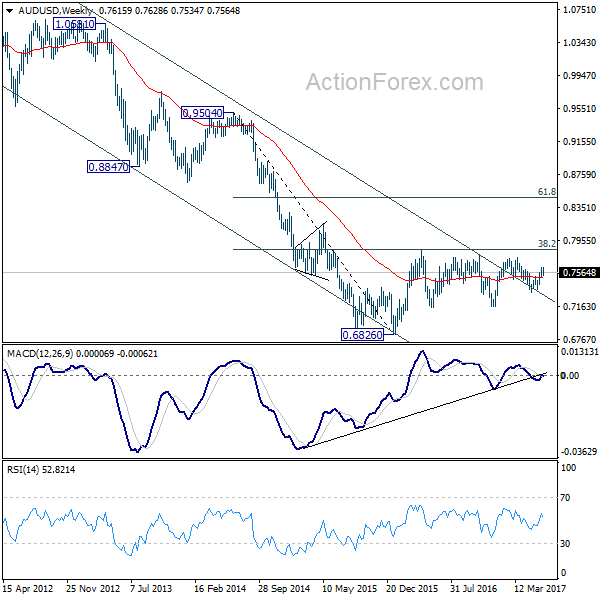
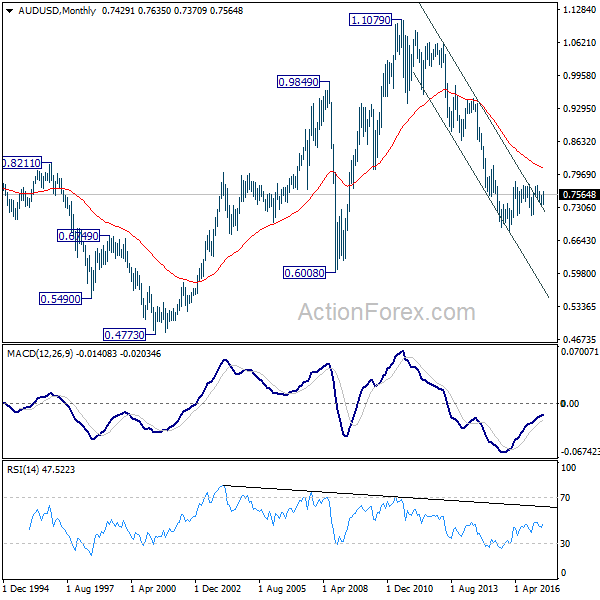
In the bigger picture, we're still treating price actions from 0.6826 low as a corrective pattern. And, as long as 38.2% retracement of 0.9504 to 0.6826 at 0.7849 holds, long term down trend from 1.1079 is expected to resume sooner or later. Break of 0.6826 low will target 0.6008 key support level. However, firm break of 0.7849 will indicate that rise from 0.6826 is developing into a medium term rebound, rather than a sideway pattern. In such case, stronger rise should be seen to 55 month EMA (now at 0.8096) and above.
In the longer term picture, while the down trend from 1.1079 might extend lower, we're not anticipating a break of 0.6008 (2008 low) yet. We'll look for bottoming above there to reverse the medium term trend.
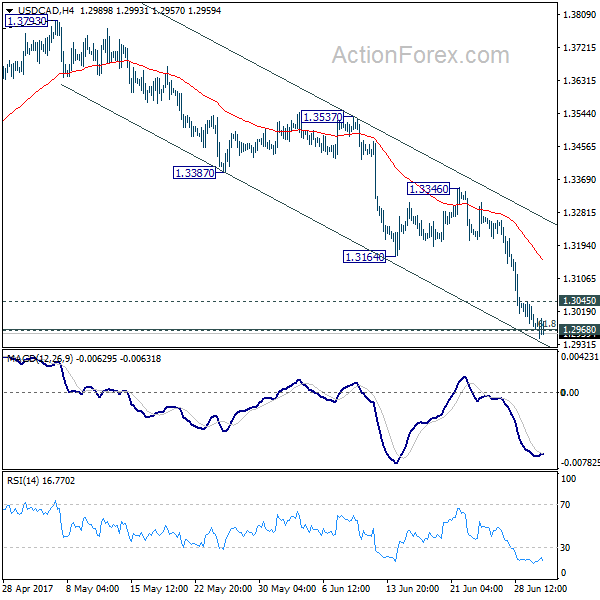
USD/CAD Weekly Outlook
USD/CAD's decline accelerated last week to as low as 1.2945. 1.2968 cluster support, 61.8% retracement of 1.2460 to 1.3793 at 1.2969 was already met but there is no clear sign of bottoming yet. Initial bias stays on the downside this week. As noted before, corrective rise from 1.2460 has completed at 1.3793 already. Sustained trading below 1.2968/9 will target 1.2460 next. On the upside, above 1.3045 minor resistance will indicate short term bottoming and bring rebound back to 1.3164 support turned resistance first.
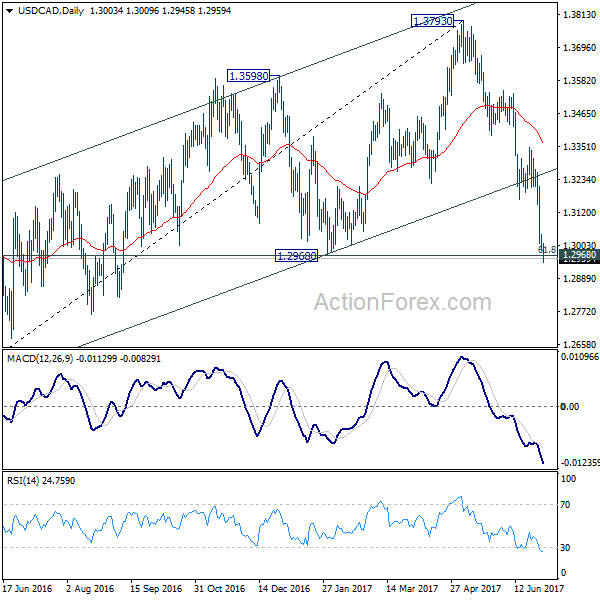
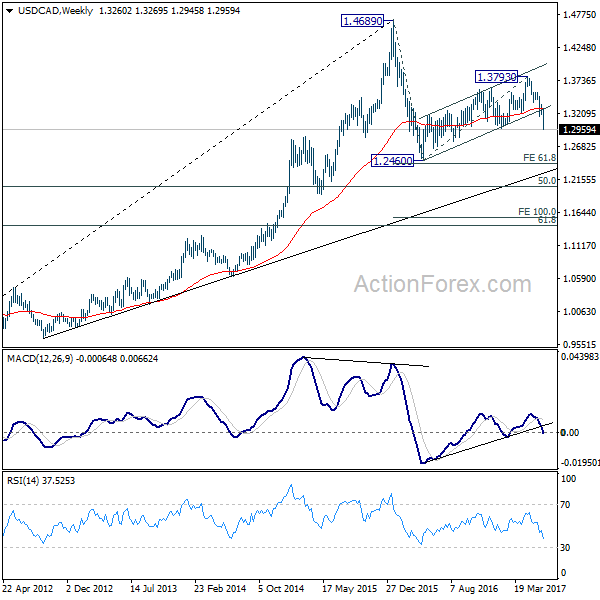
In the bigger picture, price actions from 1.4689 medium term top are seen as a correction pattern. The second leg should have finished at 1.3793. Break of 1.2460 will tend such correction to 50% retracement of 0.9406 to 1.4869 at 1.2048. At this point, we'd look for strong support from there to contain downside and bring rebound. However, firm break there will target 100% projection of 1.4689 to 1.2460 from 1.3793 at 1.1564.
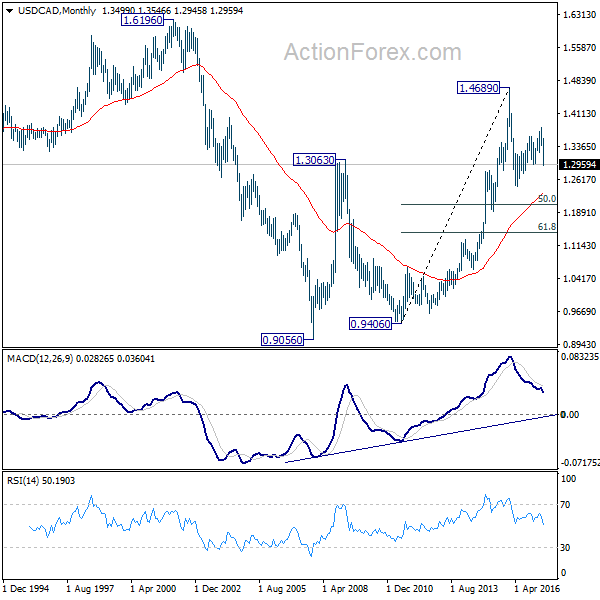
In the longer term picture, rise from 0.9056 (2007 low) is viewed as a long term up trend. It's taking a breath after hitting 1.4689. But such rise expected to resume later to test 1.6196 down the road. But firm break of 50% retracement of 0.9406 to 1.4869 at 1.2048 will raise doubt over this view.
GBP/JPY Weekly Outlook
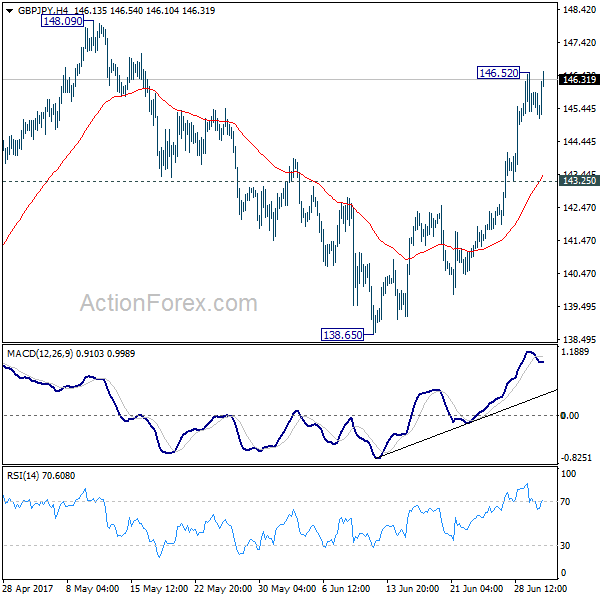
GBP/JPY's sharp rise last week confirmed that pull back from 148.09 has completed at 138.65 already. With a temporary top in place at 146.52, intraday bias is neutral this week first for consolidation. But downside of retreat should be contained by 143.25 minor support and bring rally resumption. Above 146.52 will turn bias to the upside to retest 148.09/42 resistance zone. Decisive break there will extend whole rally from 122.36 to long term fibonacci level at 150.43 next.
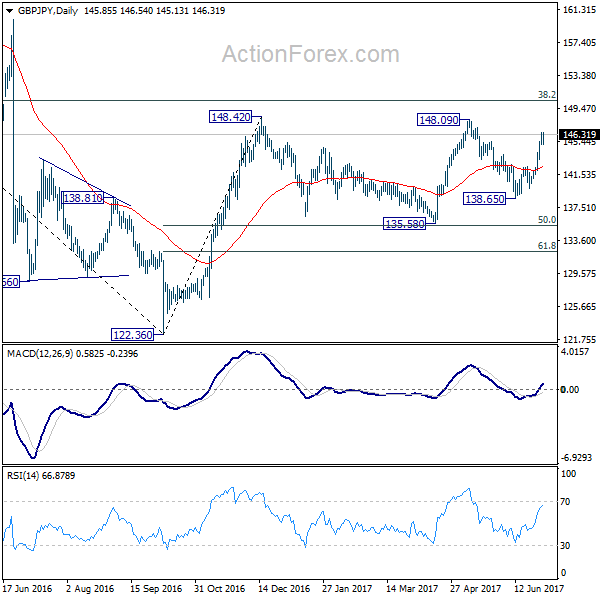
In the bigger picture, rise from medium term bottom at 122.36 is expected to continue to 38.2% retracement of 196.85 to 122.36 at 150.43. Decisive break there will carry long term bullish implications and pave the way to 61.8% retracement at 167.78. In case the sideway pattern from 148.42 extends, we'd be looking for strong support from 135.58 and 50% retracement of 122.36 to 148.42 at 135.39 to contain downside.
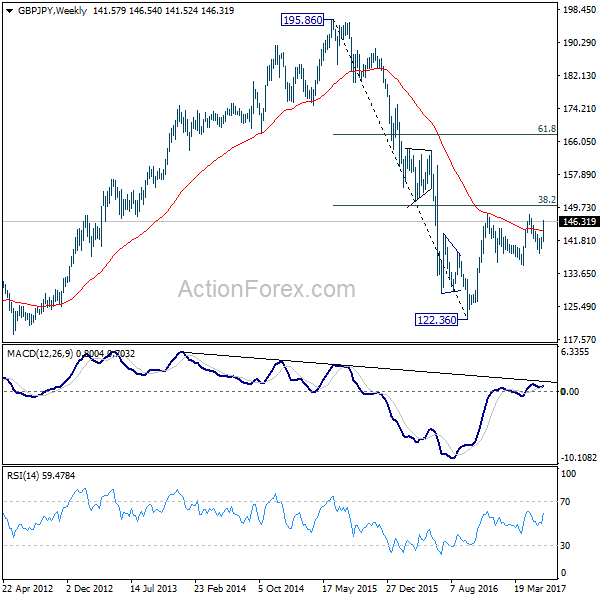
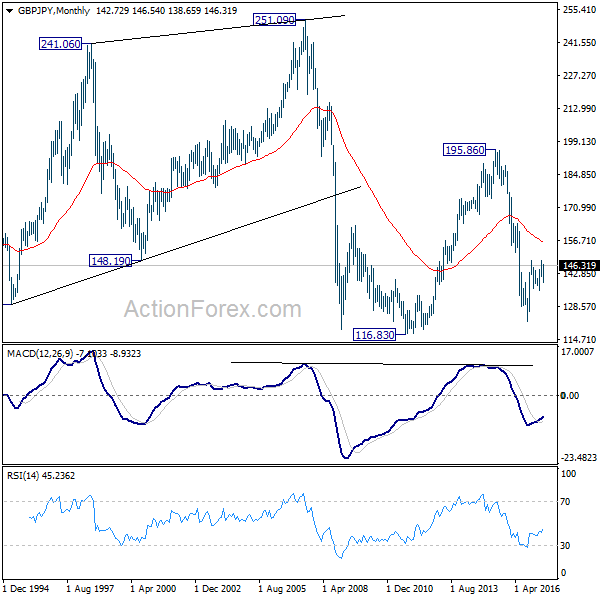
In the longer term picture, it remains to be confirmed is whole down trend from 195.86 has completed at 122.36 already and there is no confirmation yet. But in any case, firm break of 38.2% retracement of 196.85 to 122.36 at 150.43 would pave the way to 61.8% retracement at 167.78. And with that, the 55 month EMA will be firmly taken out which suggests that price actions from 116.83 is indeed a sideway pattern that could last more than a decade.
EUR/JPY Weekly Outlook
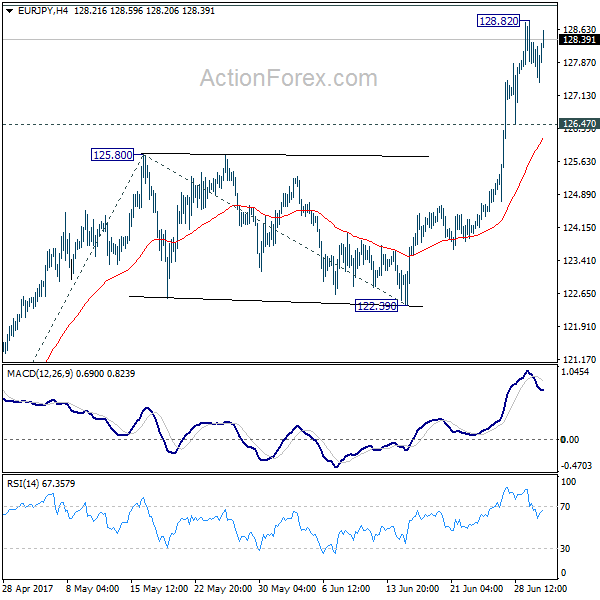
EUR/JPY's rally resumed last week and surged to as high as 128.82. A temporary top is formed there and initial bias is neutral this week for consolidation. Downside of retreat should be contained by 126.47 support to bring rise resumption. Above 128.82 will target 61.8% projection of 114.84 to 125.80 from 122.39 at 129.16 first . That's also close to medium term projection level at 129.89.
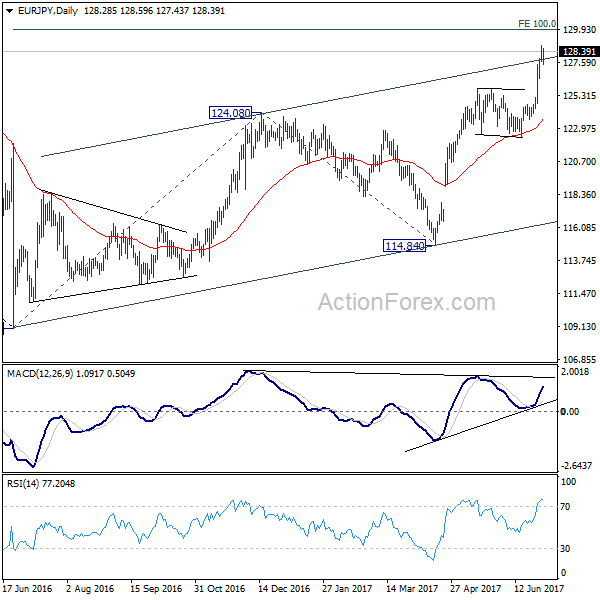
In the bigger picture, the break of 126.09 support turned resistance should have confirmed completion of down trend form 149.76 (2014 high), at 109.03 (2016 low). Current rise from 109.03 should target 100% projection of 109.03 to 124.08 from 114.84 at 129.89 first. Break there will pave the way to 61.8% retracement of 149.76 to 109.03 at 134.20 and above. Medium term outlook will now remain bullish as long as 122.39 support holds.
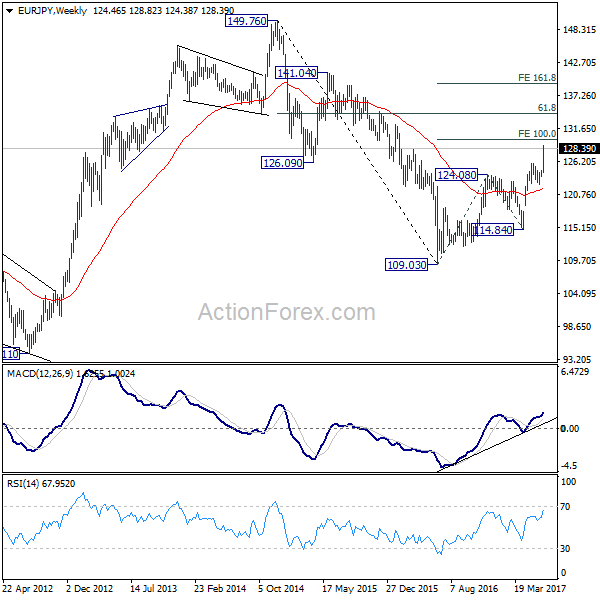
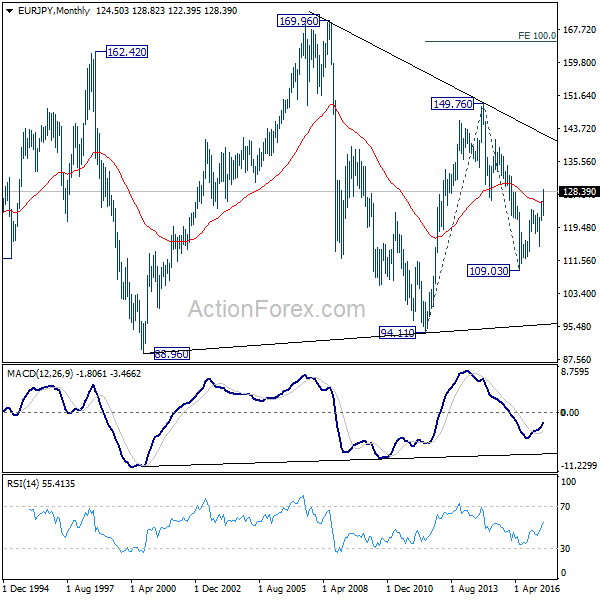
In the long term picture, the down trend from 149.76 should have completed at 109.03 already. At this point, there is clear indication that rise from 109.03 is resuming that from 94.11. Hence, we'd be cautious on topping below 149.76 to extend range trading. Nonetheless, firm break of 149.76 will indicates strong underlying buying. In such case, EUR/JPY will target 100% projection of 94.11 to 149.76 from 109.03 at 164.68.
EUR/GBP Weekly Outlook
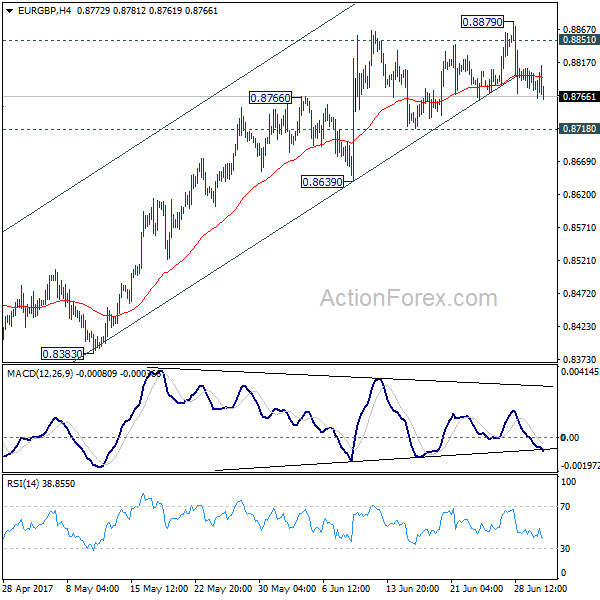
EUR/GBP edged higher to 0.8879 last week but failed to sustain above 0.8851 resistance and retreated. Initial bias is neutral this week first. On the upside, break of 0.8718 support will argue that rise from 0.8312 has completed. In that case, intraday bias with be turned back to the downside for lower side of the range at 0.8312. Meanwhile, break of 0.8879 and sustained trading above 0.8851 will pave the way to retest 0.9304 high.
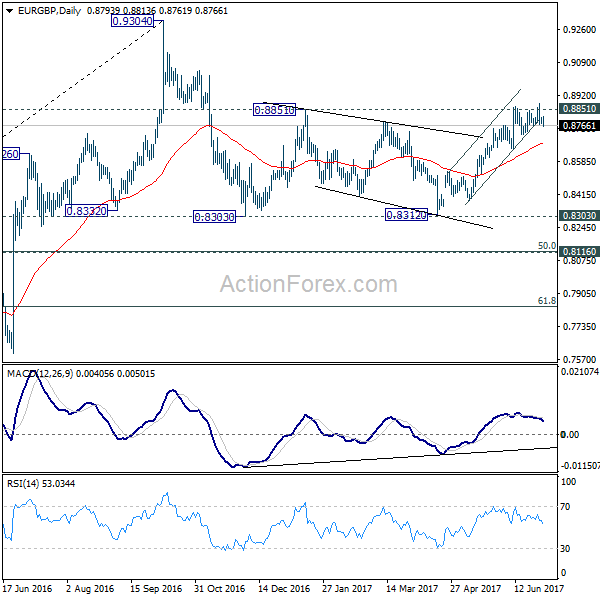
In the bigger picture, price actions from 0.9304 are viewed as a medium term corrective pattern. It's uncertain whether it is finished yet. But in case of another fall, we'd expect strong support from 0.8116 cluster support (50% retracement of 0.6935 to 0.9304 at 0.8120) to contain downside and bring rebound. Whole up trend from 0.6935 is expected to resume after consolidation from 0.9304 completes.
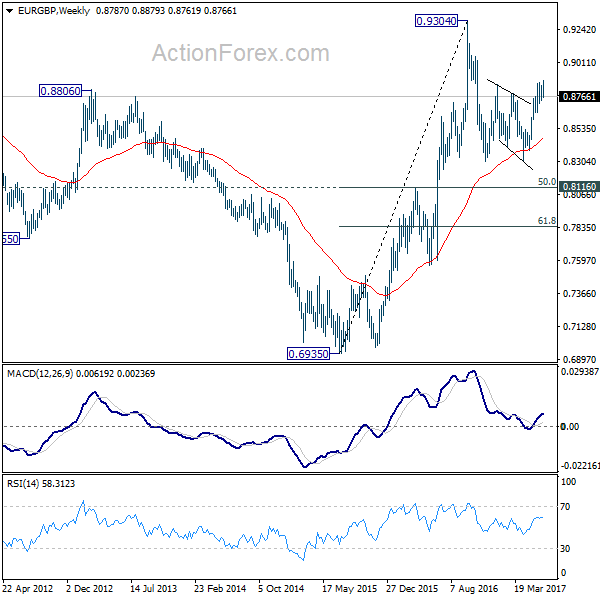
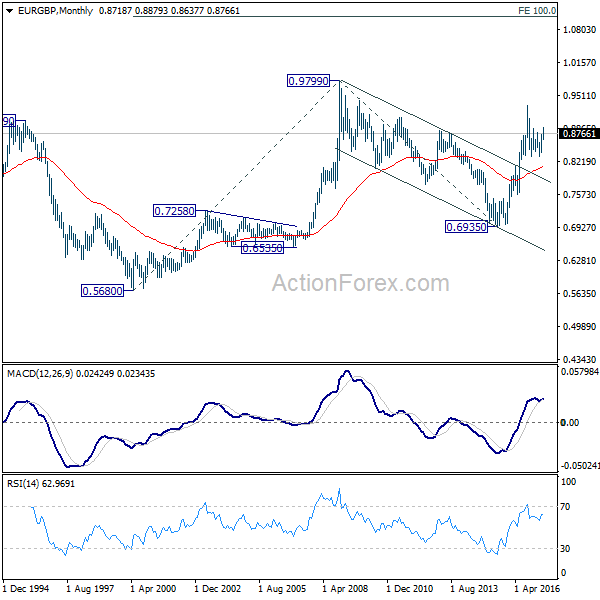
In the long term picture, firstly, price action from 0.9799 (2008 high) is seen as a long term corrective pattern and should have completed at 0.6935 (2015 low). Secondly, rise from 0.6935 is likely resuming up trend from 0.5680 (2000 low). Thirdly, this is supported by the impulsive structure of the rise from 0.6935 to 0.9304. Hence, after the correction from 0.9304 completes, we'd expect another medium term up trend to target 0.9799 high and above.
EUR/AUD Weekly Outlook
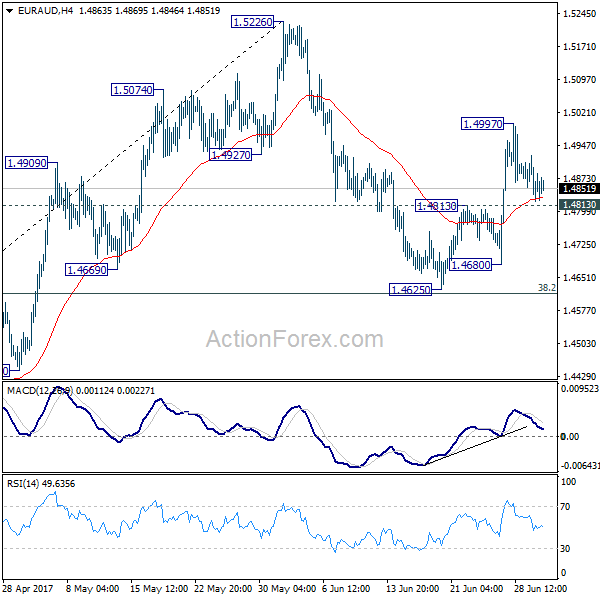
EUR/AUD jumped to as high as 1.4997 last week but lost momentum there and retreated. Initial bias remains neutral this week. As long as 1.4813 minor support holds, we're favoring the bullish case that pull back from 1.5226 has completed at 1.4625, ahead of 38.2% retracement of 1.3624 to 1.5226 at 1.4614. Above 1.4997 will turn bias back to the upside for 1.5226 first. However, break of 1.4813 will dampen this view and turn bias back to the downside for 1.4625 support.
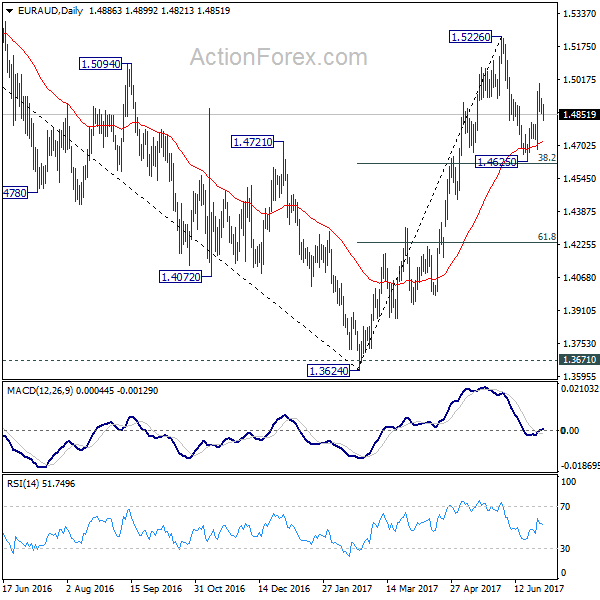
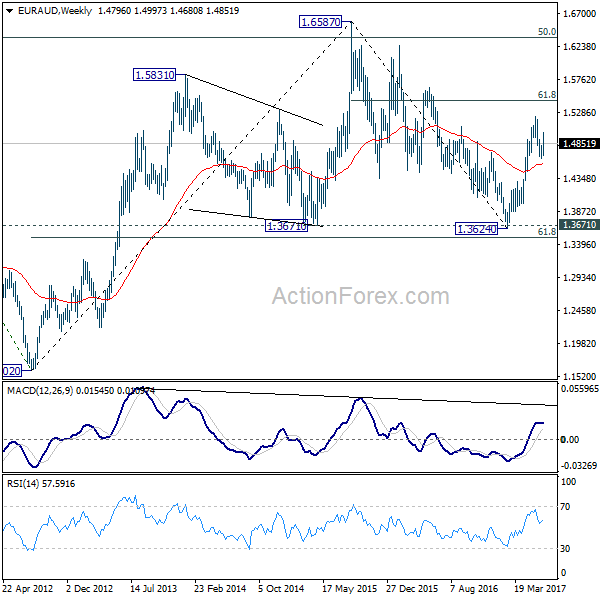
In the bigger picture, price actions from 1.6587 medium term top are viewed as a corrective pattern. Such correction should be completed at 1.3624 after defending 1.3671 key support. Rise from 1.3642 would extend to 61.8% retracement of 1.6587 to 1.3624 at 1.5455. Sustained break there will pave the way to retest 1.6587. However, sustained break of 1.4669 support will dampen this bullish view. We'll assess the outlook later after looking at the structure and depth of the pull back.
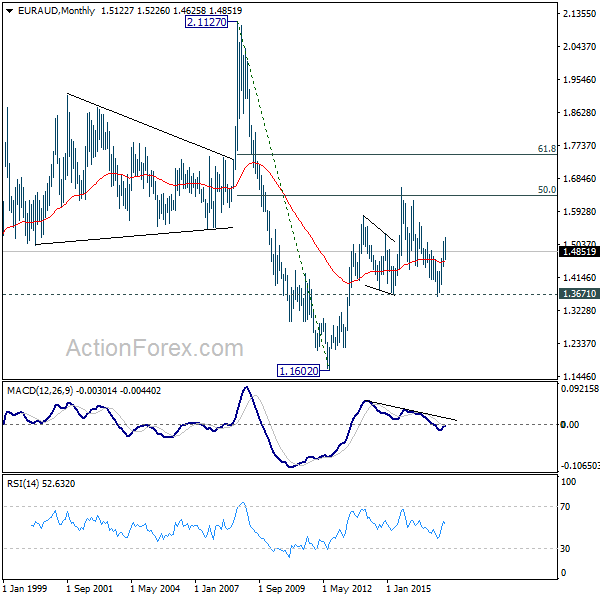
In the longer term picture, the rise from 1.1602 long term bottom isn't over yet. We'll keep monitoring the development but there is prospect of extending the rise to 61.8% retracement of 2.1127 to 1.1602 at 1.7488 and above. However, sustained trading below 1.3671 should confirm trend reversal and target 1.1602 long term bottom again.
EUR/CHF Weekly Outlook
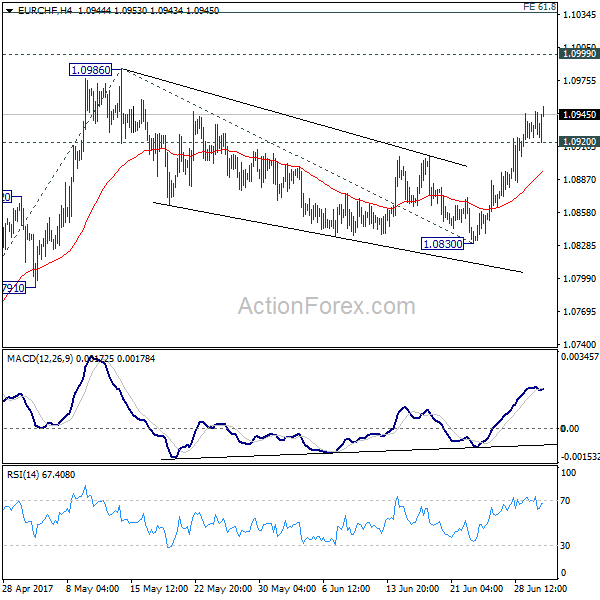
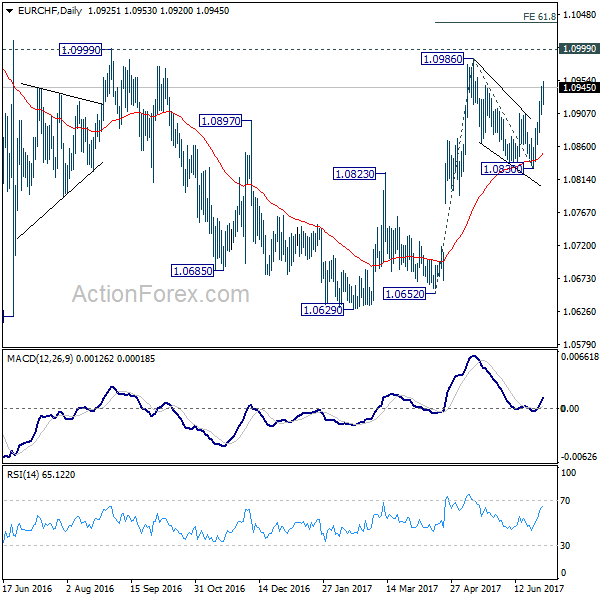
EUR/CHF's strong rebound last week indicates that corrective pull back from 1.0986 has completed at 1.0830, after drawing support from 55 day EMA. Initial bias remains on the upside this week for 1.0986/99 resistance zone. Break there will resume whole rise from 1.0629 and target 61.8% projection of 1.0652 to 1.0986 from 1.0830 at 1.1036. On the downside, below 1.0920 minor support will turn bias neutral and bring retreat before staging another rally.
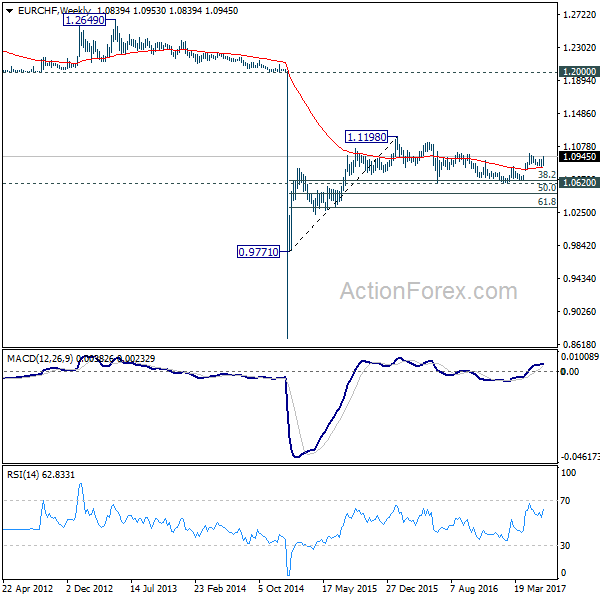
In the bigger picture, the price actions from 1.1198 are seen as a corrective move. Such correction could have completed after defending 38.2% retracement of 0.9771 to 1.1198 at 1.0653. Decisive break of 1.0999 resistance will target a test on 1.1198 high. For now, this will be the preferred case as long as 1.0830 support holds.