Sample Category Title
GBP/JPY Weekly Outlook
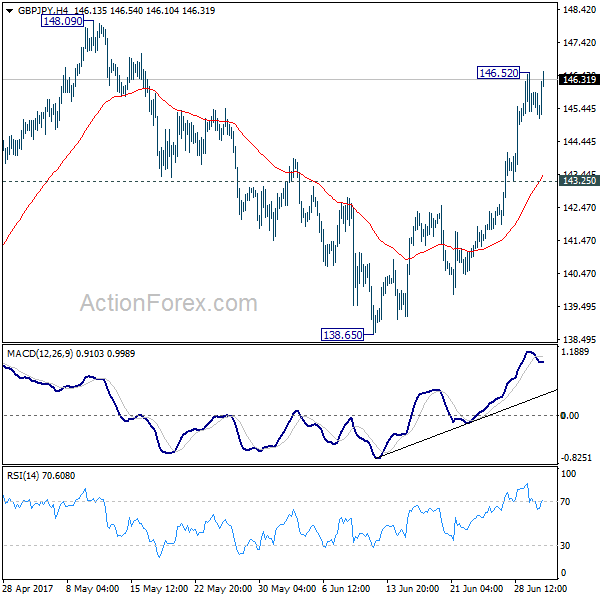
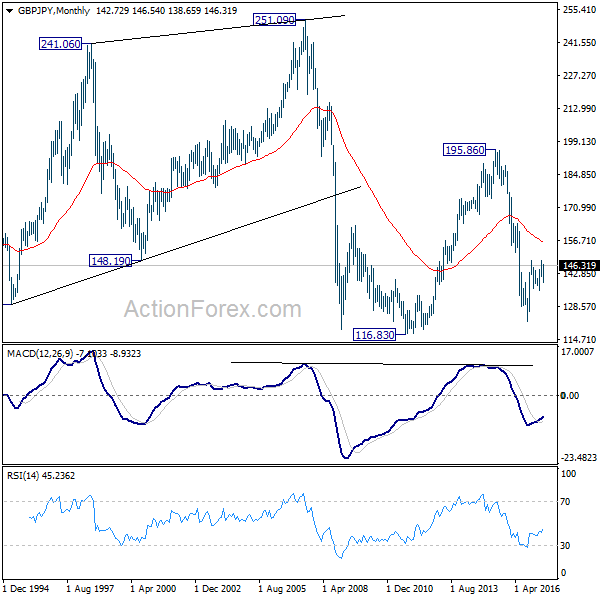
GBP/JPY's sharp rise last week confirmed that pull back from 148.09 has completed at 138.65 already. With a temporary top in place at 146.52, intraday bias is neutral this week first for consolidation. But downside of retreat should be contained by 143.25 minor support and bring rally resumption. Above 146.52 will turn bias to the upside to retest 148.09/42 resistance zone. Decisive break there will extend whole rally from 122.36 to long term fibonacci level at 150.43 next.
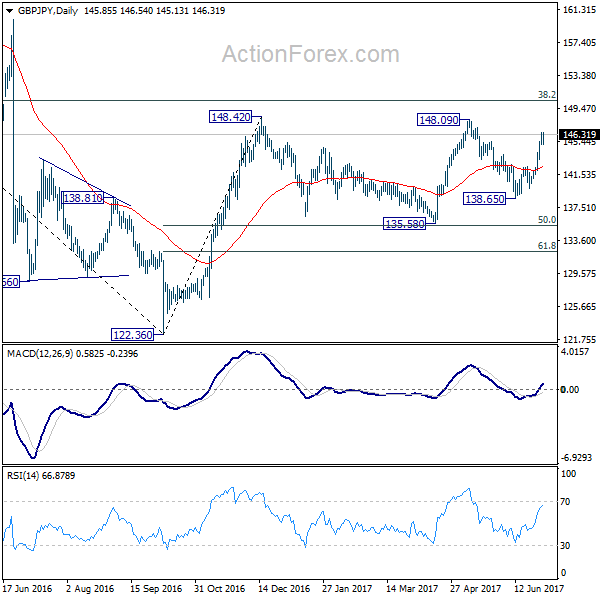
In the bigger picture, rise from medium term bottom at 122.36 is expected to continue to 38.2% retracement of 196.85 to 122.36 at 150.43. Decisive break there will carry long term bullish implications and pave the way to 61.8% retracement at 167.78. In case the sideway pattern from 148.42 extends, we'd be looking for strong support from 135.58 and 50% retracement of 122.36 to 148.42 at 135.39 to contain downside.
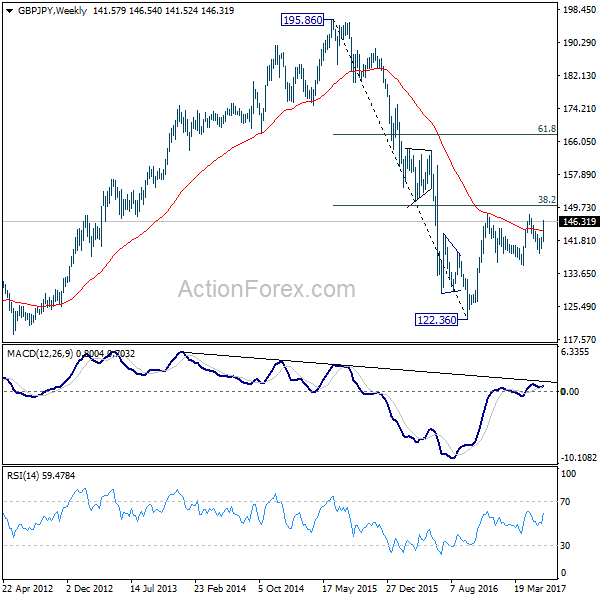
In the longer term picture, it remains to be confirmed is whole down trend from 195.86 has completed at 122.36 already and there is no confirmation yet. But in any case, firm break of 38.2% retracement of 196.85 to 122.36 at 150.43 would pave the way to 61.8% retracement at 167.78. And with that, the 55 month EMA will be firmly taken out which suggests that price actions from 116.83 is indeed a sideway pattern that could last more than a decade.
Global Central Banks Turned Hawkish, Yen Carry Trades to Come Back
Sterling, Canadian Dollar and Euro surged broadly last week on hawkish comments from central bankers. The turn in BoE Governor Mark Carney was the most drastic as just a week a go, he said it's not the time of rate hike yet. But then, he indciated the BoE MPC will start debating raising interest rate in the coming months. BoC Governor Stephen Poloz repeated his comments that prior rate cuts in 2015 have already done their job. But this time, Poloz hinted that BoC is approaching a new interest rate decision. That tremendously raised the odds of a July hike by BoC. There were some jitters on Euro on report that markets misinterpreted ECB President Mario Draghi's comments. But after all, it's generally convinced that, with improvements in Eurozone inflation and growth, ECB is transiting into a phase of stimulus withdrawal. And there would likely be tapering announcement in September or by latest October.
On the other hand, Yen ended the week as the weakest one as BoJ is generally expected to maintain its stimulus as inflation at 0.4% yoy is still far off it's 2% target. Also, global bond yields jumped sharply, giving additional pressure to the Yen. Dollar followed as the second weakest one as markets continued to doubt if Fed, or the US economy, is ready for another rate hike in September. In particular, investors are very dissatisifed with the pace of US President Donald Trump's work on pushing through his economic policies. Trump's administration is still stuck with healthcare reform for the moment. And the US President himeself is continuously engaging in things that distract him from working on the economy. IMF's downgrade of US economic forecast, citing the removal of assumed fiscal stimulus, is a clear sign that economists are giving up.
Yen decoupling from risk aversion
One of the developments in the financial markets caught most of our attention. That is the decoupling of Yen and stocks. Global equities tumbled sharply on expectation of monetary policy tightening ahead. But this time, there was no risk aversion boost to the Yen seen, nor on Swiss Franc. This could be a sign that widening yield spread and their attraction on carry trades is finally back after the years. And yield spread could be starting to have a much stronger impact on the Yen than risk sentiments.
For example, the near term outlook in DAX is certainly quite bad. The sharp fall in DAX last week dragged weekly MACD further below signal line and suggests medium term top was already formed at 12951.54. While some recovery might be seen, the index could now be heading back to key near term fiboaccci level at 38.2% retracement of 10174.92 to 12951.54 at 11890.87, which is close to medium term channel support. Reactions from there will be crucial to whether the medium term up trend is still intact. For the moment, we're not medium term bearish in DAX yet. But bearish divergence in weekly MACD does give us something to worry about.
We've pointed out the risk of trend reversal in FTSE too and it did tumbled sharply. Nonetheless, it was driven by the surge in Sterling and policy tightening, which was out of our expectations. Overall, we maintain the view that 7598.99 could be the medium term top already, after completing a rising wedge structure, on bearish divergence condition in daily MACD. Looking at the bigger picture, bearish divergence condition is also see in weekly MACD. And more improtantly, the index had jsut failed to break through long term channel resistance firmly. It would now gyrate back to 7093.56 important level where some strong support could be seen. While it's still early to judge, firm break of 7093.56 and 55 week EMA (now at 7079.42) could indciate that start of a medium term down trend back to lower channel support below 6000 handle.
For the US markets, we've talked about the bearish development in NASDAQ during the week. Let's take a look at S&P 500. Last week's fall in S&P 500 wasn't too bad as it drew support from 55 day EMA. But the larger picture argues that the up trend in S&P 500 is losing much steam. Mild bearish divergenc condition is seen in weekly MACD. And more importantly, it's now quite close to long term projection of 61.8% projection of 1074.77 to 2134.71 from 1810.10 at 2465.14. It's still early to tell but risk of reversal is increaseing. A break of 55 day EMA (now at 2406.92) will put key medium term support at 2322.25. In case of another rise, S&P 500 might start to feel heavy as it approaches 2465.14.
TNX rebounded following global yield surge
Staying in the US, 10 year yield's strong rebound last week suggests that medium term correction from 2.621 has completed at 2.103. That was after drawing support from 38.2% retracemnent of 1.336 to 2.621 at 2.130 and 55 week EMA. Near term focus is now back on 2.423 resitsance. Break there will bring retest of 2.621 high. However, we'd like to point out that rebound in TNX was mainly driven by surging global yields, not by Fed rate expectations. This is reflected in the lack of strength in Dollar last week. So, not until Fed is more certain on its rate path, 2.621 will likely cap upside in TNX. And that would be accompanied by the lack of persistent strength in Dollar's rebound.
Dollar index in medium term move to 91.91/93
Talking about Dollar, the dollar index extended the medium term decline from 103.82 and reached as low as 95.47 last week. EUR/USD's strong break of 1.13 resistance last week is in line with the case that dollar index is in a long term correction. That is, fall from 103.82 is correcting whole up trend from 2011 low at 72.69 to 2017 high at 103.82. Outlook will stay bearish as long as 97.87 resitsance holds. Dollar index would target key cluster support level at 91.91, (38.2% retracement of 72.69 to 103.82 at 91.93), before getting enough support for sustainable rebound.
Strategy: Stay USD/CAD short with tight stop, close EUR/GBP long, Buy GBP/JPY on dip
Regarding trading strategy, we are short in USD/CAD (sold at 1.3510). Target of 1.2968 key cluster support was already met. A rebound could be due on deep oversold condition in daily RSI. Nonetheless, the Canadian Dollar seems to be getting extra support from the rebound in oil price. WTI crude oil closed at 46.04, comparing to prior week's low at 42.05. In the very near term, it looks like there is more upside potential in oil which might squeeze a bit more from USD/CAD. Hence, we'll stay short in USD/CAD but lower the stop to very tight level at 1.3010 and see if we can get an extra 100 or 200 pips out of it. But still, we maintain that fall from 1.3793 is resuming the whole decline from 1.4689 and should take out 1.2460 low eventually. Hence, even if the position is stopped, we'll look for sellling opportunity again, but at a later stage.
We're also long in EUR/GBP (bought at 0.8740, stop at 0.8640). It looked like EUR/GBP was finally taking out 0.8851 resitasnce to 0.9304 high following ECB Draghi inpsired up move. But then , thanks to BoE Carney, EUR/GBP settled back into establised range. The bullish case for EUR/GBP, ECB and BoE divergence, no longer exists and the risk of reversal after failing 0.8851 is increasing. We'll close the position at market this week.
Meanwhile, we'll look at Yen short oppuntinies this week as we believe the theme of widening yield spread on monetary stimulus exit and return of carry trade will continue. In addition, there could be additional boost to the Yen if global stocks are not as beraish as we thought. Looking at what to buy against Yen, we'll firstly avoid Dollar. At this point, we're staying bullish in EUR/AUD and expecting the rise from 1.4625 to extend to 1.5226. AUD/CAD also breached 0.9923 support last week and looks set to head lower. Hence, we'll avoid Aussie. CAD/JPY looks like a good candidiate with EUR/CAD also displaying a tendence to extend the fall from 1.5257. But since we already have a CAD position, we'd prefer not to add more bet on it.
Comparing EUR/JPY and GBP/JPY, the former is clearly the more bullish one as 124.08 resistance was taken out early this year. GBP/JPY struggled below equivalent resistance at 148.42. In most circumstances, EUR/JPY is preferred to GBP/JPY. However, firstly, Sterling was lifted by quite a drasitic turn in BoE Carney's stance which changed the fundamental outlook. Secondly, as mentioned above, there is chance of a near term reversal in EUR/GBP after being rejected from 0.8851. Hence, we'd choose to buy GBP/JPY this week for a catch up. We'll buy GBP/JPY on dip to 144.00 with stop at 142.50. We're expectin the whole rise from 2016 low at 122.36 to resume as a medium term move after taking out 148.42 resistance later.
GBP/JPY Weekly Outlook
GBP/JPY's sharp rise last week confirmed that pull back from 148.09 has completed at 138.65 already. With a temporary top in place at 146.52, intraday bias is neutral this week first for consolidation. But downside of retreat should be contained by 143.25 minor support and bring rally resumption. Above 146.52 will turn bias to the upside to retest 148.09/42 resistance zone. Decisive break there will extend whole rally from 122.36 to long term fibonacci level at 150.43 next.
In the bigger picture, rise from medium term bottom at 122.36 is expected to continue to 38.2% retracement of 196.85 to 122.36 at 150.43. Decisive break there will carry long term bullish implications and pave the way to 61.8% retracement at 167.78. In case the sideway pattern from 148.42 extends, we'd be looking for strong support from 135.58 and 50% retracement of 122.36 to 148.42 at 135.39 to contain downside.
In the longer term picture, it remains to be confirmed is whole down trend from 195.86 has completed at 122.36 already and there is no confirmation yet. But in any case, firm break of 38.2% retracement of 196.85 to 122.36 at 150.43 would pave the way to 61.8% retracement at 167.78. And with that, the 55 month EMA will be firmly taken out which suggests that price actions from 116.83 is indeed a sideway pattern that could last more than a decade.
Eco Data 7/7/17
[php_everywhere] [/php_everywhere]
Eco Data 7/6/17 (4)
[php_everywhere] [/php_everywhere]
Eco Data 7/5/17
[php_everywhere] [/php_everywhere]
Eco Data 7/4/17
[php_everywhere] [/php_everywhere]
Eco Data 7/3/17
[php_everywhere] [/php_everywhere]
Summary 7/3 – 7/7
Monday, Jul 3, 2017
[php_everywhere] [/php_everywhere]
Tuesday, Jul 4, 2017
[php_everywhere] [/php_everywhere]
Wednesday, Jul 5, 2017
[php_everywhere] [/php_everywhere]
Thursday, Jul 6, 2017
[php_everywhere] [/php_everywhere]
Friday, Jul 7, 2017
[php_everywhere] [/php_everywhere].
Weekly Economic and Financial Commentary
U.S. Review
Consumer Remains on Solid Footing
- There were two key takeaways from economic data released this week. First, current economic conditions are positive for the U.S. consumer, who remain confident about the labor market providing opportunity for continued income growth, and are comfortable making economic decisions accordingly.
- Second, disappointment may be setting in for those expecting a strong rebound in the factory sector. Tax cuts and other public policy expectations have not come to fruition as soon as some had hoped following the election. Data show a recovery, but it is slow and gradual. Orders and shipments data have yet to signal a major pickup for the factory sector is imminent.
Reality Sets In
The U.S. economy expanded 1.4 percent in the first quarter of the year, which was a larger-than-expected upgrade in the final look at GDP this week. The improvement was largely on the personal consumption line, which actually rose 1.1 percent in Q1, much stronger than the 0.3 percent first estimated. Still somewhat soft relative to recent performance, the consumption portion of the U.S. economy had a decent start to the year, which adds to our confidence that Q2 GDP will get a solid boost from consumption.
Surveys of consumers continue to support expectations of a solid Q2 performance for consumption. The Conference Board's Survey of Consumer Confidence in June confirmed an upbeat assessment of the present economic situation. The measure has surged over the past six months, hitting a cycle high in March. Headline consumer confidence gave back some of that gain in subsequent months on diminishing strength in the expectations component. Consumers' assessment of their current economic situation has continued its steady climb upward. Progress toward the policy objectives that had boosted expectations in the first months of the new administration has likely been slower than some anticipated. Although some disappointment may have set in, the economic reality—the labor market in particular—is getting positive reviews from an increasing share of consumers surveyed.
Consumers' positive assessment of their current situation was reinforced by the continued strength seen in personal income growth. Personal income rose another 0.4 percent in May, besting expectations of 0.3 percent. Disposable income was up a strong 0.5 percent, and was even stronger in real terms as the lack of price pressures, particularly at the gas pump, left more money in consumers' pocket in May. The PCE deflator declined 0.1 percent on the month, continuing a string of soft inflation prints. The PCE deflator is followed closely by the Fed, and the year-over-year increase of 1.4 percent in both headline and core PCE is quite far from the FOMC target of 2 percent.
Manufacturing activity has yet to ramp up significantly, as had been suggested by sentiment measures from the sector early in the year. To be sure, factories are faring far better than this time last year and continue to pull themselves out of the rout that had plagued the sector for nearly two years. Continued uncertainty surrounding trade, health care and tax reform appears to have diminished expectations in the business sector, which appear to be holding off investment spending, which weighs on demand from U.S. factories. The second quarter started off slow, with new orders down 1.1 percent in May, declining for the second month. Core capital goods, which exclude defense and aircraft and provide a useful proxy for business investment in GDP, have softened. Shipments of core goods declined 0.2 percent in May, and orders also declined, suggesting a significant bounce by the end of Q2 is unlikely. Both orders and shipments of core goods are running at the softest three month annualized rate of 2017. The convergence of soft and hard data at a lower level of activity enforces our call that the factory sector is in for a slow and steady improvement, at least until some clarity emerges on fiscal policy.
U.S. Outlook
ISM Manufacturing • Monday
The ISM manufacturing index has hovered just shy of 55 over the past two months, a modest pullback from levels seen in Q1. The new orders and production components were a solid 59.5 and 57.1, respectively, in May, but both of these readings were below their six-month averages. This softening in new orders and production has corresponded with a deceleration in the hard data for capital goods orders. Encouragingly, after seven straight months of sub-50 readings for the backlog of orders component, this measure of activity in the pipeline snapped the streak in February and has held steady in the mid-50s since.
We expect the ISM index to remain near the 55 mark in June. While this is lower than the robust readings registered to start the year, it is still consistent with incremental improvement in the manufacturing sector relative to the past couple years; the ISM index remained below the 55 mark for all of 2015 and 2016.
Previous: 54.9 Wells Fargo: 55.0 Consensus: 55.0
Trade Balance • Thursday
The trade deficit widened to start Q2, as imports rose strongly while exports edged down. A decline in automobiles and parts and consumer goods exports weighed, leading to the second consecutive month the value of exports declined. Imports were boosted by a surge in consumer goods and cell phones in particular.
Unless exports bounce back strongly in May and June, sequential growth in real exports of goods and services likely will be weak in Q2. On the other hand, sequential growth in real imports likely will be fairly solid in the second quarter. In other words, real net exports likely will exert a modest drag on overall real GDP growth in the current quarter. We expect that export growth generally will remain positive going forward, although it likely will fall short of import growth. As illustrated in the middle chart, trade in real goods has accelerated as economic growth has firmed both domestically and abroad.
Previous: -$47.6B Wells Fargo: -$46.1B Consensus: -$46.2B
Employment • Friday
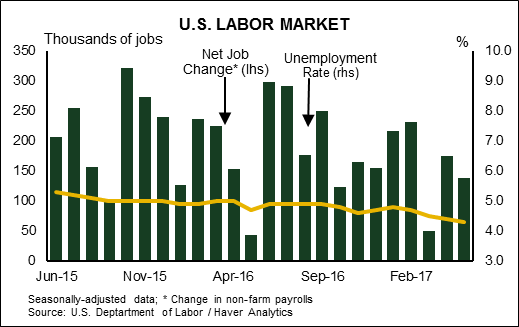
On trend, nonfarm employment growth has gradually been slowing since early 2015, as slack in the labor market continues to diminish and secular demographic headwinds limit growth in the labor force. Of late, the retail sector has been a major drag on employment growth, shedding 52,000 jobs over just the past three months. Education & health, leisure & hospitality and professional & business services have led job growth.
With the unemployment rate at a cycle-low of 4.3 percent and employment gradually decelerating, the attention on wage growth (or lack thereof) continues to grow. Average hourly wage growth remains well below the peak of previous cycles amid relatively benign inflation and sluggish labor productivity growth. With job openings at a record high and survey data suggesting positions are increasingly hard to fill, the stage is set for somewhat faster wage growth later this year.
Previous: 138,000 Wells Fargo: 170,000 Consensus: 177,000
Global Review
Confidence Abounds in the Eurozone
- Confidence indicators are surging across the Eurozone. Although indices of business and consumer confidence appear to be overstating the underlying pace of growth at present, the economic expansion that is underway in the euro area appears to be increasingly self-sustaining.
Japanese Economy Continues to Grind Along
- The modest pace of expansion that has been underway in Japan appears to have continued in Q2. Until inflation moves higher, however, the Bank of Japan (BOJ) likely will keep its foot firmly on the accelerator of monetary accommodation.
Confidence Abounds in the Eurozone
If confidence indicators are to be believed, the Eurozone economy is booming at present. As shown in the bottom chart on page 1, the Ifo index of German business sentiment rose to 115.1 in June, the highest reading in at least 26 years, and consumer confidence in Germany reached a 16-year high. Consumer confidence in France shot up to a 10-year high in June, no doubt spurred higher by the election of President Macron in May and his impressive legislative win earlier this month. The Italian index of consumer confidence also moved higher during the month.
That said, confidence indicators have consistently overstated the underlying strength of the Eurozone economy in recent years. Industrial production (IP) in Germany was up 2.3 percent in the February-April period relative to the same three-month period last year (see graph on page 1). This growth rate in German IP is solid, but it is hardly reflective of "boom." Strength in French consumer confidence has yet to translate into robust growth in French consumer spending on a sustained basis (top chart).
The Eurozone economy may not be exactly "booming," but it does seem that the current economic expansion, which has been underway now for four years, is becoming increasingly selfsustaining. Indeed, ECB President Draghi gave a speech this week in which he talked about the broadening and the strengthening in the Eurozone economic recovery. But he also noted that inflation in the overall euro area remains well below the ECB's target of "below, but close to, 2 percent over the medium term." Although the ECB may further "taper" its quantitative easing program later this year, we continue to believe that the Governing Council will refrain from raising interest rates until well into 2018.
Japanese Economy Continues to Grind Along
Data released this week indicate that the Japanese economy, where real GDP was up 1.3 percent on a year-over-year basis in Q1 2017, continues to grow at a modest pace. Japanese IP dropped 3.3 percent in May relative to the previous month, which, on the surface, looks awful. However, the plunge in IP in May was not sharp enough to reverse the 4.0 percent jump that was registered in April. Moreover, the year-over-year growth rate, which is shown in the middle chart, is more reflective of the underlying trend in Japanese IP at present. A similar monthly pattern (i.e., strength in April followed by relative weakness in May) was also observed in Japanese retail spending. On a yearago basis, retail sales in Japan were up 2.0 percent in May.
The pace of economic growth in Japan at present is not strong enough to lift inflation, however. The overall rate of CPI inflation was just 0.4 percent in May, well short of the BoJ's 2 percent target (bottom chart). Although some foreign central banks are starting to indicate that it may soon be appropriate to remove some monetary accommodation (see "Interest Rate Watch" on page 6), the BoJ seems content to keep its quantitative easing program firmly in place for the foreseeable future. Consequently, we believe that the Japanese yen will remain on the defensive versus most major currencies.
Global Outlook
China Caixin PMIs • Tuesday
The Caixin manufacturing and service PMIs for China will be released early next week. The manufacturing index is expected to remain in contractionary territory, at 49.8, following a May reading of 49.6. The recent pullback in manufacturing activity suggests that the secondary sector, which includes manufacturing, construction and utilities production, softened in Q2, following a strong 6.4 percent growth rate in Q1. The secondary sector accounts for roughly 40 percent of the value added in the Chinese economy, thus markets will be watching this release closely.
The service PMI is also on the docket for next week for the secondlargest economy in the world. China's service sector expanded at a faster pace in May, indicating renewed momentum in the sector after deceleration in the previous four months. The divergent trends in the PMI indices will be closely monitored if they widen further.
Previous: Manufacturing (49.6); Services (52.8) Consensus: Manufacturing (49.8)
Eurozone Retail Sales • Wednesday
Next Wednesday, retail sales for May are set to be released for the euro area. Economic activity has been gaining momentum in the Eurozone, indicating that economic growth in the area is becoming self-sustaining. Eurozone GDP expanded 1.9 percent in Q1 (year over year) and is expected to increase 1.8 percent in Q2. Retail sales in Germany, the largest economy in the euro area, grew 4.8 percent year-over-year in May, according to data released this morning. In Spain, retail sales grew 3.8 percent in May on a year-over-year basis, its quickest pace since November 2016.
Sentiment indicators in the Eurozone are quite strong at present and the hard data seem to be catching up with the feelings of economic optimism. In fact, this past week, Mario Draghi noted the strengthening character of the Eurozone recovery and recognized that the factors restraining inflation are temporary, and suggested that continued monetary policy would become less accommodative.
Previous: 0.1% (Month-over-Month) Consensus: 0.4% (Month-over-Month)
U.K. Industrial Production • Friday
U.K. industrial production (IP) data for May is slated to be released next Friday. IP increased 0.2 percent in April and is expected to increase 0.4 percent in May, on a month-over-month basis. The 0.2 percent gain in April fell well short of the 0.7 percent consensus forecast. Factory output rose 0.2 percent, missing the 0.8 percent expected gain. The weaker-than-expected figures cause a bit of concern, especially in the wake of the general election results in which the governing Conservative Party lost seats in parliament—a result which likely weakened its position in the Brexit negotiations.
Also scheduled for a Friday release are manufacturing production and construction output. All three indicators, taken together, will present a more complete picture of production in the U.K. GDP is expected to increase 1.7 percent in Q2, year over year, a slowdown from the 2.0 percent growth in Q1.
Previous: 0.2% Consensus: Consensus: 0.4% (Month-over-Month)
Point of View
Interest Rate Watch
Sovereign Bonds Reverse Course
Yields on longer-dated Treasury securities jumped this week, with the 10-year up 13 bps from last Friday and the 10yr/2yr spread steepening (top chart).
The decline in Treasuries largely began after European Central Bank President Mario Draghi delivered some hawkish language this week that hinted at a reversal of ECB stimulus amid a broadening recovery and budding reflation in the euro area. European sovereign debt sold off in reaction, with the yield on the 10-year German Bund rising 20 bps this week (middle chart). ECB officials attempted to tamp down the rhetoric in subsequent statements, but the damage had already been done. As we have noted in previous reports, the expansion in Europe is increasingly self-sustaining, and our forecast looks for real GDP in the Eurozone to accelerate modestly in coming quarters.
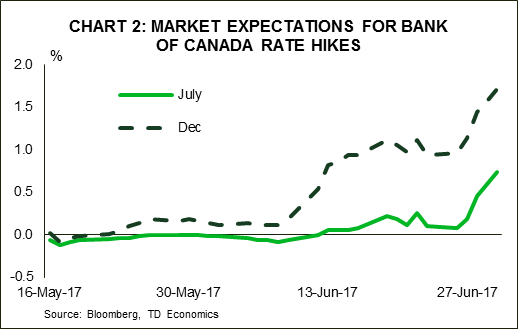
The case for a more hawkish stance from the world's central banks was not limited to just Europe. After a run of better-thanexpected economic indicators and a solid print for GDP growth in Q1, Canada's first step toward monetary policy normalization could come as soon as July. The last time the BoC adjusted its benchmark overnight rate was in July 2015 when it cut the overnight rate to 0.50 percent, where it has remained subsequently. Until recently, we expected the Bank of Canada to remain on hold, but we think a quarter point rate hike at the July 12 meeting is now the more likely course of action.
Economic data in the U.S. this week were also generally supportive of higher rates. Despite a miss in durables goods orders, consumer confidence surprised to the upside. The present situation component surged to 146.3; this reading marked the most upbeat assessment by consumers of their current situation since 2001 (bottom chart). Real GDP growth in the United States was also revised higher yesterday, buoyed by another upward revision to personal consumption growth. We look for generally solid U.S. economic data next week as well, including another cycle-low for the unemployment rate, to signal stronger growth ahead for bondholders.
Credit Market Insights
Cloud Looms Over Consumers' Expectations and Confidence
The Federal Reserve Bank of New York published the results from its May 2017 Survey of Consumer Expectations (SCE), which offers data on consumers' experiences and expectations related to credit demand and credit access. The monthly results showed that households' expectation of inflation declined on a oneyear and three-year ahead horizon. Inflation uncertainty one- and three-year ahead remains at a series low.
Consumers' expectations of their future financial situation and spending growth, however, worsened compared to the previous month. In addition, consumers are expecting home prices to rise 3.5 percent higher. The lack of inventory continues to apply upward pressure on home prices and is starting to weigh on sales. However, with low mortgage rates and strong buyer traffic we expect demand to remain elevated as more homes are put up on the market.
Despite fewer signs of future-optimism, consumer confidence remains elevated as consumers feel positive about the economy today and upbeat about the labor market. The downward trend of future expectations appears, in our opinion, to be from the uncertainty surrounding public policy. That said, the Fed pays attention more to the direction of inflation expectations. With weakening inflation expectations, a case could be made against a September rate hike.
Topic of the Week
Developing Country Debt
External debt in the developing economies has risen noticeably over the past few years, growing to more than $6 trillion in 2014 from less than $4 trillion in 2009. Although the outstanding debt stock has subsequently edged lower, most of that decline is attributable to China, where external debt dropped from nearly $1 trillion in 2014 to about $500 billion last year. Excluding China, the amount of external debt in our sample of countries remains near its 2014 peak. The unsustainable buildup in external debt in the 1990s was partially responsible for the series of financial crises that swept through the developing world in 1997-1998— should we be worried?
It is important to note that countries get into financial difficulties not so much because of the outstanding amount of debt per se, but rather because of their inability to service that debt. Debt service is the amount of interest and amortization payments that a country needs to pay every year, and as a country's debt service ratio rises, its ability to adequately service its external debts declines, everything else equal. As shown in the top graph, the ratio of debt service payments to exports for the 21 economics in our sample stood at roughly 26 percent in 1997. The ratio has edged closer to this point over the past few years due to the buildup in external debt and slow growth in exports. Nevertheless, the ratio today for the non-Chinese developing economies remains below its 1997 level. In other words, the ability of developing economies to service their external debt is better today than it was 20 years ago.
Furthermore, developing economies have deeper pockets today than they did in 1997. External debt is a liability for developing economies. But they also have assets, namely foreign exchange (FX) reserves, which can be used to service the debt. In that regard, the FX reserves of the 21 economies in our sample mushroomed to roughly $5.8 trillion at the end of 2016 from $500 billion in 1997. In short, the ability of the developing world to service its external debt is generally stronger today than it was at the onset of the so-called Asian financial crisis. A reoccurrence of the financial crises in 1997-98 does not appear to be imminent.
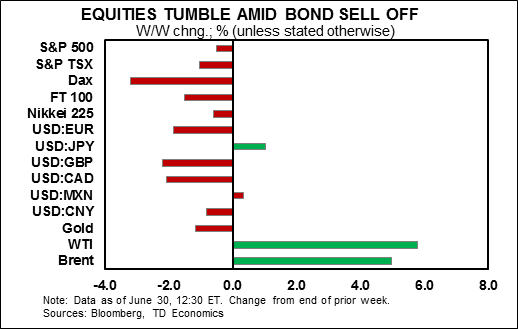
Hawkish Central Bank Rhetoric Rattles Markets
Highlights
- Bond markets sold off sharply this week on remarks from monetary policymakers. Bond yields rose by 20 to 25 basis points in Germany and the UK, respectively. Yields on Treasuries also rose, but markedly less as U.S. data has underwhelmed.
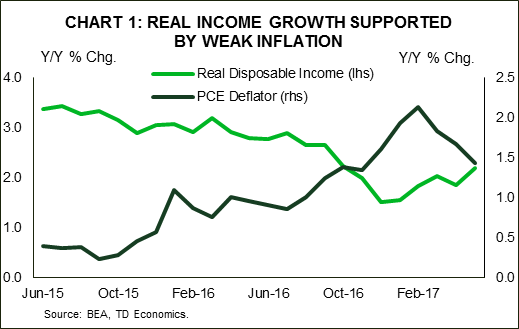
- Momentum in personal spending dissipated slightly from the strong performance in the previous two months. Gains in real income surprised to the upside, and should underpin spending going forward.
- We look forward to next week's employment report as a potential market mover. We expect a relatively robust print of 170 thousand jobs and unemployment to hold steady at 4.3%.
U.S. - Hawkish Central Bank Rhetoric Rattles Markets
Global markets were volatile in recent days. Bond markets sold off sharply since mid-week on remarks from monetary policymakers. Central bankers in the Eurozone and the UK have indicated that meaningful economic improvements should begin to warrant the removal of accommodative monetary policy measures. This hawkish sentiment saw bond yields rise by 20 to 25 basis points in Germany and the UK, respectively. Yields on Treasuries also rose, but markedly less as U.S. data has underwhelmed. The relatively softer U.S. data also led the dollar lower vis-à-vis the euro and the pound.
The lower U.S. dollar also helped to shore up oil prices that have been led higher recently by curtailed production related to maintenance of Alaskan sites and a storm in the Gulf of Mexico. Still, US stockpiles have remained high this summer, with oil prices likely to remain relatively anchored during the rest of the year.
Expectations of less-stimulative policy going forward have also led stock markets to retrench as investors across the Atlantic readied themselves for what may be end an era of cheap money. At the same time, comments by Fed Chair Janet Yellen on Tuesday indicated that the Fed is keeping a close eye on stock markets valuations, injecting further caution into U.S. equity markets.
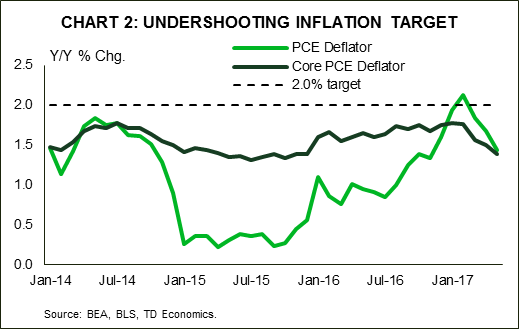
Still, the U.S. data came in relatively weak this week. While still supportive of growth in the second quarter, momentum in personal spending dissipated slightly from the strong performance in the previous two months. Gains in real income surprised to the upside, and should underpin spending going forward (Chart 1). But, this was partly related to the weakness in prices, which underperformed in May, corroborating anemic CPI growth on the month (Chart 2). There was also weakness in durable goods orders, which fell in May according to the advance estimate, suggesting weaker capital investment in the second quarter.
But, not all data were soft. Consumer confidence metrics rose according to both the Conference Board and University of Michigan surveys. Moreover, the goods trade balance narrowed slightly in May as automotive exports rebounded following two consecutive months of underperformance. With domestic US auto sales peaking last year, global demand will play an increasingly important role for growth in the sector. Exports should also get some support from a weaker greenback. We look forward to next week's ISM manufacturing survey results to echo these positive developments, with readings poised to expand, mirroring upbeat regional surveys for June.
The string of data that has missed expectations recently has been leading markets to push out the timeline for further rate hikes, with another hike this year now priced in below 50%. This is particularly the case for inflation, which has been stubbornly weak, while wage growth has recently lost some momentum too. We look forward to next week's employment report as a potential market mover. We expect a relatively robust print of 170 thousand jobs and unemployment to hold steady at 4.3%. Moreover, with unemployment near its natural rate, we expect that wage growth should once again accelerate. This should help underpin the inflation outlook and could bolster the case for another rate hike by year end.
Canada - Rate Hikes Coming, Just A Matter Of When
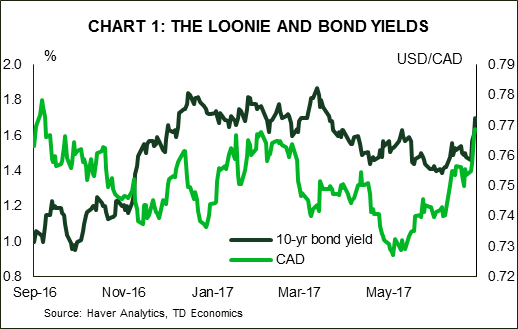
It was a good week for Canada's loonie, as it pushed above 77 US cents to a 9-month high. Oil prices provided some support, moving back above US$45 per barrel.
However, the more important driver of currency strength of late has been the Bank of Canada, where hawkish remarks by senior officials over the past few weeks have prompted markets to bring forward expectations of when the tightening cycle will begin. Comments from Governor Poloz this week – that rate cuts have done their job and excess capacity is being used up – echoed this sentiment, signaling that it is no longer a question of if the Bank of Canada will hike rates, but when. As of this morning, markets had priced in a nearly 80% chance that the Bank will hike the overnight rate at the next meeting in July. As a result, 5- and 10-yr bond yields rose by about 25 basis points on the week to a 3-month high.
The Bank of Canada is clearly responding to the stellar growth that the Canadian economy has recorded in the second half of last year and first quarter of 2017. And, this momentum has carried over into the second quarter. This morning's April GDP report showed that the economy expanded by 0.2% during the month, putting it on track to meet our expectations of 2.9% (annualized) for the quarter as a whole. This should help to close the output gap – or eliminate the excess capacity – in the current quarter.
Moreover, this morning's release of the Business Outlook Survey – which the Bank of Canada tends to put a lot of weight on – showed that business activity is continuing to gain momentum. Firms expect sales growth to improve further and hiring intentions shot up to record levels. Still, inflation expectations edged down, with the bulk of respondents forecasting price growth in the 1-2% range.
Price pressures are perhaps the only thing missing that would solidify a July hike. All of the Bank's core measures of inflation have been flat or trending down this year and remain on the low end of the 1-3% target range. And expectations among businesses suggest that inflationary pressures will be limited. However, monetary policy acts with a lag. And given that the Bank of Canada's research suggests that core inflation should be bottoming, it could very well feel that a July hike is justified.
All told, the heat of the continued rhetoric by Governor Poloz this week, strong growth data and associated market reaction are all working in the direction of a rate hike at the central bank's July 12th fixed announcement date. At the same time, however, inflation is still the Bank of Canada's single mandate and has yet to show any signs of moving toward target. As such, although markets have priced in a hike for July, we believe there is little risk of waiting a bit longer (i.e., October). This will give the Bank a little more time to ensure that inflationary pressures are beginning to materialize as expected, and to obtain more clarity surrounding the impact of recently announced housing measures in some regions, as well as the direction of oil prices. Should the Bank of Canada hike rates in July, markets should be cautious about pricing in too much additional tightening given the soft inflation backdrop.
U.S.: Upcoming Key Releases
U.S. ISM Manufacturing Index - June
Release Date: July 3, 2017
May Result: 54.9
TD Forecast: 55.5
Consensus: 55.0
TD looks for ISM Manufacturing to strengthen to 55.5 in June on a broadening improvement in regional soft data. ISM-adjusted empire manufacturing reached a six-year high in June and while the Philly Fed Index drifted lower on an ISM-adjusted basis, it still remains near cycle-highs and firmly entrenched in expansionary territory. Chicago PMI also surprised to the upside in June, coming in just shy of the previous cycle high set in 2011. This should bode well for market sentiment, though we note that inflation and hard data are far more important for the Fed in the current environment.

U.S. Employment - June
Release Date: July 7, 2017
Previous Result: 138k, unemployment rate 4.3%
TD Forecast: 179k, unemployment rate 4.3%
Consensus: 180k, unemployment rate 4.3%
We expect June nonfarm payroll employment to pick up to a respectable 170k pace in June after registering a disappointing 138k gain in May. At this stage of the cycle we expect gains above 200k to be fewer and far between, though upside surprises cannot be excluded. We do expect, however, job gains to remain above its breakeven pace needed for further declines in slack (estimated at roughly 80-100k). Jobless claims have stabilized near record lows, household sentiment (e.g., Conference Board) has stayed robust and business survey indicators (regional Fed indexes) have also maintained recent strength. On balance, both hard data and surveys point to a June pickup, though we await additional labor market measures (ISM in particular) before finalizing our forecast.
The unemployment rate is expected to be unchanged at 4.3%. The number of unemployed workers fell for four consecutive months through May, which at this stage of the cycle looks unsustainable. With some stabilization in June paired with ongoing employment growth, we see risks as balanced for a stable reading for the unemployment rate. On wages, calendar effects point to a stronger 0.3% m/m increase in average hourly earnings, leaving the year-on-year pace higher at 2.7%. With realized inflation becoming a more deciding factor on the path of future rate hikes, wage growth will be key to watch in the coming months amid heightened concerns over the Phillips curve.
Canada: Upcoming Key Releases
Canadian International Trade - June
Release Date: July 6, 2017
April Result: -$0.37bn
TD Forecast: -$0.80bn
Consensus: N/A
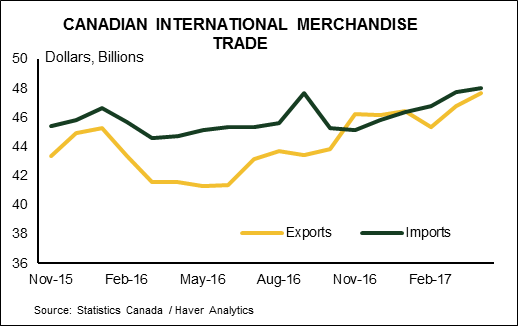
The international trade deficit is forecast to widen to $0.80bn in May on a sizeable pullback in energy exports and an increase in import activity. Non-energy exports should post a moderate decline and add to the drag from energy, where a sharp decline in prices will overshadow a flat or modest increase in volumes. We see downside risks to motor vehicle exports after a sharp decline in manufacturing shipments and a deteriorating outlook for US auto sales new countervailing duties on softwood lumber, announced in late April, should weigh on exports of forestry products. Factory prices will also weigh on nominal exports, having fallen 0.2% on the month. On the other hand, we see import activity edging higher on robust domestic demand.
So the goods-export revival is not quite happening and Canada's competitive positive position remains under challenge, mainly due to high unit labour costs relative to the US and Mexico. In addition to the potential drag we may get from housing activity in May, the second quarter could mark the top to Canada's economic rebound. This is probably as good as it gets and the summer could be bumpier than what we have been accustomed to lately.
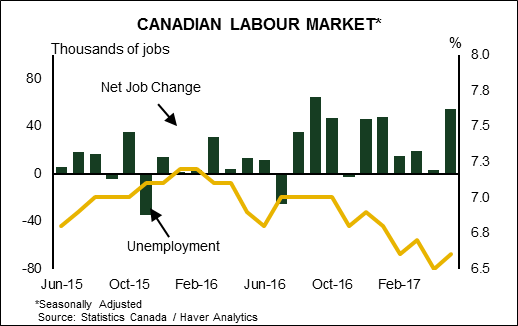
Canadian Employment - June
Release Date: July 7, 2017
May Result: 55k, unemployment rate 6.6%
TD Forecast: 5k, unemployment rate 6.6%
Consensus: N/A
Canadian job growth is forecast to slow to a 5k pace in June after the robust 55k in May. Details should add a downbeat tone to the report, as we expect to see a partial reversal of last month's rotation into full time and private sector hiring. Manufacturing employment should cool after surging 25k jobs in May, its strongest month since 2002. We expect finance, insurance and real estate (FIRE) employment to remain soft amid a slowdown in the Toronto housing market. The unemployment rate should remain stable at 6.6%, but the risks are skewed for it to drift lower to 6.5% on a moderation in labour force growth.
While we look for a number of sharp improvements in April's report to unwind partially, we expect policy makers to look through the weakness in any single month and focus on the encouraging trend that has solidified over the last six months, although the market reaction could be higher than normal, especially if we get a miss, given the current speculations surrounding an upcoming rate hike.