

Sample Category Title
Swiss Franc Trading On A Weaker Footing, Ahead Of Switzerland’s Real Retail Sales And SVME–PMI Data
For the 24 hours to 23:00 GMT, the USD rose 0.35% against the CHF and closed at 0.9588 on Friday.
Macroeconomic data showed that Switzerland's KOF leading indicator climbed more-than-anticipated to a level of 105.5 in June, compared to a revised level of 102.0 in the previous month, while market participants had envisaged for a rise to a level of 102.5.
In the Asian session, at GMT0300, the pair is trading at 0.9594, with the USD trading 0.06% higher against the CHF from Friday's close.
The pair is expected to find support at 0.9568, and a fall through could take it to the next support level of 0.9542. The pair is expected to find its first resistance at 0.9609, and a rise through could take it to the next resistance level of 0.9624.
Ahead in the day, traders would focus on Switzerland's real retail sales data for May and SVME–PMI for June.
The currency pair is trading above its 20 Hr and 50 Hr moving averages.

Canada’s Economy Expanded As Expected In April
For the 24 hours to 23:00 GMT, the USD declined 0.23% against the CAD and closed at 1.2963 on Friday.
The Canadian Dollar gained ground, after Canada's gross domestic product (GDP) rose 0.2% on a monthly basis in April, at par with market expectations, increasing the likelihood of an interest rate hike later this month. In the prior month, the GDP had recorded a rise of 0.5%. Additionally, on an annual basis, the economy expanded 3.3% in April, advancing at its fastest pace in three years. Markets were anticipating the GDP to climb 3.4%, compared to an advance of 3.2% in the prior month.
In the Asian session, at GMT0300, the pair is trading at 1.2984, with the USD trading 0.16% higher against the CAD from Friday's close.
The pair is expected to find support at 1.2954, and a fall through could take it to the next support level of 1.2924. The pair is expected to find its first resistance at 1.3007, and a rise through could take it to the next resistance level of 1.3030.
The currency pair is showing convergence with its 20 Hr moving average and trading below its 50 Hr moving average.

Will PMIs Aid EUR And GBP Rallies?
European equity markets are expected to open a little higher on Monday as traders await a selection of manufacturing PMI reports from across Europe as well as some unemployment data.
Trading volumes are likely to be relatively subdued at the start of the week, as we've already seen evidence of in the Asian session overnight, due to Tuesday's bank holiday in the US and the half day today that precedes it. Of course, this doesn't mean markets will necessarily be flat and the constant stream of data throughout the day could aid this.
We've already had some decent manufacturing numbers out of China and Japan overnight, with the PMIs both beating expectations and the Tankan index rising to 17 – its joint highest reading in almost a decade. The yen hasn't been overly responsive to the data though, with the Bank of Japan remaining among the increasingly few central banks that is unlikely to tighten monetary policy any time soon, although more numbers like this may change that.
Sterling and the euro were two of last week's standout performers as the heads of both central banks delivered quite hawkish speeches – intentional or not – that went against their previously dovish stance. While we've known for some weeks now that policy makers at both the Bank of England and the ECB have become increasingly open to tighter monetary policy, this shift from Mark Carney and Mario Draghi was a sign that even the more dovish policy makers may be reluctantly accepting the possibility that monetary policy will become less accommodative.
With sterling and the euro both consolidating around their recent highs against the dollar, traders may be looking to today's PMI numbers to provide the catalyst for another push higher. We've seen a gradual improvement in sentiment in the euro area over the last year, as the economy finally begins to pick up following years of mediocre growth. The UK PMI has benefited greatly over the last year from the Brexit-related collapse in sterling, as foreign buyers look to take advantage of the much cheaper prices.
USD/CAD Daily Outlook
Daily Pivots: (S1) 1.2935; (P) 1.2972; (R1) 1.3000; More....
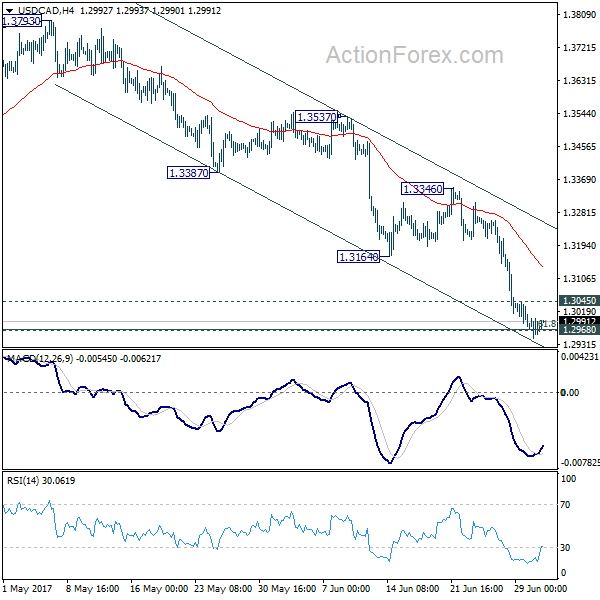
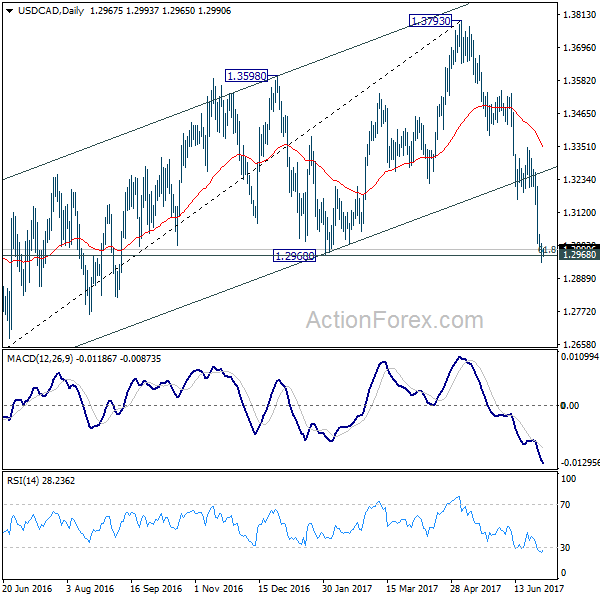
With 1.3045 minor support intact, further decline is still expected in USD/CAD. Sustained trading below 1.2968 cluster support, 61.8% retracement of 1.2460 to 1.3793 at 1.2969 will pave the way to retesting 1.2460 low. On the upside, above 1.3045 will indicate short term bottoming, possibly on bullish convergence condition in 4 hour MACD. In such case, stronger rebound would be seen back to 1.3164/3346 resistance zone first, before staying another decline.
In the bigger picture, price actions from 1.4689 medium term top are seen as a correction pattern. The second leg should have finished at 1.3793. Break of 1.2460 will tend such correction to 50% retracement of 0.9406 to 1.4869 at 1.2048. At this point, we'd look for strong support from there to contain downside and bring rebound. However, firm break there will target 100% projection of 1.4689 to 1.2460 from 1.3793 at 1.1564.
AUD/USD Daily Outlook
Daily Pivots: (S1) 0.7665; (P) 0.7689; (R1) 0.7710; More...
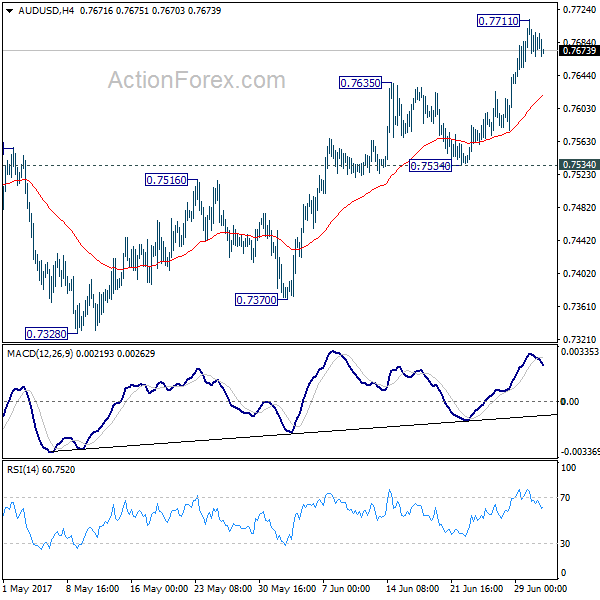
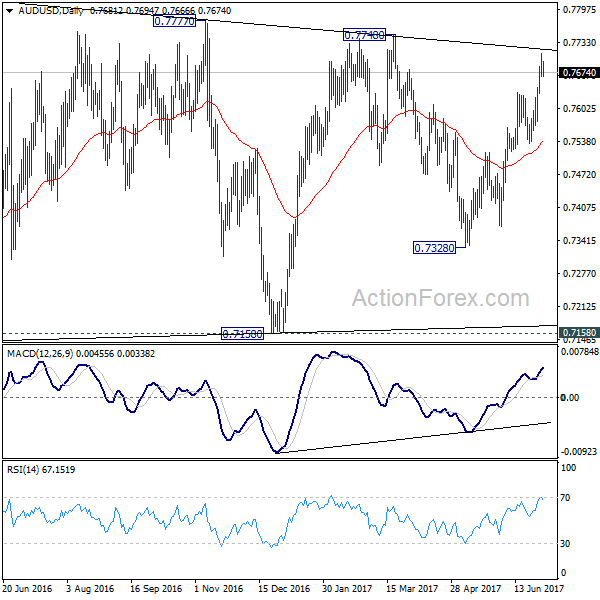
Intraday bias in AUD/USD remains neutral for consolidation below 0.7711 temporary top. Further rally is expected as long as 0.7534 support holds. Above 0.7711 will target 0.7748 resistance and above. At this point, there is no clear sign of range breakout yet. Hence, we'd be cautious on topping again as it approaches medium term fibonacci level at 0.7849. On the downside, break of 0.7534 will indicate near term reversal and turn bias back to the downside for 0.7370 support.
In the bigger picture, we're still treating price actions from 0.6826 low as a corrective pattern. And, as long as 38.2% retracement of 0.9504 to 0.6826 at 0.7849 holds, long term down trend from 1.1079 is expected to resume sooner or later. Break of 0.6826 low will target 0.6008 key support level. However, firm break of 0.7849 will indicate that rise from 0.6826 is developing into a medium term rebound, rather than a sideway pattern. In such case, stronger rise should be seen to 55 month EMA (now at 0.8096) and above.
EUR/USD Daily Outlook
Daily Pivots: (S1) 1.1394; (P) 1.1419 (R1) 1.1447; More.....
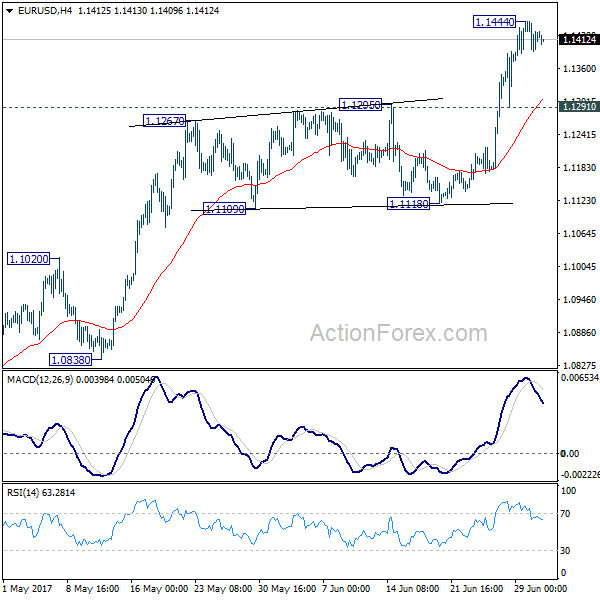
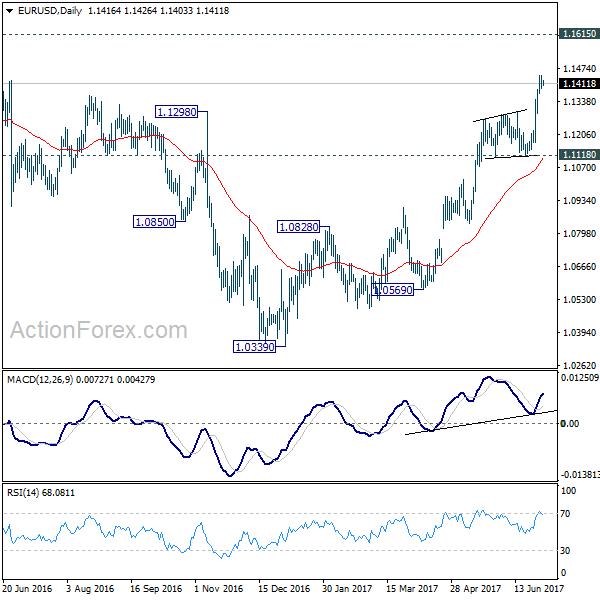
Intraday bias in EUR/USD remains neutral for consolidation below 1.1444 temporary top. Downside of retreat should be contained by 1.1291 support to bring another rise. Break of 1.1444 will extend the rally from 1.0339 low to 1.1615 resistance next.
In the bigger picture, the firm break of 1.1298 resistance further affirm medium term reversal. That is an important bottom was formed at 1.0339 on bullish convergence condition in weekly MACD. Further rise would be seen to 55 month EMA (now at 1.1776). Sustained break there will pave the way to 38.2% retracement of 1.6039 (2008 high) to 1.0339 (2017 low) at 1.2516 next. This will now remain the favored case as long as 1.1118 support holds.
GBP/USD Daily Outlook
Daily Pivots: (S1) 1.2970; (P) 1.3000; (R1) 1.3056; More...
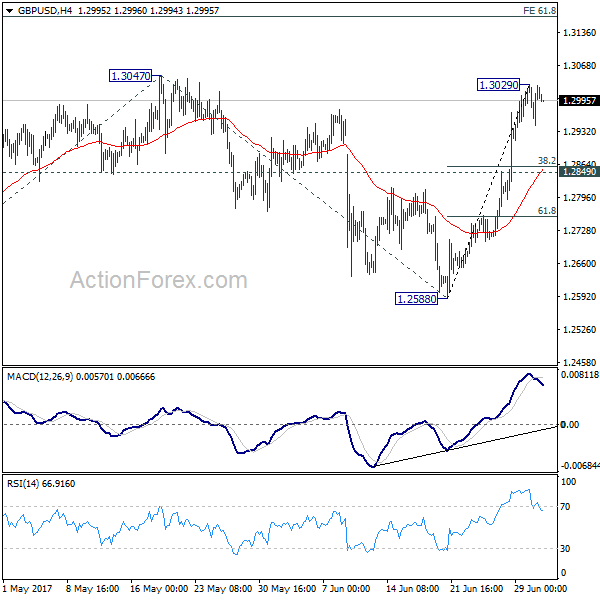
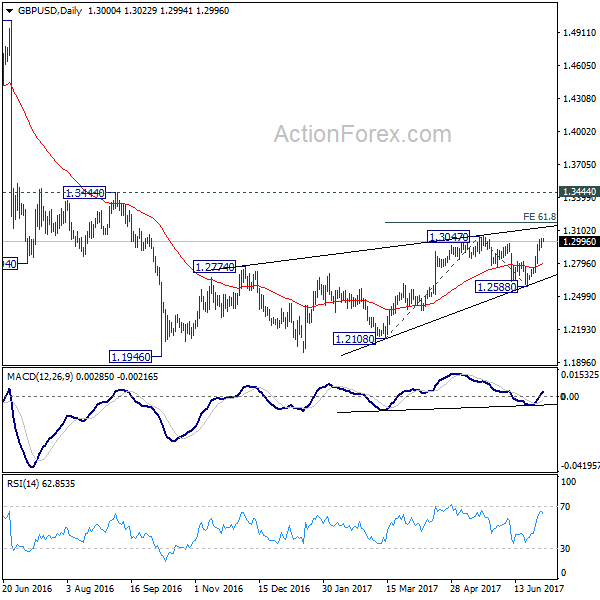
Intraday bias in GBP/USD remains neutral for consolidation below 1.3029 temporary top. Downside of retreat should be contained above 1.2849 support to bring rise resumption. Break of 1.3029 should then send GBP/USD through 1.3047 to 61.8% projection of 1.2108 to 1.3047 from 1.2588 at 1.3168 next.
In the bigger picture, overall, price actions from 1.1946 medium term low are seen as a corrective pattern that is still in progress. While further upside is now in favor, overall outlook remains bearish as long as 1.3444 key resistance holds. Larger down trend from 1.7190 is expected to resume later after the correction completes. And break of 1.2588 will indicate that such down trend is resuming.
USD/CHF Daily Outlook
Daily Pivots: (S1) 0.9558; (P) 0.9578; (R1) 0.9604; More.....
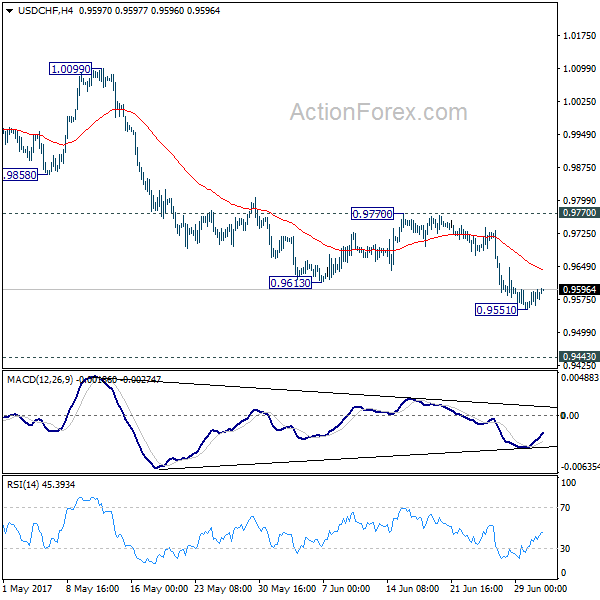
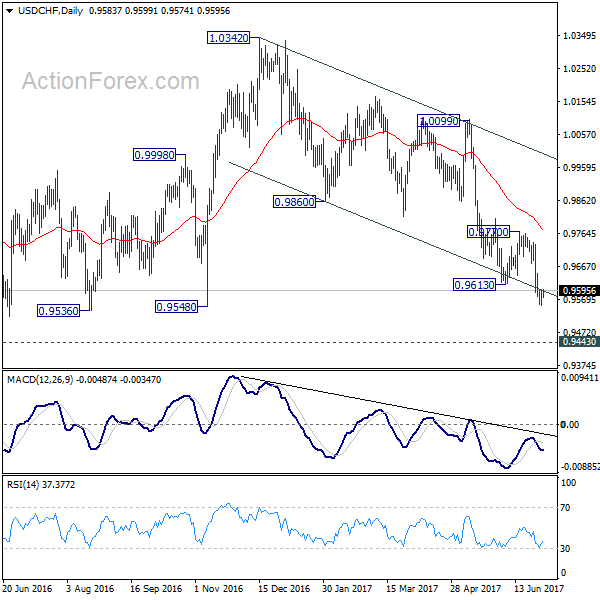
Intraday bias in USD/CHF remains neutral for consolidation above 0.9551 temporary low. Upside of recovery should be limited below 0.9770 resistance and bring resumption. Below 0.9551 will extend the decline from 1.0342 to 0.94443 key support level. At this point, we'd expect strong support from there to bring rebound.
In the bigger picture, USD/CHF is still bounded in medium term range of 0.9443/1.0342 for the moment. Consolidative trading would likely continue and medium term outlook remains neutral. Break of 1.0342 key resistance is needed to confirm underlying bullish momentum in the pair. Meanwhile, downside attempts should be contained by 0.9443 key support level. However, sustained break of 0.9443 will carry larger bearish implication and target 0.9 handle.
Weekly Technical Outlook And Review: EUR/USD, GBP/USD, AUD/USD, USD/JPY, USD/CAD, USD/CHF, DOW 30, GOLD
A note on lower timeframe confirming price action...
Waiting for lower timeframe confirmation is our main tool to confirm strength within higher timeframe zones, and has really been the key to our trading success. It takes a little time to understand the subtle nuances, however, as each trade is never the same, but once you master the rhythm so to speak, you will be saved from countless unnecessary losing trades. The following is a list of what we look for:
- A break/retest of supply or demand dependent on which way you're trading.
- A trendline break/retest.
- Buying/selling tails ... essentially we look for a cluster of very obvious spikes off of lower timeframe support and resistance levels within the higher timeframe zone.
- Candlestick patterns. We tend to only stick with pin bars and engulfing bars as these have proven to be the most effective.
We typically search for lower-timeframe confirmation between the M15 and H1 timeframes, since most of our higher-timeframe areas begin with the H4. Stops are usually placed 1-3 pips beyond confirming structures.
EUR/USD
Weekly gain/loss: + 225 pips
Weekly closing price: 1.1417
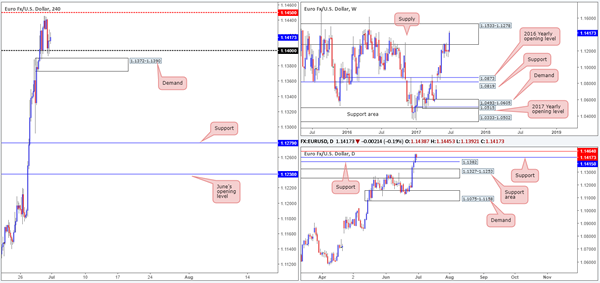
Over the last week, the EUR/USD bulls went on the offensive and aggressively closed within the walls of a major weekly supply zone drawn from 1.1533-1.1278. Considering that this area has been in motion since May 2015, and held price lower on several occasions since then, we feel the bears will not give up without a fight here!
Branching down to the daily candles, we can see that Friday's session turned red, consequently breaking a three-day bullish phase. With that being said though, the pair was unable to close below support at 1.1415. Should the bulls reignite momentum from here, the next area of interest can be seen at 1.1464: a major Quasimodo resistance level.
A quick recap of Friday's movement on the H4 timeframe reveals that the 1.14 handle, once again, provided support to this market. This number is closely supported by a demand coming in at 1.1372-1.1390, which we consider to be the original ‘decision point' that enabled price to initially break above 1.14. Also in view is the mid-level resistance at 1.1450. 34 pips above this number sits a strong-looking supply area (see back to the 4th May 2016) at 1.1529-1.1484 (seen higher on the chart), which along with the daily Quasimodo resistance level mentioned above at 1.1464, is the last remaining areas of higher-timeframe structures within the aforementioned weekly supply.
Our suggestions: While the bulls did have an incredibly strong week, we cannot ignore the fact that price remains trading within a major weekly supply. Additionally, it's also closely positioned to a major daily Quasimodo resistance as well as the H4 showing a strong-looking supply located nearby (see above for values).
Therefore, our team will be watching for price to strike the 1.1484/1.1464 region today/this week (underside of H4 supply/daily Quasimodo resistance) for a possible short trade. It might also be worth noting that stops set above 1.1450 (buy stops), alongside breakout buyers' orders, will likely provide liquidity for bigger players to sell! Just to be on the safe side though, we are recommending that a trade should only be qualified as viable should the H4 candles print a reasonably sized bearish candle, preferably in the shape of a full-bodied candle.
Data points to consider: US ISM manufacturing PMI at 3pm GMT+1.
Levels to watch/live orders:
- Buys: Flat (stop loss: N/A).
- Sells: 1.1484/1.1464 ([waiting for a reasonably sized H4 bear candle – preferably a full-bodied candle – to form before pulling the trigger is advised] stop loss: ideally beyond the candle's wick).
GBP/USD
Weekly gain/loss: + 308 pips
Weekly closing price: 1.3026
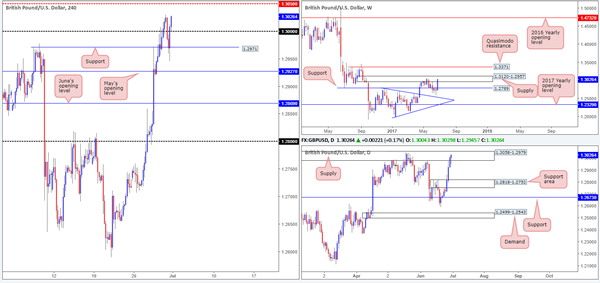
The GBP/USD had an absolutely smashing week, netting over 300 pips! This resulted in a near-full-bodied weekly bullish candle being created, which closed within the confines of a weekly supply zone printed at 1.3120-1.2957. In the event that the bulls continue to remain dominant, the next area in the firing range is a weekly Quasimodo resistance level at 1.3371.
From the daily timeframe, apart from Monday's session, the bulls printed back-to-back bullish candles throughout the week. This concluded with the unit closing trade within the walls of a supply zone marked at 1.3058-1.2979, which is essentially a partner supply to the aforementioned weekly supply. Beyond this barrier, the next base in view will likely be the supply area visible at 1.3278-1.3179 (seen higher on the chart).
H4 support at 1.2971, once again, held steady on Friday, following a selloff from highs of 1.3029. What's also notable from a technical perspective is that this occurred around the large psychological number 1.30. With the H4 candles seen closing strongly back above 1.30 on Friday, is there a chance that the bulls may continue to lift this market north today/this week? Well, in our opinion, there's little H4 structure to the left of current price that appears troubling until we reach the H4 mid-level resistance at 1.3050, followed by a Quasimodo resistance level at 1.3091 (seen higher on the chart).
Our suggestions: While a long is tempting above the 1.30 boundary given that it is a closely watched number, it is not a position that we'd label high probability considering the higher-timeframe technical landscape we're in at the moment.
In fact, shorts would probably be the better bet. Here's why:
Weekly supply at 1.3120-1.2957.
Daily supply at 1.3058-1.2979.
Mid-level H4 resistance at 1.3050/H4 Quasimodo resistance at 1.3091/1.31 psychological number.
For us, the best trade would be a short from the above noted H4 Quasimodo resistance level. Not only do we have the option of then placing stops ABOVE the said weekly supply, but we, alongside the bigger players, can use these stops taken from above the noted daily supply as liquidity i.e. looking to take advantage of a possible fakeout. Remember, stops above supplies are buy orders, and are thus liquidity for sellers!
Data points to consider: UK manufacturing PMI at 9.30am, BoE Gov. Carney speaks at 1pm. US ISM manufacturing PMI at 3pm GMT+1.
Levels to watch/live orders:
- Buys: Flat (stop loss: N/A).
- Sells: 1.3091 (stop loss: 1.3122).
AUD/USD:
Weekly gain/loss: + 114 pips
Weekly closing price: 0.7682
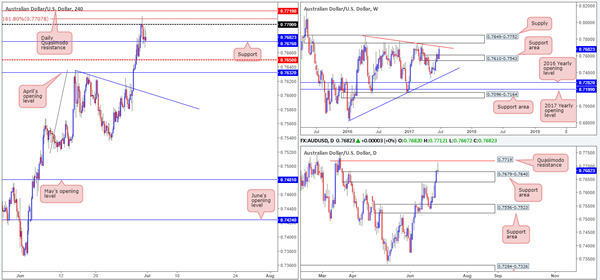
After breaking above 0.7610-0.7543 and retesting this area as a weekly support, this revived demand for the Aussie dollar last week and ended with price testing a weekly trendline resistance extended from the high 0.7835. In view of this line being positioned just beneath a weekly supply at 0.7849-0.7752, we believe there's a chance the pair may see the unit punch higher before turning south.
Zooming in and looking at the daily timeframe, we can see that the candles swallowed the 0.7679-0.7640 area on Thursday and retested it as support on Friday. The retest, however, was not convincing and concluded forming a rather aggressive selling wick. This was, we believe, due to two things:
Weekly price connecting with the said weekly trendline resistance!
Daily price coming within an inch of testing a daily Quasimodo resistance level at 0.7719.
A brief look at recent dealings on the H4 timeframe shows price whipsawed through the 0.77 handle and touched gloves with a 161.8% ext. at 0.7708 taken from the low at 0.7519. This, as you can see, sent the pair back down to support at 0.7676 going into Friday's close.
Our suggestions: Through the lens of a technical trader, this is a somewhat difficult market to trade at the moment. Although the weekly timeframe suggests that selling could be the way forward, both the H4 and daily charts suggest otherwise! Therefore, we believe neither a long nor short is attractive right now.
Data points to consider: Chinese Caixin manufacturing PMI at 2.45am. US ISM manufacturing PMI at 3pm GMT+1.
Levels to watch/live orders:
- Buys: Flat (stop loss: N/A).
- Sells: Flat (stop loss: N/A).
USD/JPY
Weekly gain/loss: + 108 pips
Weekly closing price: 112.37
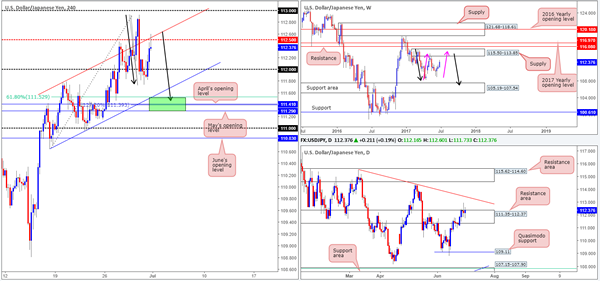
With weekly price recently finding a floor of support around the 110.30 mark, a potential AB=CD correction (see pink arrows) that completes within supply pegged at 115.50-113.85 could take shape this week. What's also notable from a technical perspective is that this supply zone has already managed to cap upside beautifully in early May, so there's a good chance of history repeating itself here.
Despite weekly price showing signs of heading higher this week, daily action continues to hang on by a thread around the upper edge of a daily resistance area penciled in at 111.35-112.37. This zone has been active since late January, so it is certainly not a base one should ignore. Providing that this area remains in position, the next downside target from here can be seen at 109.11: a Quasimodo support level. A break to the upside, nevertheless, has the trendline resistance taken from the high 115.50 to target.
Moving over to the H4 timeframe, the picture shows a possible AB=CD bullish formation in the works. The competition point for this pattern (the green area) is comprised of both May/April's opening levels at 111.29/111.41, the AB=CD 127.2% ext. at 111.93 and a 61.8% Fib support at 111.52. What's also interesting here is that this buy zone is positioned just beneath a H4 channel support line extended from the low 110.64, so this could encourage a possible fakeout below the ascending line.
Our suggestions: While a buy from the green H4 area is tempting, we have to take into account that there's no higher-timeframe support converging with this zone. Therefore, despite the confluence, it is still a risky trade. One way of overcoming this is to wait for a H4 bull candle to form, preferably in the shape of a full-bodied candle, as this will help pin down buyer intent.
Data points to consider: US ISM manufacturing PMI at 3pm GMT+1.
Levels to watch/live orders:
- Buys: 111.29/111.52 ([waiting for a reasonably sized H4 bull candle – preferably a full-bodied candle – to form before pulling the trigger is advised] stop loss: ideally beyond the candle's tail).
- Sells: Flat (stop loss: N/A).
USD/CAD
Weekly gain/loss: – 303 pips
Weekly closing price: 1.2962
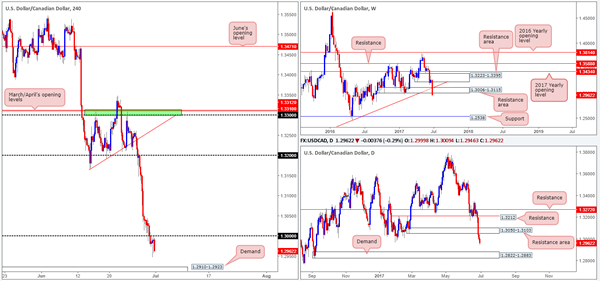
The USD/CAD suffered a nasty decline in value last week, losing over 300 pips in the process! Consequent to this, weekly price is now trading beneath the 1.3006-1.3115 area, which was a respected area of support. Worryingly for the bulls on the weekly timeframe is that the the next area of interest is a weekly support level coming in at 1.2538. By the same token, the daily timeframe also shows room to move down to at least the demand base drawn from 1.2822-1.2883.
Recent trading on the H4 timeframe shows us that the large psychological number 1.30 was taken out and then later retested as a resistance on Friday. There are two things we like here:
Not only is there room seen for the pair to trade lower on the higher timeframes, but there is also space for a move lower on the H4 timeframe down to demand penciled in at 1.2910-1.2923.
Friday's closing candle is, in our humble opinion, a signal to suggest that the bears will now look to take things lower.
Our suggestions: With the above two points in mind, our team has taken a small short position at 1.2970 with a stop-loss order positioned above 1.30 at 1.3005 (a 35-pip stop). The initial target is the aforementioned H4 demand. So, this gives a 47-pip target – nearly 1.5 times our risk.
Data points to consider: US ISM manufacturing PMI at 3pm GMT+1.
Levels to watch/live orders:
- Buys: Flat (Stop loss: N/A).
- Sells: 1.2970 ([live] stop loss: 1.3005).
USD/CHF
Weekly gain/loss: – 108 pips
Weekly closing price: 0.9583
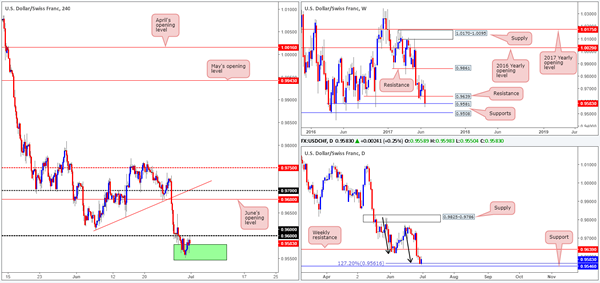
The USD/CHF fell sharply last week, consequently running through the weekly support level at 0.9639 and shaking hands with weekly support at 0.9581. Providing that this level holds steady, we believe that 0.9639 will likely be retested as resistance.
The story on the daily chart shows that price has begun showing signs of buyer intent from an AB=CD 127.2% ext. at 0.9561, which is positioned just ahead of a support level pegged at 0.9546. Similar to the weekly timeframe, should the current daily level hold firm then the next area on the hit list will likely be the said weekly resistance level.
For those who read previous reports you may recall that our desk highlighted the green H4 area at 0.9546/0.9581 (comprised of weekly and daily supports – see above) as a possible buy zone. At the time of writing, our desk remains long this market from 0.9567 with a stop positioned below the daily support (0.9546) at 0.9544. The entry trigger came in the shape of near-full-bodied bullish candle late on Thursday.
Our suggestions: Ultimately, we're looking for price to take out the 0.96 number, which should then free the path north up to the weekly resistance level at 0.9639 – an ideal take-profit level!
Apart from our current trade one could look to long on a close above 0.96. However, this would entail one finding a small enough stop-loss order to accommodate reasonable risk/reward up to 0.9639.
Data points to consider: US ISM manufacturing PMI at 3pm GMT+1.
Levels to watch/live orders:
- Buys: 0.9567 ([live] stop loss: 0.9544).
- Sells: Flat (stop loss: N/A).
DOW 30:
Weekly gain/loss: – 14 points
Weekly closing price: 21372
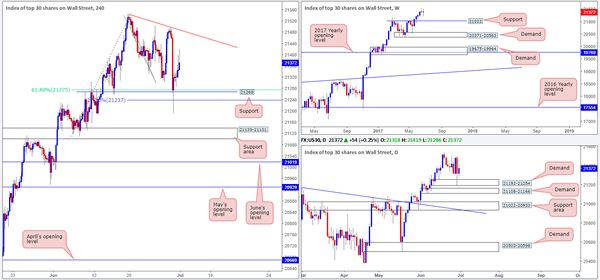
US equity prices are effectively unchanged this week, which led to a clear-cut weekly indecision candle forming. From the weekly timeframe, it is clear to see that this market's underlying trend is strong. However, should the index pullback, the support level drawn from 21022 is likely the area where we'll see the bulls make an appearance.
Daily demand at 21192-21254 was brought into view last week. Despite this area having its entire range challenged, it managed to remain strong.
In Friday's report, we mentioned that our desk took a long trade at 21323, following the large H4 bull candle that formed off the H4 support level marked at 21268. What attracted us to this point was that the H4 level converged with a H4 61.8% Fib support level at 21275 taken from the low 21108 as well as a H4 127.2% Fib ext. point 21237 drawn from the high 21541 and also because of the aforementioned daily demand currently in play.
Our suggestions: Ultimately, we are watching for H4 price to challenge the trendline resistance extended from the high 21541. This is an ideal place to think about reducing risk to breakeven and maybe taking some of the position off the table.
Data points to consider: US ISM manufacturing PMI at 3pm GMT+1.
Levels to watch/live orders:
- Buys: 21323 ([live] stop loss: 21188).
- Sells: Flat (stop loss: N/A).
GOLD:
Weekly gain/loss: – $15
Weekly closing price: 1241.3
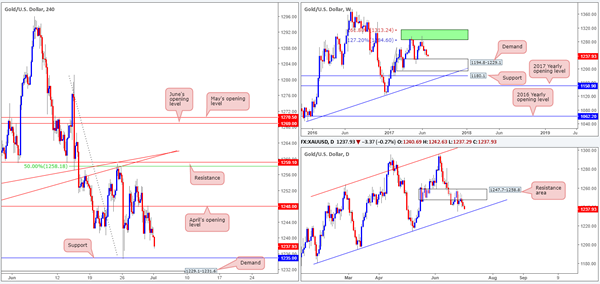
In last week's weekly report, we highlighted the prominent weekly buying tail that took shape. Our reasoning behind this candle formation not qualifying as an eligible buy signal was due to where it formed: it had absolutely no support! As we can all see, in this instance we were correct and the bears continued to pummel the metal lower last week, consequently bringing the unit down to within striking distance of a weekly demand base coming in at 1194.8-1229.1.
From the daily scale, bullion is seen trading from a resistance area coming in at 1247.7-1258.8. Should the bears remain in the driving seat then the next area on the radar for our team would be the channel support extended from the low 1180.4, which happens to intersect with the said weekly demand.
April's opening level at 1248.0 managed to hold firm as resistance last week on the H4 chart, which looks as though this will send the metal down to H4 support at 1235.0, followed closely by H4 demand at 1229.1-1231.6 (this area is positioned on top of the aforementioned weekly demand zone).
Our suggestions: Basically, given the above points our team is now watching the current H4 demand for a potential long opportunity this week. The stops beneath the said H4 support level will likely provide the big boys a reasonable amount of liquidity to buy into, and also let's not forget how well connected the H4 demand zone is to both the weekly demand area and the daily channel support line (see above). However, seeing as this H4 demand base is rather small in size, a fakeout is likely to occur. We feel the best way to deal with this is simply wait for a H4 bullish candle to form, preferably a full or near-full-bodied candle, before pulling the trigger.
Levels to watch/live orders:
- Buys: 1229.1-1231.6 ([waiting for a reasonably sized H4 bull candle – preferably a full-bodied candle – to form before pulling the trigger is advised if you want to help avoid a potential fakeout] stop loss: ideally beyond the candle's tail).
- Sells: Flat (stop loss: N/A).
European Open Briefing: The US Dollar Recovered Slightly Overnight
Global Markets:
- Asian stock markets: Nikkei up 0.20 %, Shanghai Composite gained 0.05 %, Hang Seng fell 0.05 %, ASX 200 declined 0.35 %
- Commodities: Gold at $1238 (-0.30 %), Silver at $16.58 (+0.05 %), WTI Oil at $46.20 (+0.35 %), Brent Oil at $48.85 (+0.15 %)
- Rates: US 10-year yield at 2.33, UK 10-year yield at 1.26, German 10-year yield at 0.47
News & Data
- China Caixin Manufacturing PMI 50.4 vs 49.5 expected
- Australia Building Approvals -5.6 % vs -1.3 % expected
- Japan Tankan Large Manufacturers Index 17.0 vs 15.0 expected
- Japan Large Non-Manufacturers Index 23.0 vs 23.0 expected
- Japan Tankan All Big Industry CAPEX 8.0 % vs 7.4 % expected
- Japan Manufacturing PMI 52.4 vs 52.0 expected
- South Korea Manufacturing PMI 50.1 vs 49.2 previous
CFTC Positioning Data:
- EUR long 59K vs 45K long last week
- GBP short 39K vs 38K short last week
- JPY short 61K vs 50K short last week
- CHF short 5K vs 3K short last week
- CAD short 49K vs 82K short
- AUD long 20k vs long 15k last week
- NZD long 25K vs 21K long last week
Markets Update:
The US Dollar recovered slightly overnight. EUR/USD started the new trading week around 1.1425 and declined to 1.1405. EUR/USD is oversold in the short-term, but is likely to run into decent demand on larger retracements. Support is seen at 1.1370 and again at 1.1320.
GBP/USD opened at 1.2995, roughly 30 pips lower from Friday's close. During the Asian session, it retraced its initial losses, but eventually fell back to 1.2995. Meanwhile, the Yen weakened despite solid Japanese economic data overnight. USD/JPY started the day around 112.05 – down 40 pips from Friday's close – but rallied to a high of almost 112.60 later in the session. Rising stock markets supported the pair. Resistance is next seen at 113.00.
AUD/USD traded in a tight range overnight (0.7667-95), and so did NZD/USD (0.7315-45). USD/CAD is heavily oversold near-term, and recovered somewhat in Asia. The pair bounced from 1.2960 and rose to 1.2990. Resistance is seen at 1.3030 and ahead of 1.31. While the downtrend remains strong, the charts suggest the pair could recover further in the near-term.
Upcoming Events:
- 08:15 BST – Swiss Retail Sales
- 08:45 BST – Italian Manufacturing PMI
- 08:50 BST – French Manufacturing PMI
- 08:55 BST – German Manufacturing PMI
- 09:00 BST – Euro Zone Manufacturing PMI
- 09:30 BST – UK Manufacturing PMI
- 10:00 BST – Euro Zone Unemployment Rate
- 13:00 BST – Bank of England Governor Carney speaks
- 14:45 BST – US Manufacturing PMI
- 15:00 BST – US ISM Manufacturing PMI
The Week Ahead:
Tuesday, July 4th
- 02:30 BST – Australian Retail Sales
- 09:30 BST – UK Construction PMI
- 13:30 BST – ECB Member Praet speaks
Wednesday, July 5th
- 02:45 BST – Chinese Caixin Services PMI
- 08:45 BST – Italian Services PMI
- 08:50 BST – French Services PMI
- 08:55 BST – German Services PMI
- 09:00 BST – Euro Zone Services PMI
- 09:30 BST – UK Services PMI
- 10:00 BST – Euro Zone Retail Sales
- 15:00 BST – US Factory Orders
- 19:00 BST – FOMC Meeting Minutes
Thursday, July 6th
- 02:30 BST – Australian Trade Balance
- 08:15 BST – Swiss CPI
- 08:45 BST – FOMC Member Williams speaks
- 12:30 BST – ECB Meeting Minutes
- 13:15 BST – US ADP Nonfarm Employment Change
- 13:30 BST – US Initial Jobless Claims
- 13:30 BST – US Trade Balance
- 13:30 BST – Canadian Trade Balance
- 14:45 BST – US Services PMI
- 15:00 BST – US ISM Non-Manufacturing PMI
- 16:00 BST – US Crude Oil Inventories
Friday, July 7th
- 00:30 BST – FOMC Member Fischer speaks
- 06:45 BST – Swiss Unemployment Rate
- 07:00 BST – German Industrial Production
- 08:30 BST – UK Halifax House Price Index
- 09:30 BST – UK Manufacturing Production
- 09:30 BST – UK Industrial Production
- 09:30 BST – UK Trade Balance
- 13:30 BST – US NFP
- 13:30 BST – US Unemployment Rate
- 13:30 BST – Canadian Unemployment Rate
- 13:30 BST – Canadian Employment Change
- 15:00 BST – Canadian Ivey PMI